| Param | Original file | Final file |
|---|---|---|
| Filename | modeM0/AS1C06_006T06_9000004608_31593cztM0_level2.evt | modeM0/AS1C06_006T06_9000004608_31593cztM0_level2_quad_clean.evt |
| Size (bytes) | 292,069,440 | 53,415,360 |
| Size | 278.5 MB | 50.9 MB |
| Events in quadrant A | 1,336,417 | 367,900 |
| Events in quadrant B | 3,528,501 | 338,434 |
| Events in quadrant C | 1,396,672 | 353,808 |
| Events in quadrant D | 2,377,250 | 341,559 |
| Mode M0 | |||
|---|---|---|---|
| Quadrant | BADHDUFLAG | Total packets | Discarded packets |
| A | 0 | 6053 | 0 |
| B | 0 | 12602 | 0 |
| C | 0 | 6155 | 0 |
| D | 0 | 9100 | 0 |
| Mode SS | |||
|---|---|---|---|
| Quadrant | BADHDUFLAG | Total packets | Discarded packets |
| A | 0 | 60 | 0 |
| B | 0 | 60 | 0 |
| C | 0 | 60 | 0 |
| D | 0 | 60 | 0 |
| Quadrant | Total seconds | Saturated seconds | Saturation percentage |
|---|---|---|---|
| A | 3025 | 0 | 0.000000% |
| B | 3026 | 427 | 14.111038% |
| C | 3026 | 40 | 1.321877% |
| D | 3026 | 19 | 0.627892% |
Noise dominated data is calculated using 1-second bins in cleaned event files. If a bin has >2000 counts, and if more than 50% of those come from <1% of pixels, then it is considered to be noise-dominated and hence unusable.
| Quadrant | # 1 sec bins | Bins with >0 counts | Bins with >2000 counts | High rate bins dominated by noise | Noise dominated (total time) | Noise dominated (detector-on time) | Marked lightcurve |
|---|---|---|---|---|---|---|---|
| A | 3025 | 3025 | 0 | 0 | 0.00% | 0.00% |  |
| B | 3026 | 3026 | 389 | 389 | 12.86% | 12.86% |  |
| C | 3026 | 3026 | 1 | 1 | 0.03% | 0.03% | 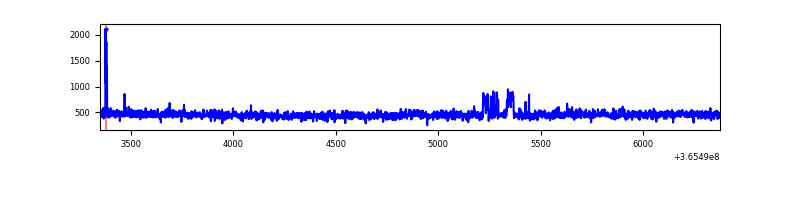 |
| D | 3026 | 3026 | 16 | 16 | 0.53% | 0.53% | 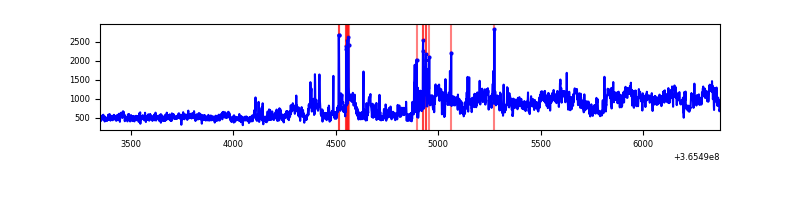 |
Top three noisy pixels from each quadrant. If the there are fewer than three noisy pixels in the level2.evt file, extra rows are filled as -1
| Pixel properties | Quadrant properties | ||||||
|---|---|---|---|---|---|---|---|
| Quadrant | DetID | PixID | Counts | Sigma | Mean | Median | Sigma |
| A | 13 | 254 | 5173 | 67.88 | 346 | 339 | 71.2 |
| A | 3 | 137 | 3375 | 42.63 | 346 | 339 | 71.2 |
| A | 0 | 226 | 2969 | 36.93 | 346 | 339 | 71.2 |
| B | 12 | 1 | 1148733 | 18422.54 | 320 | 312 | 62.3 |
| B | 6 | 159 | 778226 | 12479.01 | 320 | 312 | 62.3 |
| B | 4 | 80 | 242861 | 3890.88 | 320 | 312 | 62.3 |
| C | 14 | 238 | 66024 | 838.62 | 327 | 328 | 78.3 |
| C | 14 | 254 | 18802 | 235.82 | 327 | 328 | 78.3 |
| C | 3 | 233 | 10527 | 130.19 | 327 | 328 | 78.3 |
| D | 8 | 195 | 973946 | 12098.12 | 334 | 325 | 80.5 |
| D | 12 | 218 | 54835 | 677.34 | 334 | 325 | 80.5 |
| D | 12 | 233 | 25400 | 311.58 | 334 | 325 | 80.5 |
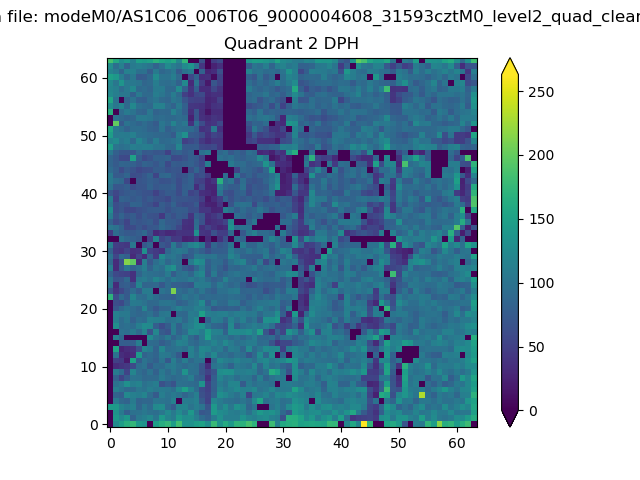
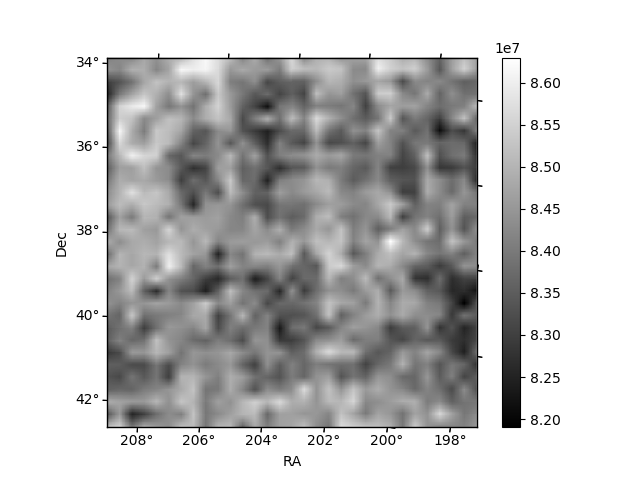
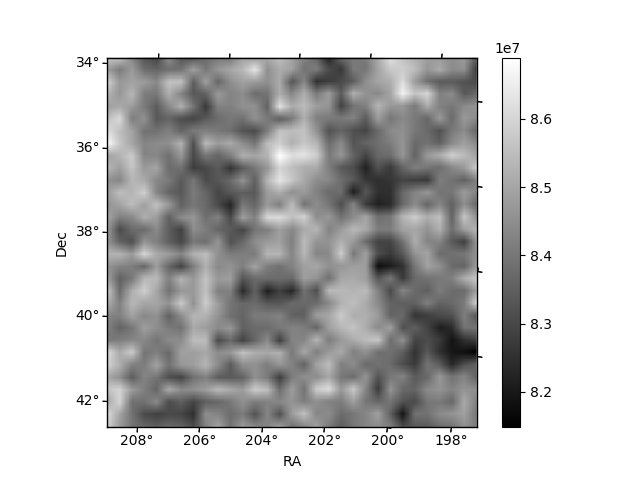
Histogram calculated using DETX and DETY for each event in the final _common_clean file
| Quadrant A | 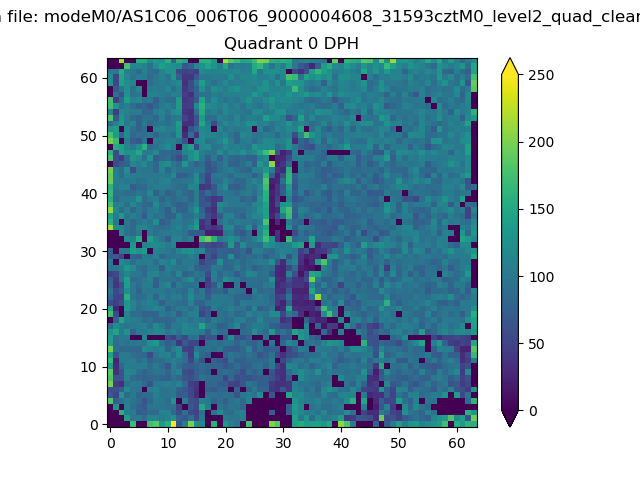 |
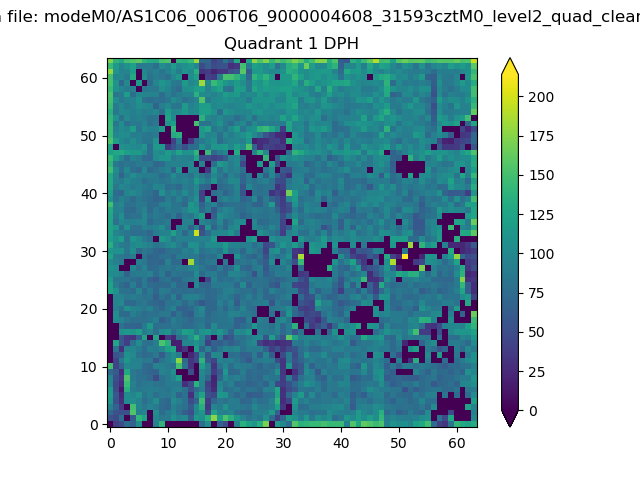 |
Quadrant B |
|---|---|---|---|
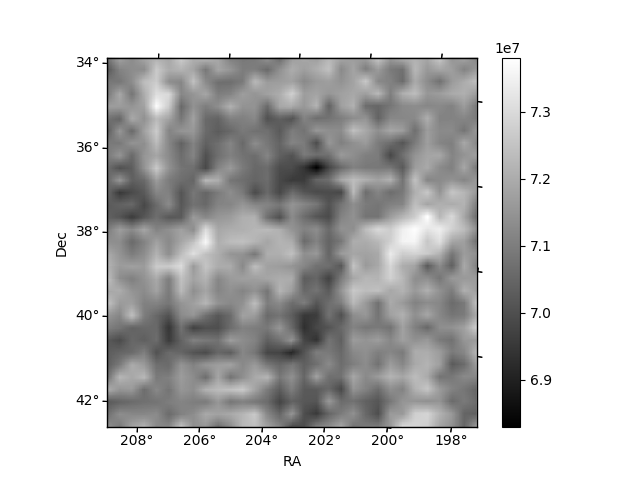
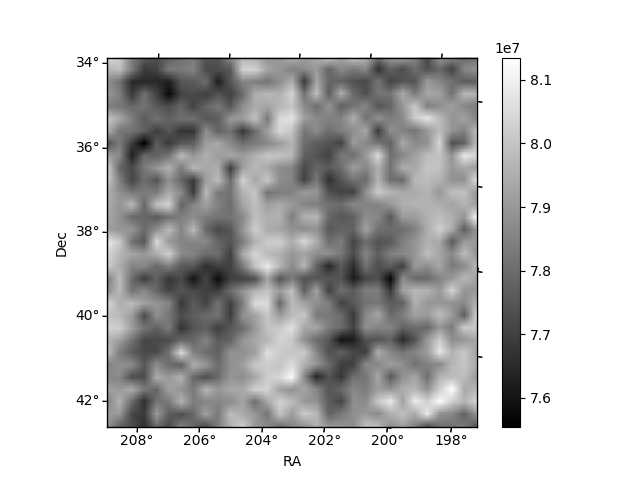
| Quadrant D | 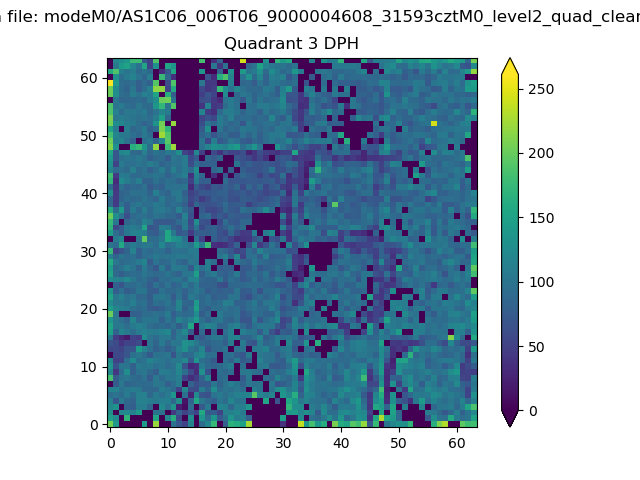 |
 |
Quadrant C |
| Plot type | Count rate plots | Images |
|---|---|---|
| Comparison with Poisson distribution Blue bars denote a histogram of data divided into 1 sec bins. Red curve is a Poisson curve with rate = median count rate of data. |
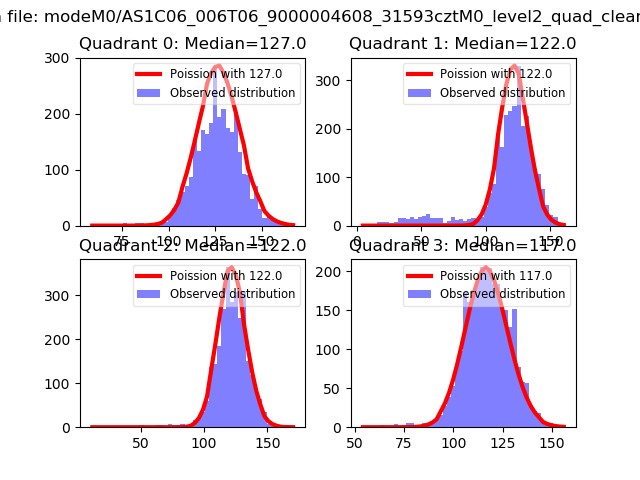 |
 |
| Quadrant-wise count rates Data is divided into 100 sec bins |
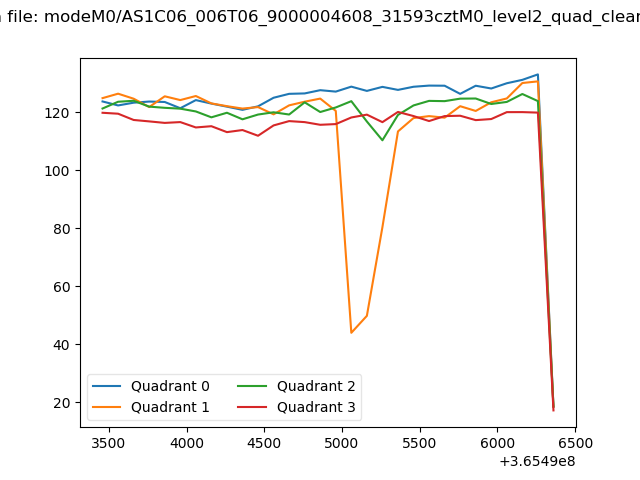 |
|
| Module-wise count rates for Quadrant A Data is divided into 100 sec bins |
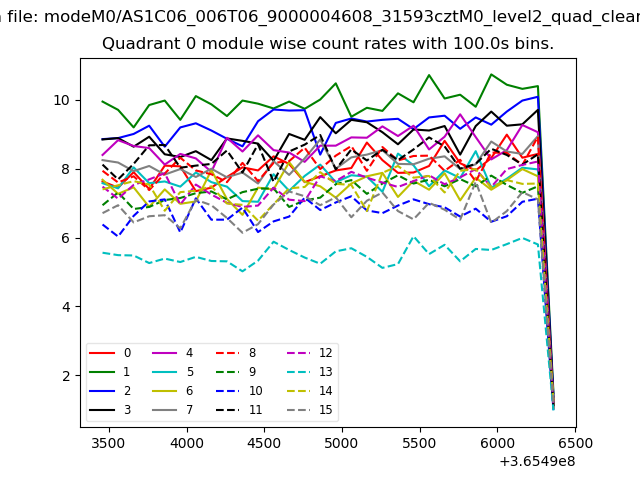 |
 |
| Module-wise count rates for Quadrant B Data is divided into 100 sec bins |
 |
 |
| Module-wise count rates for Quadrant C Data is divided into 100 sec bins |
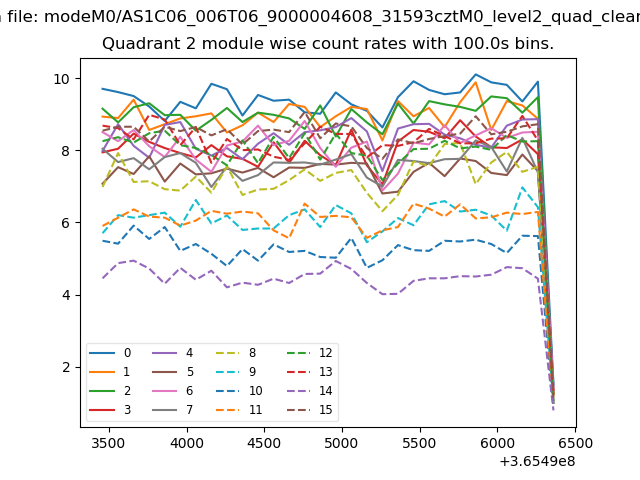 |
 |
| Module-wise count rates for Quadrant D Data is divided into 100 sec bins |
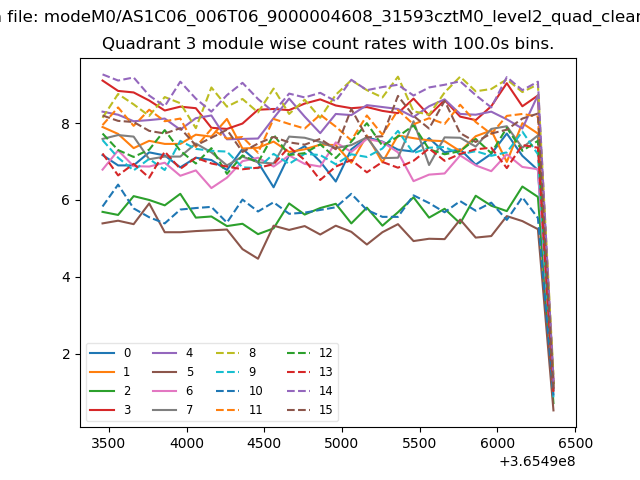 |
 |
| Parameter | Plot |
|---|---|
| CZT HV Monitor | 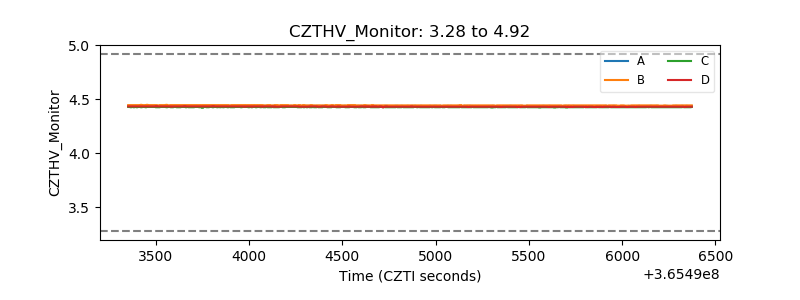 |
| D_VDD | 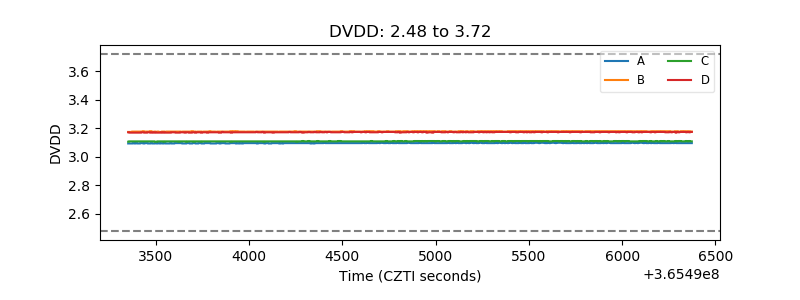 |
| Temperature 1 | 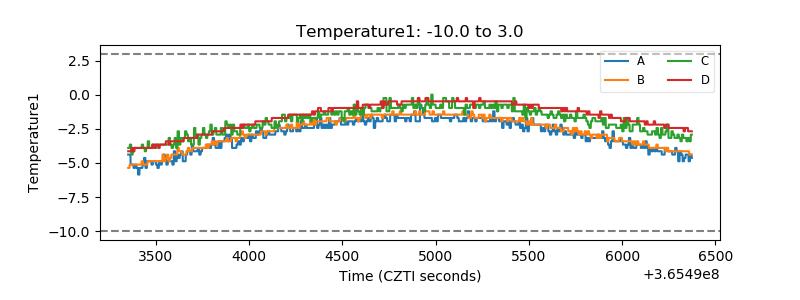 |
| Veto HV Monitor |  |
| Veto LLD | 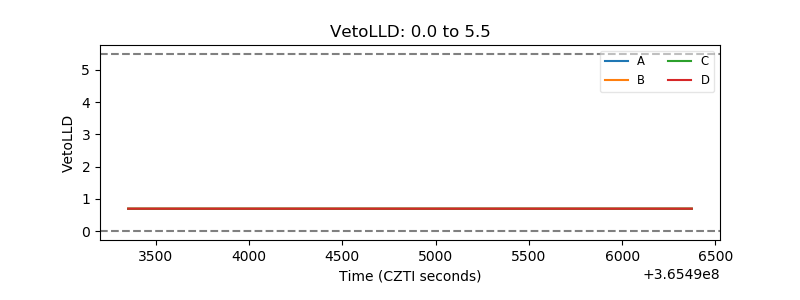 |
| Alpha Counter | 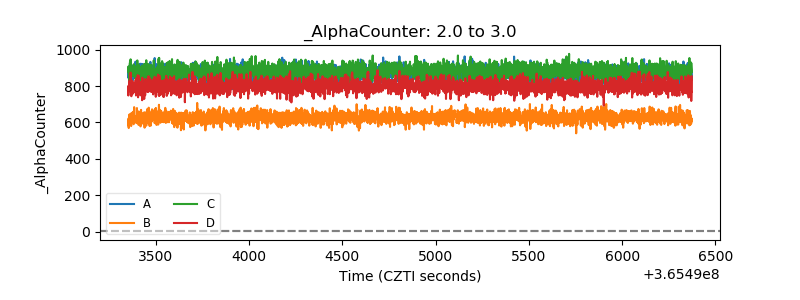 |
| _CPM_Rate | 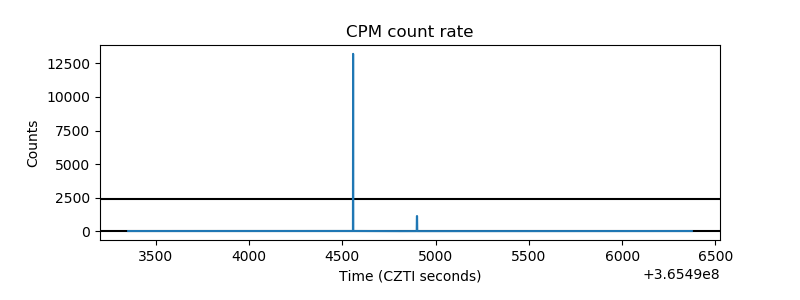 |
| CZT Counter | 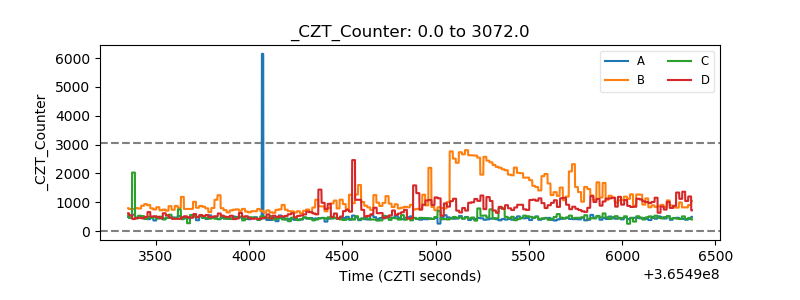 |
| +2.5 Volts monitor |  |
| +5 Volts monitor |  |
| _ROLL_ROT | 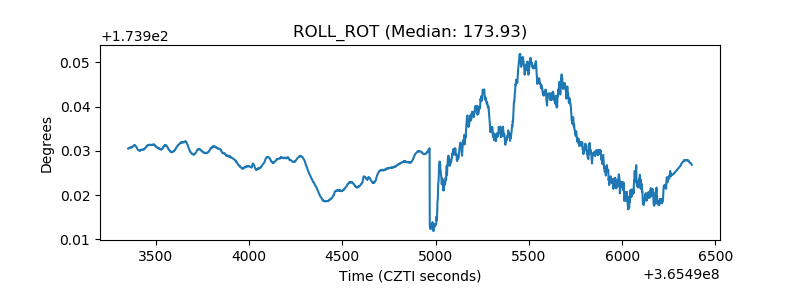 |
| _Roll_DEC |  |
| _Roll_RA | 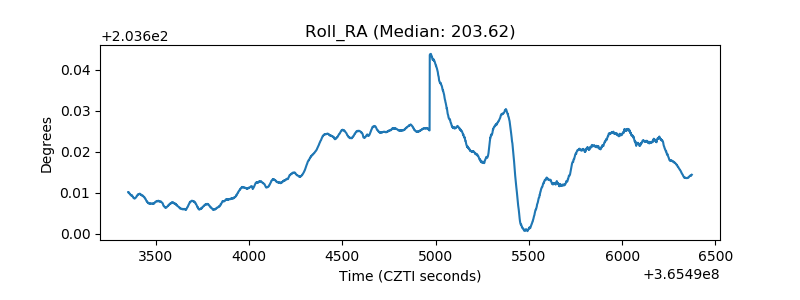 |
| Veto Counter | 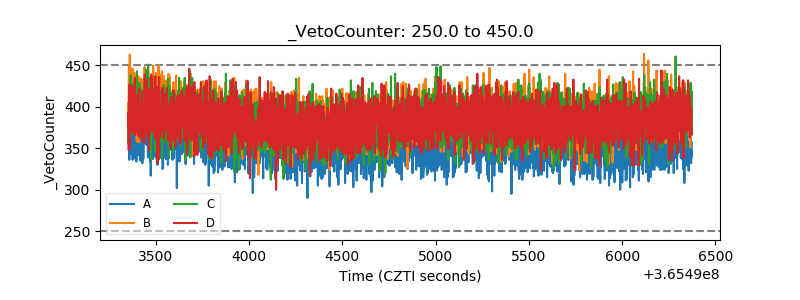 |