| Param | Original file | Final file |
|---|---|---|
| Filename | modeM0/AS1C06_002T03_9000004610cztM0_level2.fits | modeM0/AS1C06_002T03_9000004610cztM0_level2_quad_clean.evt |
| Size (bytes) | 712,676,160 | 928,324,800 |
| Size | 679.7 MB | 885.3 MB |
| Events in quadrant A | 4,198,662 | 5,692,906 |
| Events in quadrant B | 4,219,195 | 6,081,024 |
| Events in quadrant C | 4,291,470 | 5,970,212 |
| Events in quadrant D | 3,610,426 | 5,120,063 |
| Mode M0 | |||
|---|---|---|---|
| Quadrant | BADHDUFLAG | Total packets | Discarded packets |
| A | 0 | 219072 | 0 |
| B | 0 | 253353 | 0 |
| C | 0 | 191358 | 0 |
| D | 0 | 283741 | 0 |
| Mode SS | |||
|---|---|---|---|
| Quadrant | BADHDUFLAG | Total packets | Discarded packets |
| A | 0 | 1568 | 0 |
| B | 0 | 1574 | 0 |
| C | 0 | 1564 | 0 |
| D | 0 | 1570 | 0 |
| Mode M9 | |||
|---|---|---|---|
| Quadrant | BADHDUFLAG | Total packets | Discarded packets |
| A | 0 | 113 | 0 |
| B | 0 | 113 | 0 |
| C | 0 | 113 | 0 |
| D | 0 | 113 | 0 |
| Quadrant | Total seconds | Saturated seconds | Saturation percentage |
|---|---|---|---|
| A | 76574 | 10070 | 13.150678% |
| B | 76505 | 3618 | 4.729103% |
| C | 76729 | 4538 | 5.914322% |
| D | 76470 | 7865 | 10.285079% |
Noise dominated data is calculated using 1-second bins in cleaned event files. If a bin has >2000 counts, and if more than 50% of those come from <1% of pixels, then it is considered to be noise-dominated and hence unusable.
| Quadrant | # 1 sec bins | Bins with >0 counts | Bins with >2000 counts | High rate bins dominated by noise | Noise dominated (total time) | Noise dominated (detector-on time) | Marked lightcurve |
|---|---|---|---|---|---|---|---|
| A | 94871 | 76340 | 0 | 0 | 0.00% | 0.00% |  |
| B | 94871 | 76585 | 0 | 0 | 0.00% | 0.00% | 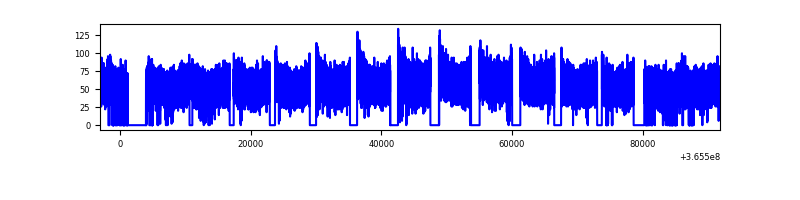 |
| C | 94871 | 76813 | 0 | 0 | 0.00% | 0.00% | 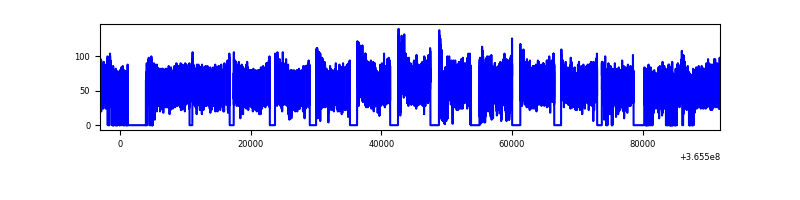 |
| D | 94871 | 76446 | 0 | 0 | 0.00% | 0.00% | 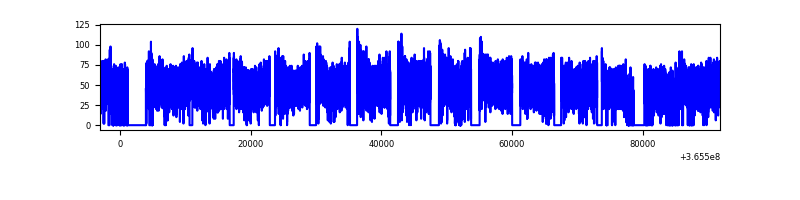 |
Top three noisy pixels from each quadrant. If the there are fewer than three noisy pixels in the level2.evt file, extra rows are filled as -1
| Pixel properties | Quadrant properties | ||||||
|---|---|---|---|---|---|---|---|
| Quadrant | DetID | PixID | Counts | Sigma | Mean | Median | Sigma |
| A | 0 | 29 | 3519 | 9.35 | 1093 | 1031 | 266.2 |
| A | 7 | 110 | 3260 | 8.37 | 1093 | 1031 | 266.2 |
| A | 9 | 19 | 3212 | 8.19 | 1093 | 1031 | 266.2 |
| B | 2 | 9 | 3395 | 10.72 | 1120 | 1074 | 216.6 |
| B | 3 | 80 | 2919 | 8.52 | 1120 | 1074 | 216.6 |
| B | 2 | 8 | 2839 | 8.15 | 1120 | 1074 | 216.6 |
| C | 12 | 241 | 3117 | 7.19 | 1140 | 1075 | 284.1 |
| C | 3 | 187 | 2953 | 6.61 | 1140 | 1075 | 284.1 |
| C | 3 | 126 | 2856 | 6.27 | 1140 | 1075 | 284.1 |
| D | 10 | 189 | 2660 | 6.32 | 1034 | 942 | 271.9 |
| D | 15 | 47 | 2658 | 6.31 | 1034 | 942 | 271.9 |
| D | 7 | 3 | 2633 | 6.22 | 1034 | 942 | 271.9 |
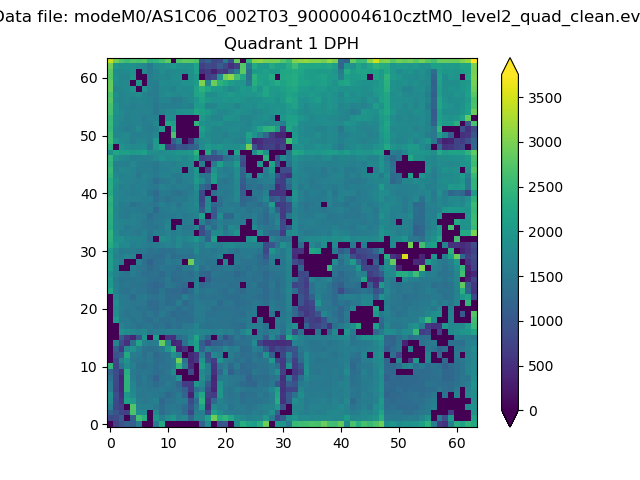
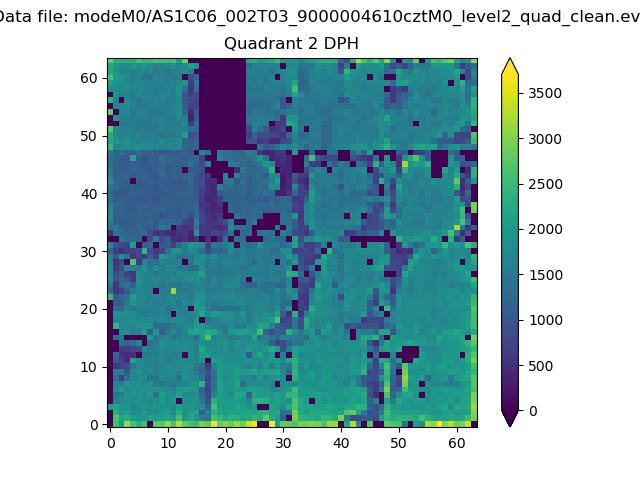
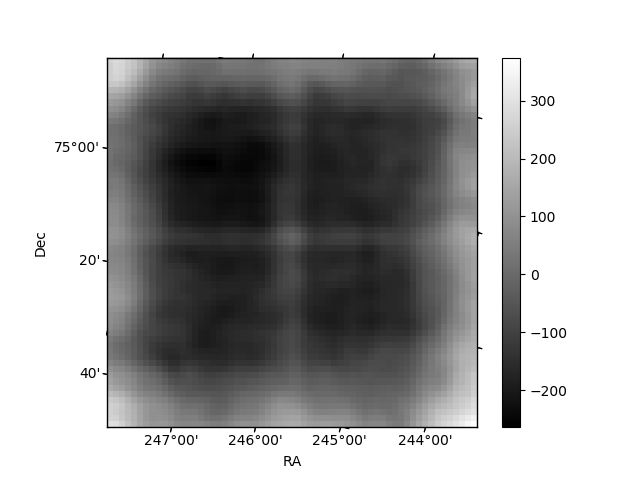
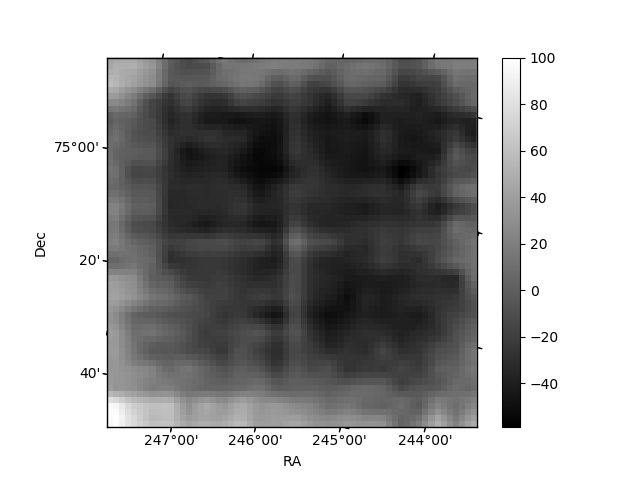
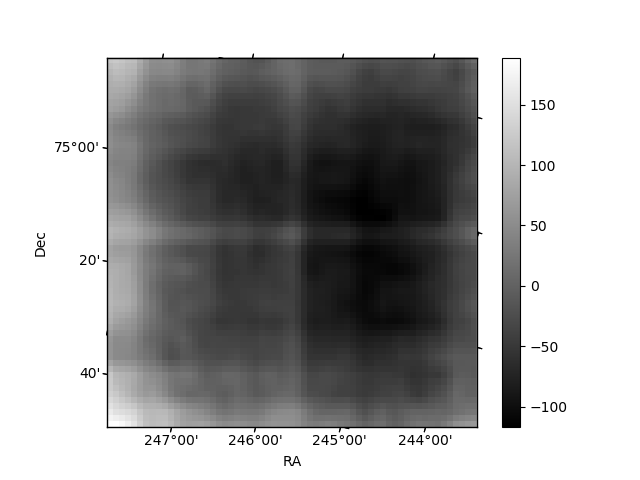
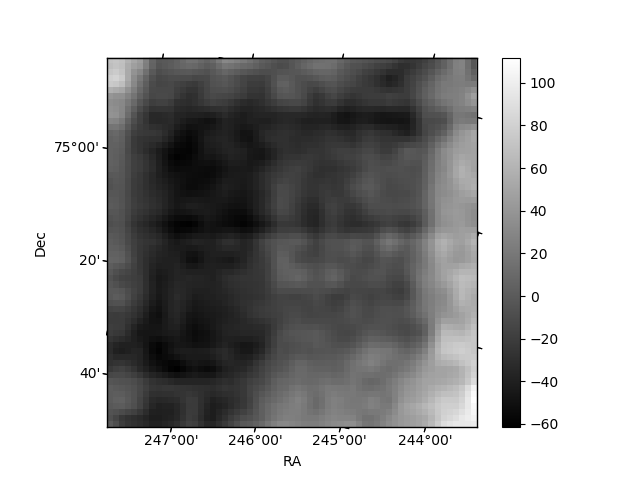
Histogram calculated using DETX and DETY for each event in the final _common_clean file
| Quadrant A | 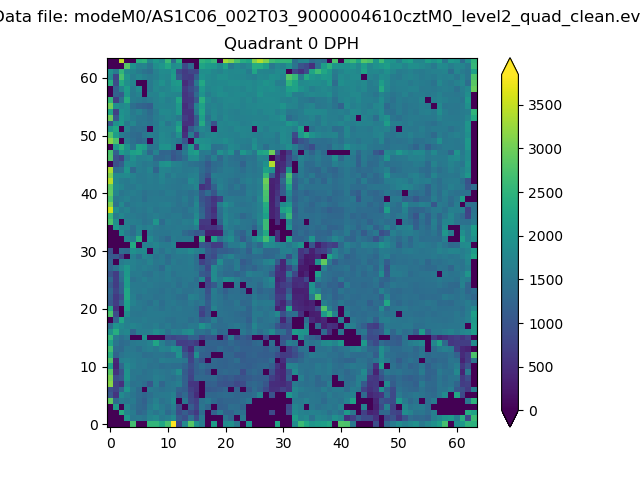 |
 |
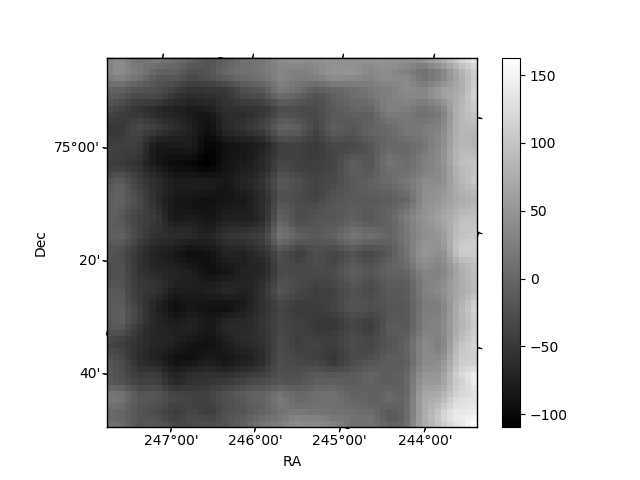
Quadrant B |
|---|---|---|---|
| Quadrant D | 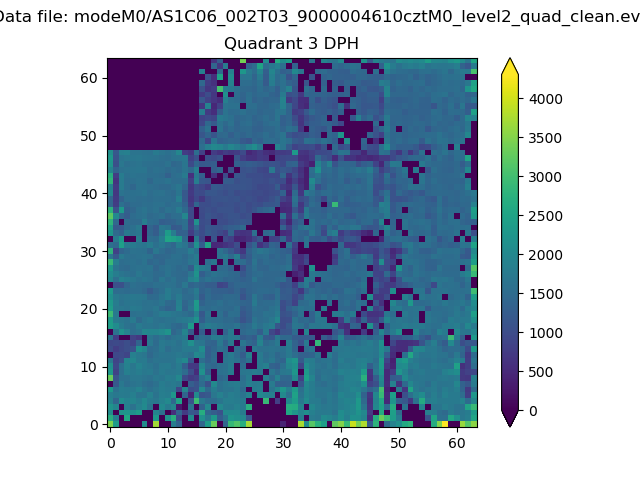 |
 |
Quadrant C |
| Plot type | Count rate plots | Images |
|---|---|---|
| Comparison with Poisson distribution Blue bars denote a histogram of data divided into 1 sec bins. Red curve is a Poisson curve with rate = median count rate of data. |
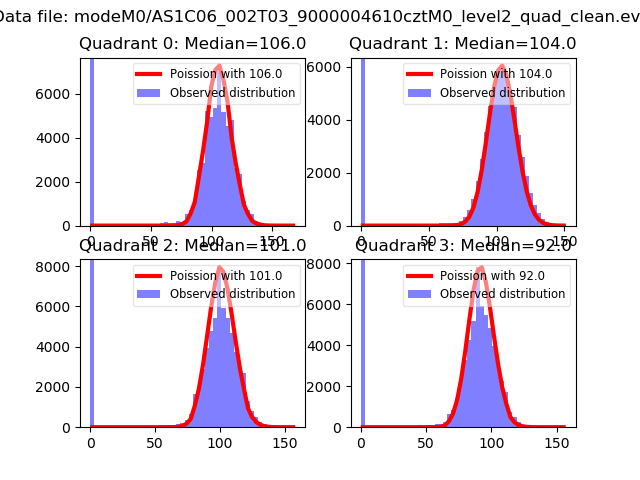 |
 |
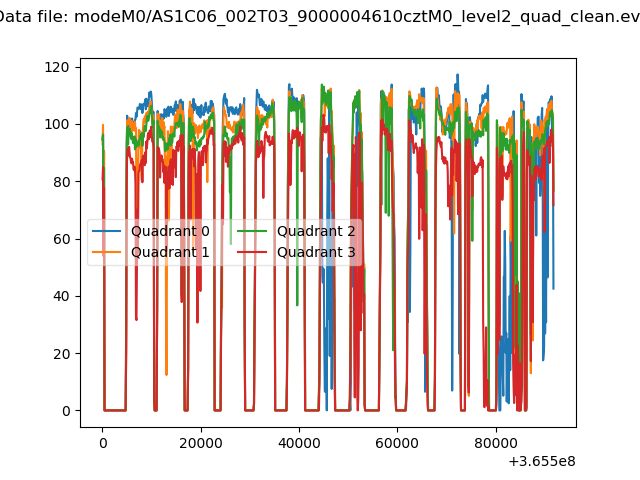
| Quadrant-wise count rates Data is divided into 100 sec bins |
 |
|
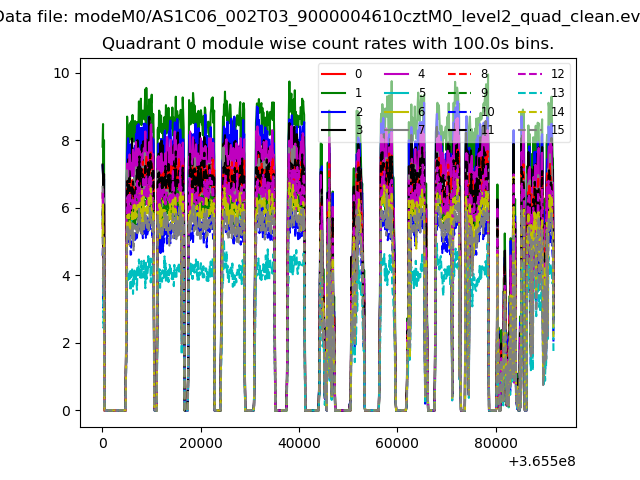
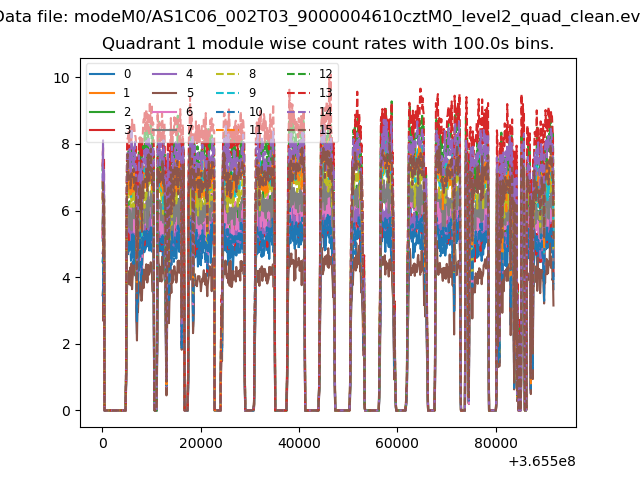
| Module-wise count rates for Quadrant A Data is divided into 100 sec bins |
 |
 |
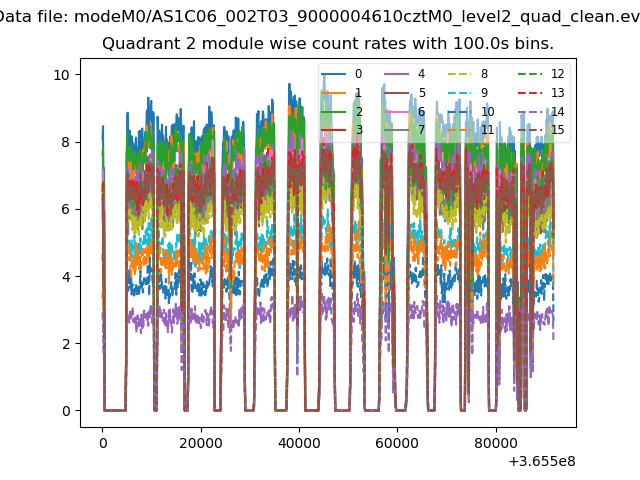
| Module-wise count rates for Quadrant B Data is divided into 100 sec bins |
 |
 |
| Module-wise count rates for Quadrant C Data is divided into 100 sec bins |
 |
 |
| Module-wise count rates for Quadrant D Data is divided into 100 sec bins |
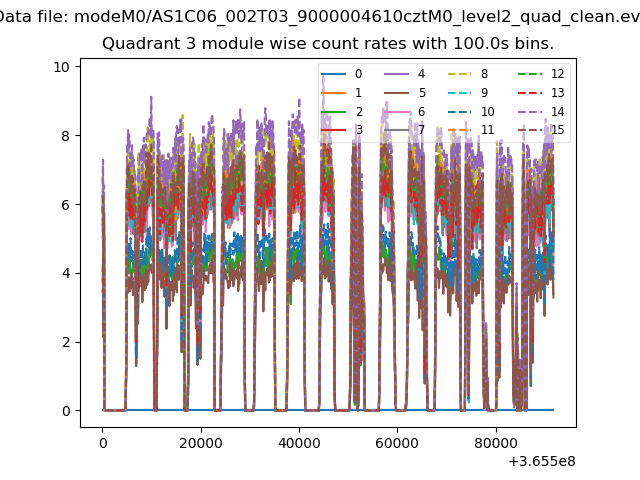 |
 |
| Parameter | Plot |
|---|---|
| CZT HV Monitor | 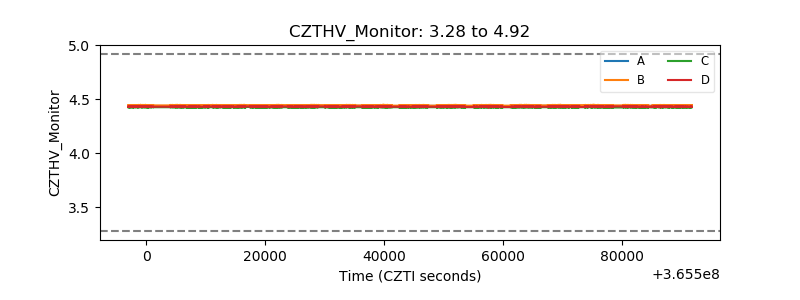 |
| D_VDD | 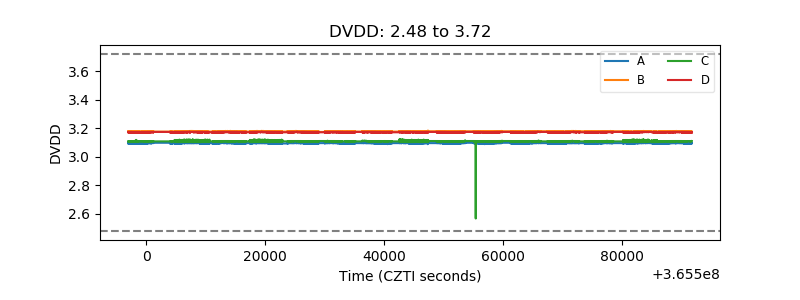 |
| Temperature 1 | 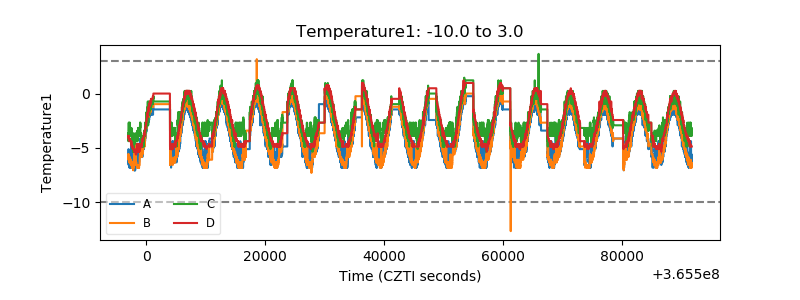 |
| Veto HV Monitor | 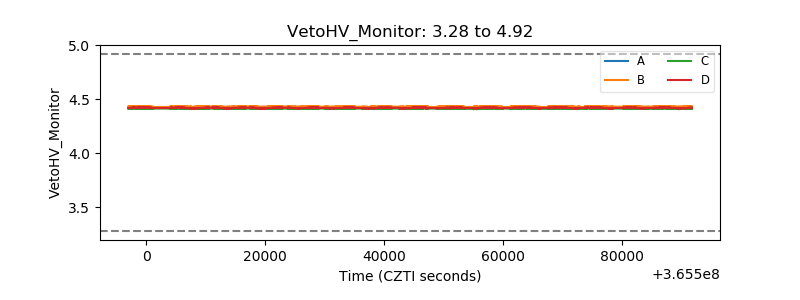 |
| Veto LLD | 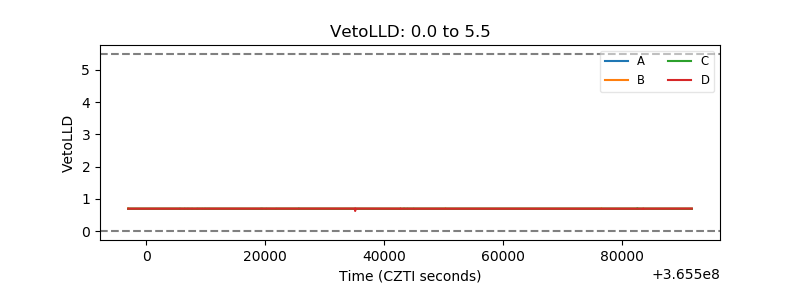 |
| Alpha Counter | 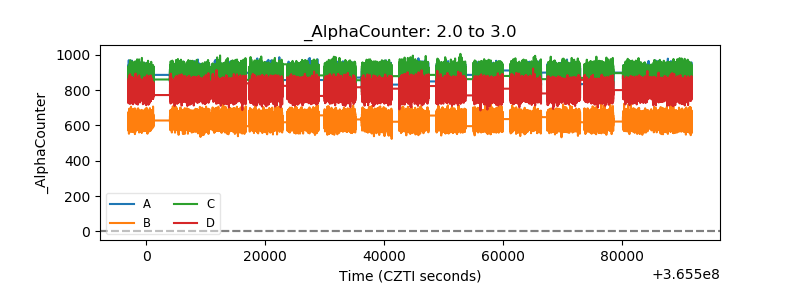 |
| _CPM_Rate | 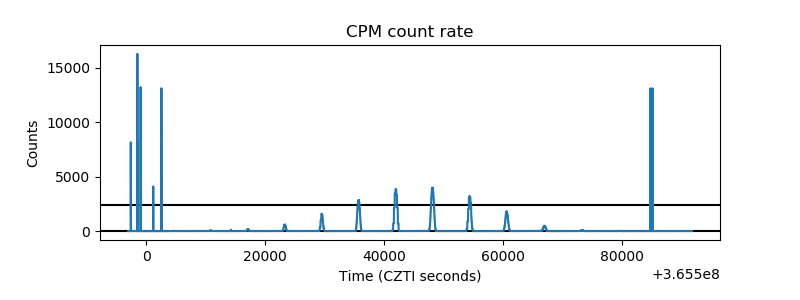 |
| CZT Counter | 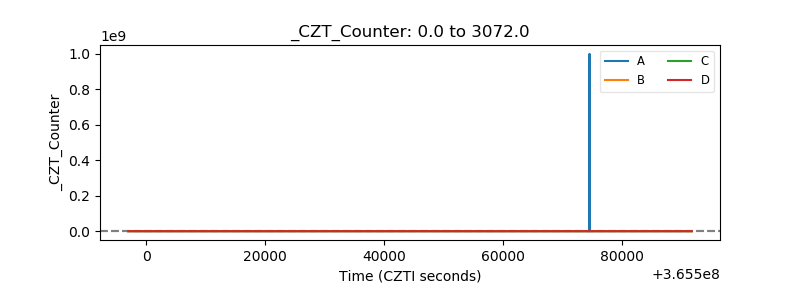 |
| +2.5 Volts monitor | 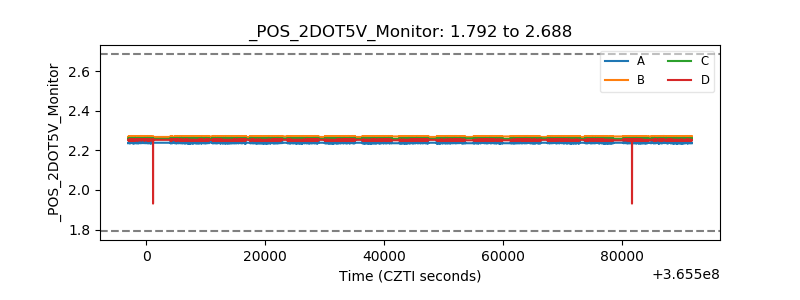 |
| +5 Volts monitor | 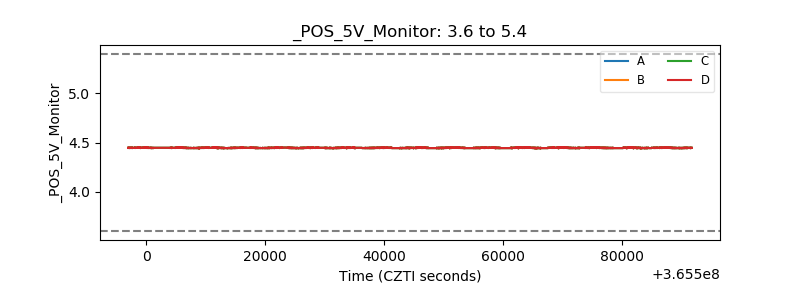 |
| _ROLL_ROT | 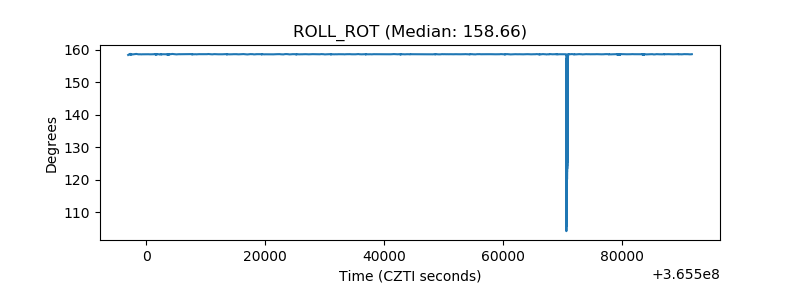 |
| _Roll_DEC | 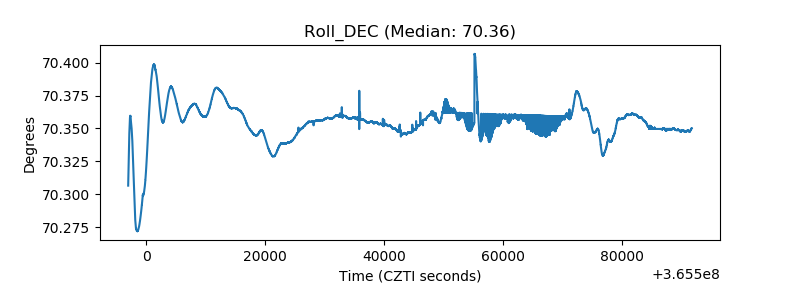 |
| _Roll_RA | 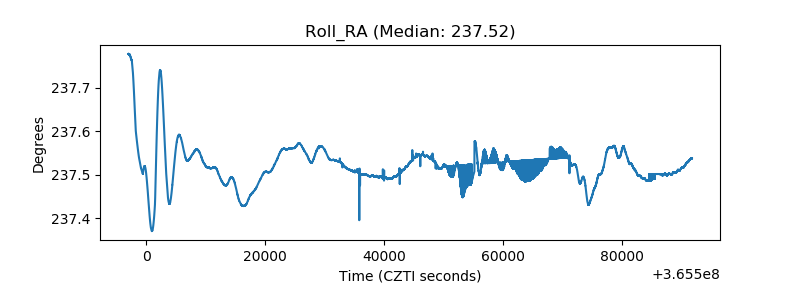 |
| Veto Counter | 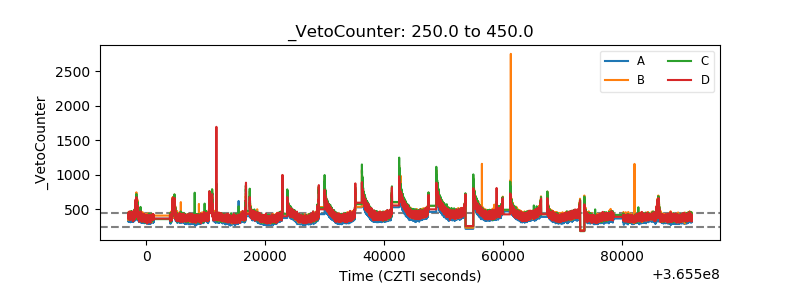 |