| Param | Original file | Final file |
|---|---|---|
| Filename | modeM0/AS1C06_002T03_9000004610_31589cztM0_level2.evt | modeM0/AS1C06_002T03_9000004610_31589cztM0_level2_quad_clean.evt |
| Size (bytes) | 15,906,240 | 3,971,520 |
| Size | 15.2 MB | 3.8 MB |
| Events in quadrant A | 96,531 | 26,832 |
| Events in quadrant B | 137,909 | 22,353 |
| Events in quadrant C | 112,681 | 28,202 |
| Events in quadrant D | 117,310 | 20,089 |
| Mode M0 | |||
|---|---|---|---|
| Quadrant | BADHDUFLAG | Total packets | Discarded packets |
| A | 0 | 2077 | 1636 |
| B | 0 | 3184 | 2634 |
| C | 0 | 2208 | 1732 |
| D | 0 | 2934 | 2458 |
| Mode SS | |||
|---|---|---|---|
| Quadrant | BADHDUFLAG | Total packets | Discarded packets |
| A | 0 | 21 | 17 |
| B | 0 | 15 | 11 |
| C | 0 | 26 | 20 |
| D | 0 | 18 | 18 |
| Mode M9 | |||
|---|---|---|---|
| Quadrant | BADHDUFLAG | Total packets | Discarded packets |
| A | 0 | 1 | 1 |
| B | 0 | 6 | 6 |
| C | 0 | 3 | 3 |
| D | 0 | 1 | 1 |
| Quadrant | Total seconds | Saturated seconds | Saturation percentage |
|---|---|---|---|
| A | 219 | 0 | 0.000000% |
| B | 183 | 1 | 0.546448% |
| C | 232 | 2 | 0.862069% |
| D | 171 | 0 | 0.000000% |
Noise dominated data is calculated using 1-second bins in cleaned event files. If a bin has >2000 counts, and if more than 50% of those come from <1% of pixels, then it is considered to be noise-dominated and hence unusable.
| Quadrant | # 1 sec bins | Bins with >0 counts | Bins with >2000 counts | High rate bins dominated by noise | Noise dominated (total time) | Noise dominated (detector-on time) | Marked lightcurve |
|---|---|---|---|---|---|---|---|
| A | 1896 | 290 | 0 | 0 | 0.00% | 0.00% | 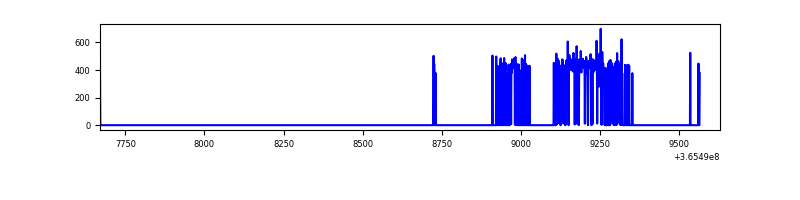 |
| B | 615 | 246 | 0 | 0 | 0.00% | 0.00% | 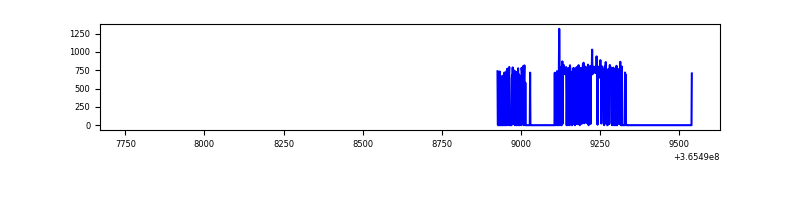 |
| C | 1949 | 299 | 0 | 0 | 0.00% | 0.00% | 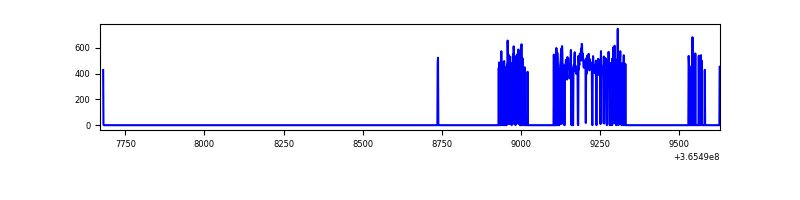 |
| D | 653 | 233 | 0 | 0 | 0.00% | 0.00% | 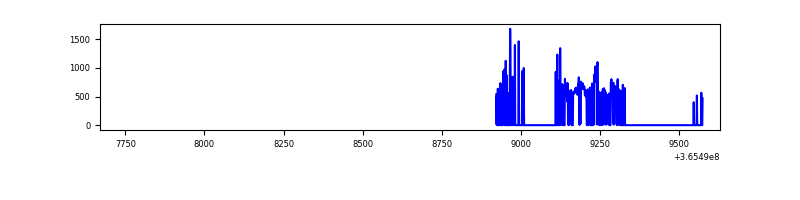 |
Top three noisy pixels from each quadrant. If the there are fewer than three noisy pixels in the level2.evt file, extra rows are filled as -1
| Pixel properties | Quadrant properties | ||||||
|---|---|---|---|---|---|---|---|
| Quadrant | DetID | PixID | Counts | Sigma | Mean | Median | Sigma |
| A | 13 | 254 | 353 | 46.41 | 24 | 24 | 7.1 |
| A | 3 | 137 | 255 | 32.58 | 24 | 24 | 7.1 |
| A | 0 | 226 | 208 | 25.95 | 24 | 24 | 7.1 |
| B | 6 | 159 | 52785 | 8809.75 | 20 | 20 | 6.0 |
| B | 12 | 1 | 1547 | 254.95 | 20 | 20 | 6.0 |
| B | 4 | 80 | 1414 | 232.75 | 20 | 20 | 6.0 |
| C | 3 | 233 | 7780 | 987.17 | 25 | 24 | 7.9 |
| C | 14 | 238 | 4520 | 572.24 | 25 | 24 | 7.9 |
| C | 4 | 175 | 607 | 74.2 | 25 | 24 | 7.9 |
| D | 8 | 195 | 35049 | 5623.14 | 18 | 17 | 6.2 |
| D | 12 | 218 | 9285 | 1487.65 | 18 | 17 | 6.2 |
| D | 7 | 223 | 2389 | 380.74 | 18 | 17 | 6.2 |
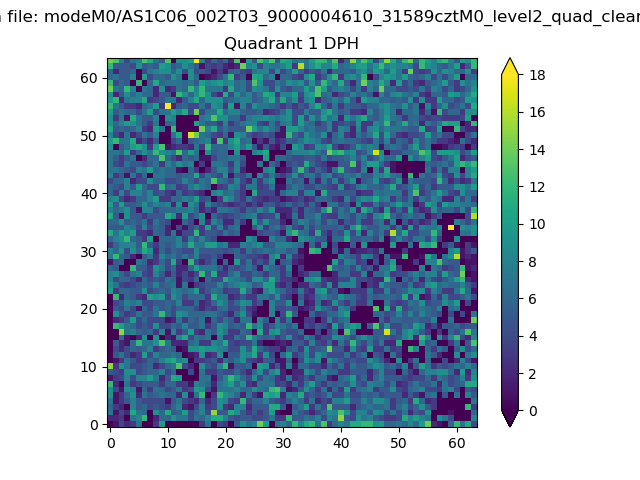
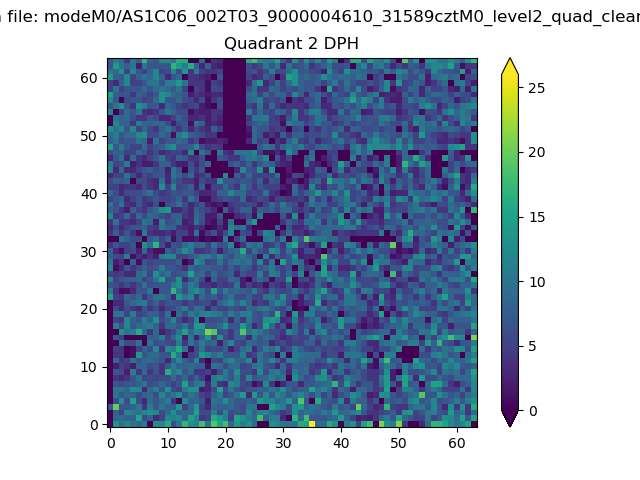
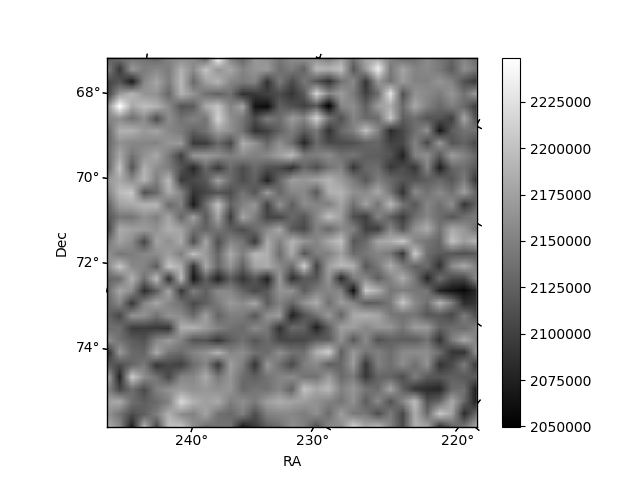
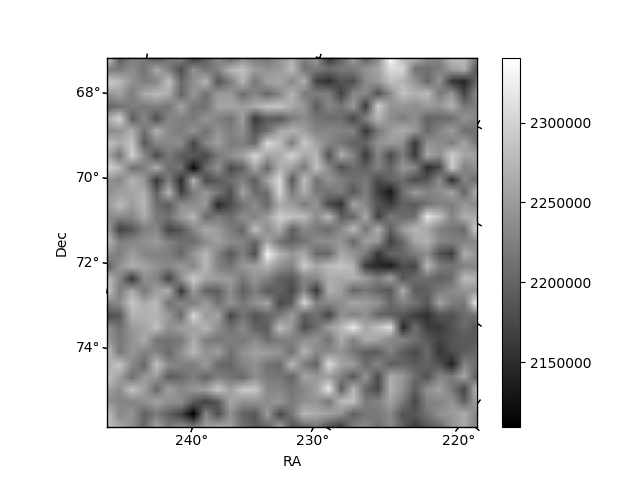
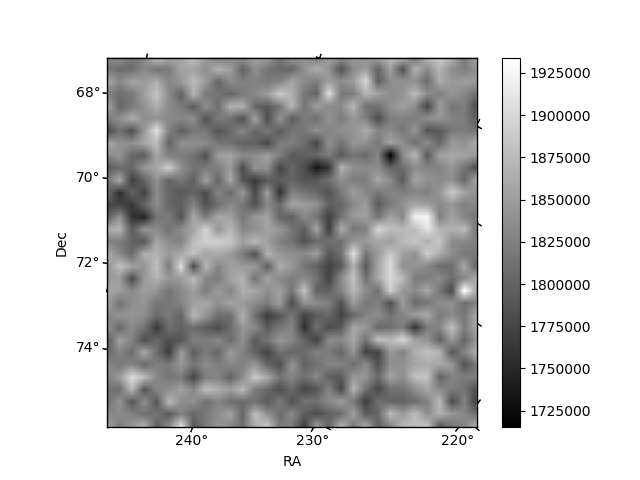
Histogram calculated using DETX and DETY for each event in the final _common_clean file
| Quadrant A |  |
 |
Quadrant B |
|---|---|---|---|
| Quadrant D |  |
 |
Quadrant C |
| Plot type | Count rate plots | Images |
|---|---|---|
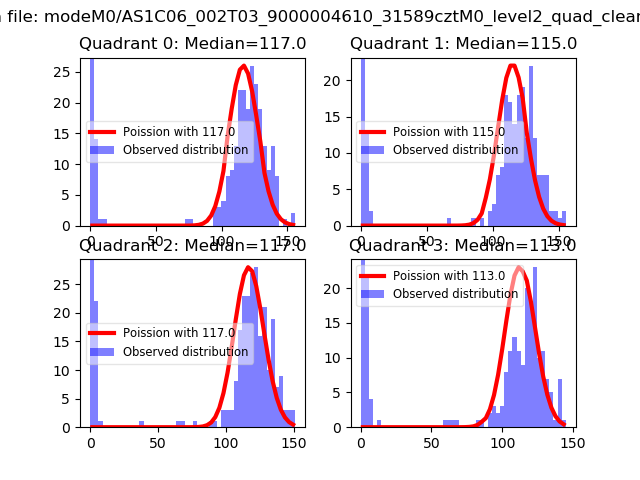
| Comparison with Poisson distribution Blue bars denote a histogram of data divided into 1 sec bins. Red curve is a Poisson curve with rate = median count rate of data. |
 |
 |
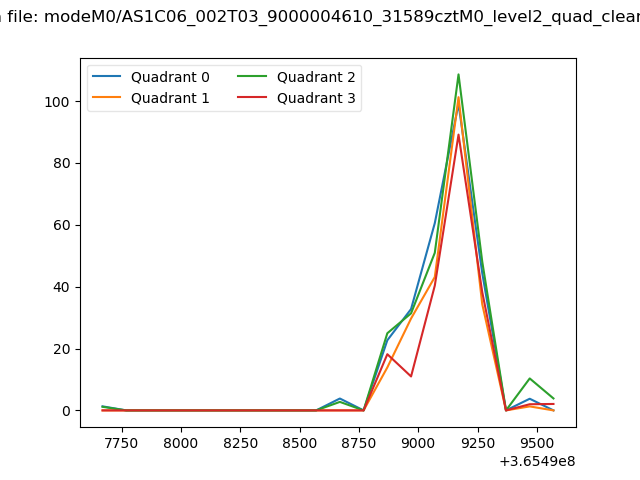
| Quadrant-wise count rates Data is divided into 100 sec bins |
 |
|
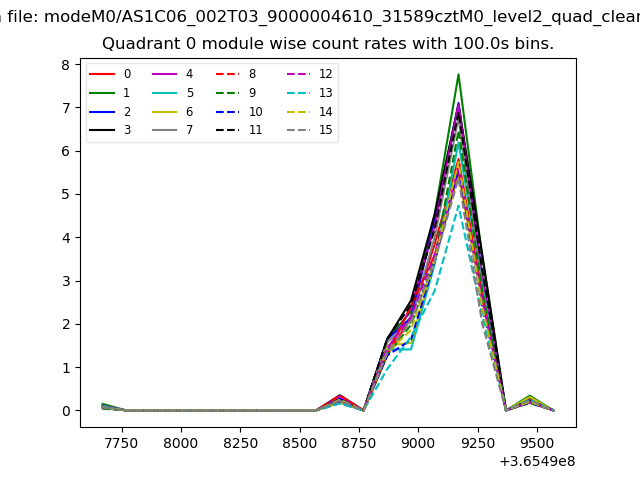
| Module-wise count rates for Quadrant A Data is divided into 100 sec bins |
 |
 |
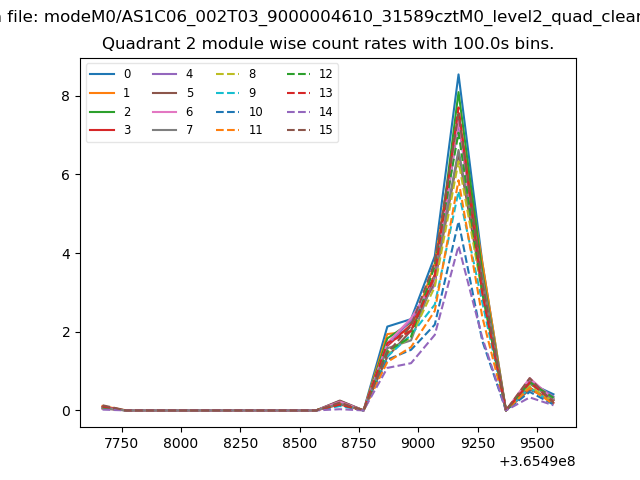
| Module-wise count rates for Quadrant B Data is divided into 100 sec bins |
 |
 |
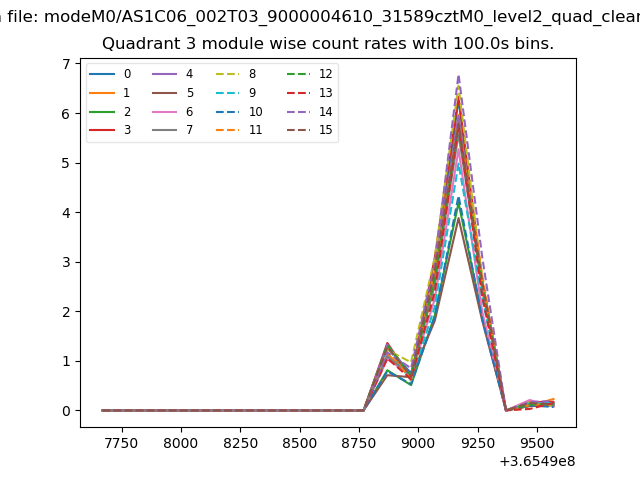
| Module-wise count rates for Quadrant C Data is divided into 100 sec bins |
 |
 |
| Module-wise count rates for Quadrant D Data is divided into 100 sec bins |
 |
 |
| Parameter | Plot |
|---|---|
| CZT HV Monitor | 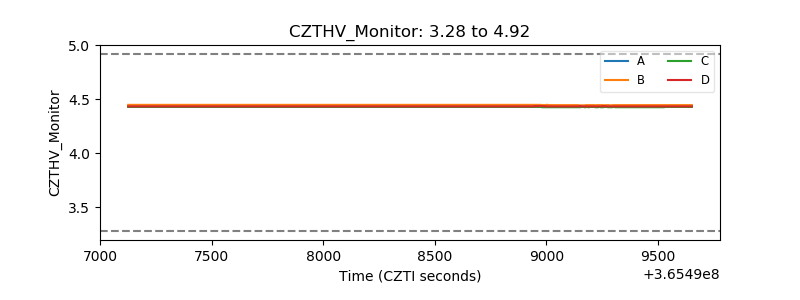 |
| D_VDD | 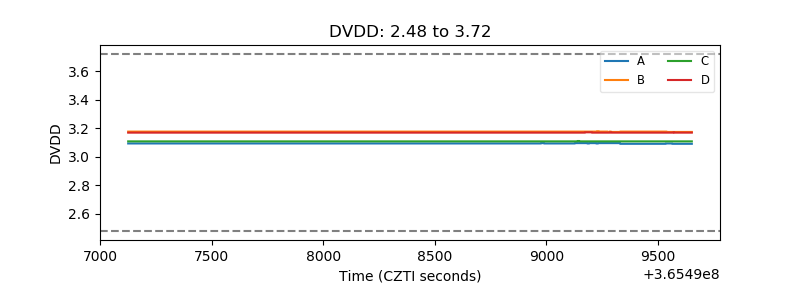 |
| Temperature 1 | 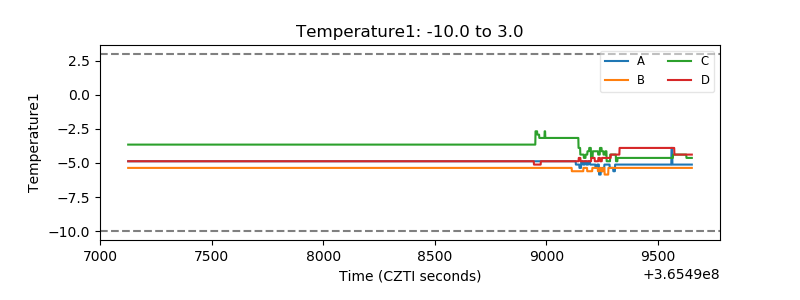 |
| Veto HV Monitor | 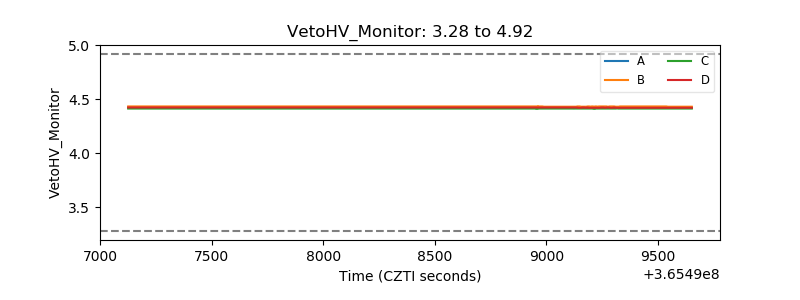 |
| Veto LLD | 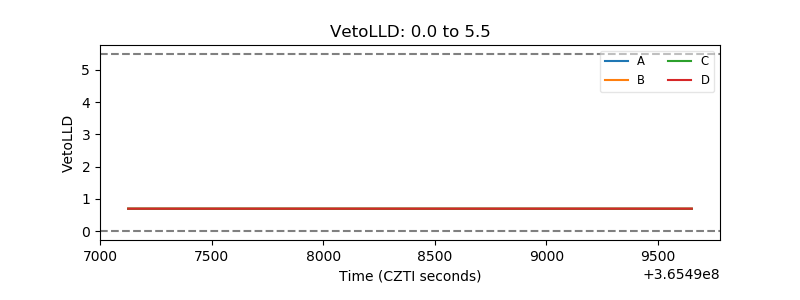 |
| Alpha Counter | 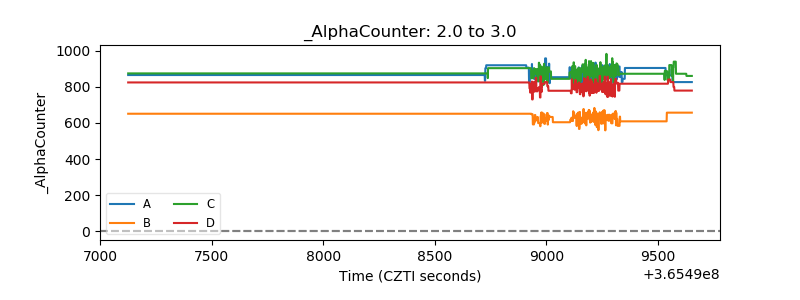 |
| _CPM_Rate | 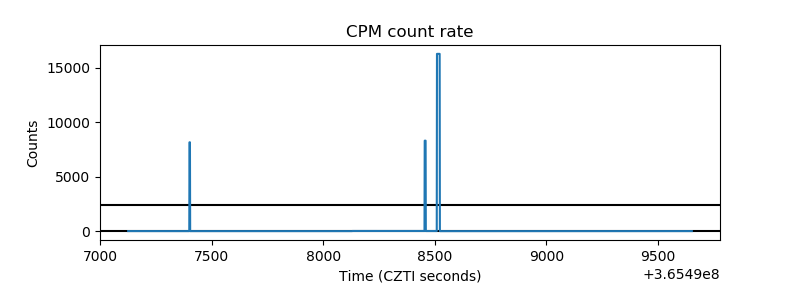 |
| CZT Counter | 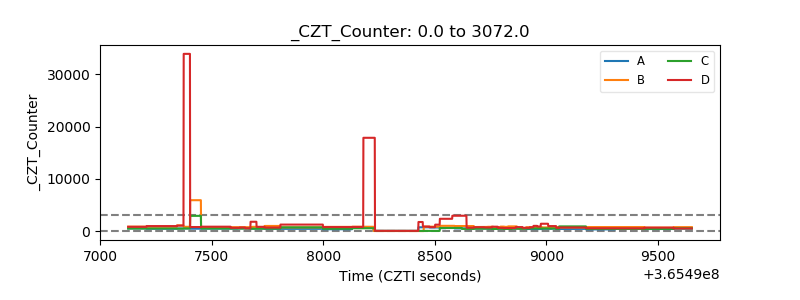 |
| +2.5 Volts monitor |  |
| +5 Volts monitor |  |
| _ROLL_ROT | 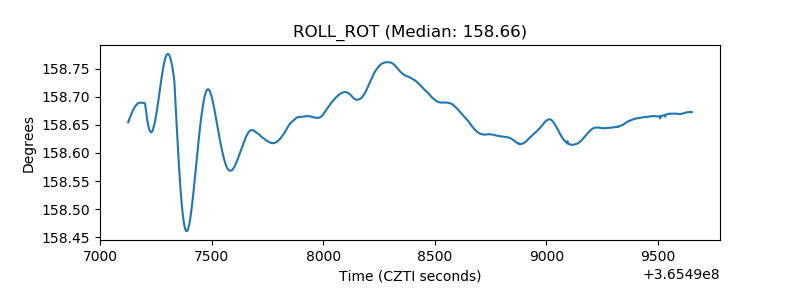 |
| _Roll_DEC | 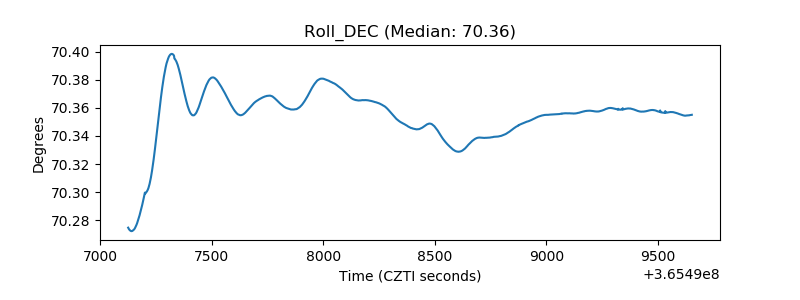 |
| _Roll_RA | 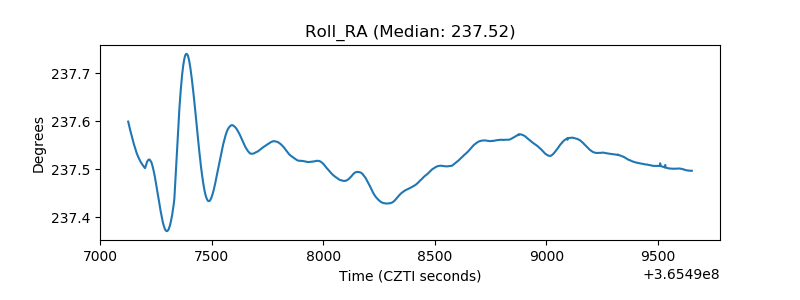 |
| Veto Counter | 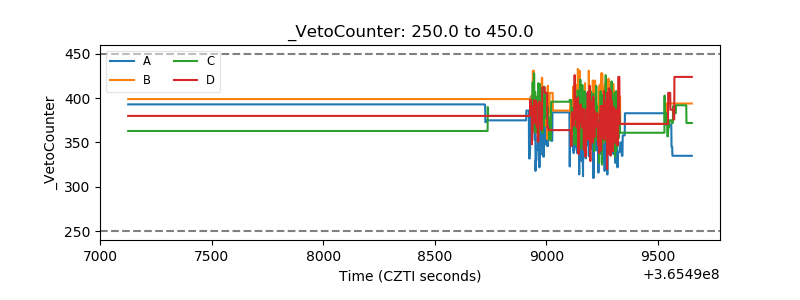 |