| Param | Original file | Final file |
|---|---|---|
| Filename | modeM0/AS1C06_002T03_9000004610_31590cztM0_level2.evt | modeM0/AS1C06_002T03_9000004610_31590cztM0_level2_quad_clean.evt |
| Size (bytes) | 477,204,480 | 101,831,040 |
| Size | 455.1 MB | 97.1 MB |
| Events in quadrant A | 2,620,549 | 698,927 |
| Events in quadrant B | 4,358,639 | 681,546 |
| Events in quadrant C | 3,077,002 | 672,634 |
| Events in quadrant D | 4,025,498 | 648,573 |
| Mode M0 | |||
|---|---|---|---|
| Quadrant | BADHDUFLAG | Total packets | Discarded packets |
| A | 0 | 13406 | 1919 |
| B | 0 | 20236 | 3359 |
| C | 0 | 14881 | 2207 |
| D | 0 | 19357 | 3403 |
| Mode SS | |||
|---|---|---|---|
| Quadrant | BADHDUFLAG | Total packets | Discarded packets |
| A | 0 | 135 | 19 |
| B | 0 | 136 | 14 |
| C | 0 | 134 | 20 |
| D | 0 | 135 | 19 |
| Mode M9 | |||
|---|---|---|---|
| Quadrant | BADHDUFLAG | Total packets | Discarded packets |
| A | 0 | 4 | 0 |
| B | 0 | 5 | 1 |
| C | 0 | 5 | 1 |
| D | 0 | 6 | 2 |
| Quadrant | Total seconds | Saturated seconds | Saturation percentage |
|---|---|---|---|
| A | 5505 | 227 | 4.123524% |
| B | 5385 | 421 | 7.818013% |
| C | 5458 | 350 | 6.412605% |
| D | 5402 | 229 | 4.239171% |
Noise dominated data is calculated using 1-second bins in cleaned event files. If a bin has >2000 counts, and if more than 50% of those come from <1% of pixels, then it is considered to be noise-dominated and hence unusable.
| Quadrant | # 1 sec bins | Bins with >0 counts | Bins with >2000 counts | High rate bins dominated by noise | Noise dominated (total time) | Noise dominated (detector-on time) | Marked lightcurve |
|---|---|---|---|---|---|---|---|
| A | 9417 | 5651 | 0 | 0 | 0.00% | 0.00% | 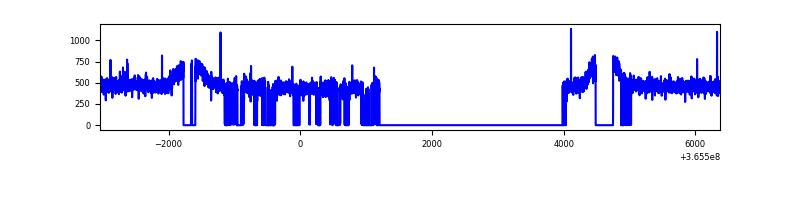 |
| B | 9417 | 5559 | 5 | 5 | 0.05% | 0.09% | 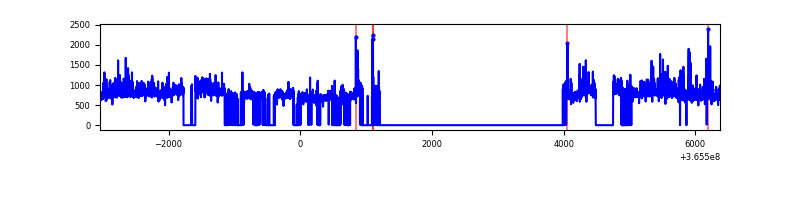 |
| C | 9417 | 5614 | 10 | 10 | 0.11% | 0.18% | 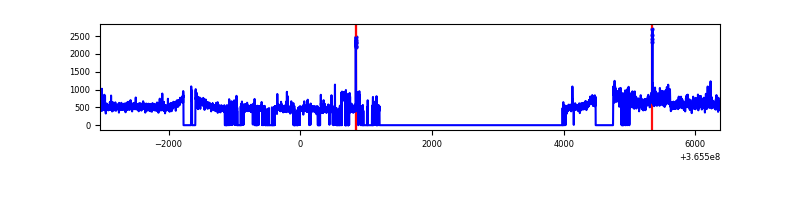 |
| D | 9417 | 5574 | 30 | 30 | 0.32% | 0.54% |  |
Top three noisy pixels from each quadrant. If the there are fewer than three noisy pixels in the level2.evt file, extra rows are filled as -1
| Pixel properties | Quadrant properties | ||||||
|---|---|---|---|---|---|---|---|
| Quadrant | DetID | PixID | Counts | Sigma | Mean | Median | Sigma |
| A | 13 | 254 | 9577 | 65.0 | 678 | 661 | 137.2 |
| A | 3 | 137 | 7217 | 47.79 | 678 | 661 | 137.2 |
| A | 0 | 226 | 5734 | 36.98 | 678 | 661 | 137.2 |
| B | 6 | 159 | 1437901 | 11396.43 | 652 | 635 | 126.1 |
| B | 4 | 80 | 266424 | 2107.51 | 652 | 635 | 126.1 |
| B | 12 | 1 | 39938 | 311.64 | 652 | 635 | 126.1 |
| C | 3 | 233 | 344842 | 2302.04 | 634 | 634 | 149.5 |
| C | 14 | 238 | 141185 | 939.99 | 634 | 634 | 149.5 |
| C | 14 | 254 | 55684 | 368.17 | 634 | 634 | 149.5 |
| D | 8 | 195 | 1303066 | 8521.74 | 634 | 614 | 152.8 |
| D | 12 | 218 | 174596 | 1138.34 | 634 | 614 | 152.8 |
| D | 10 | 203 | 51620 | 333.72 | 634 | 614 | 152.8 |
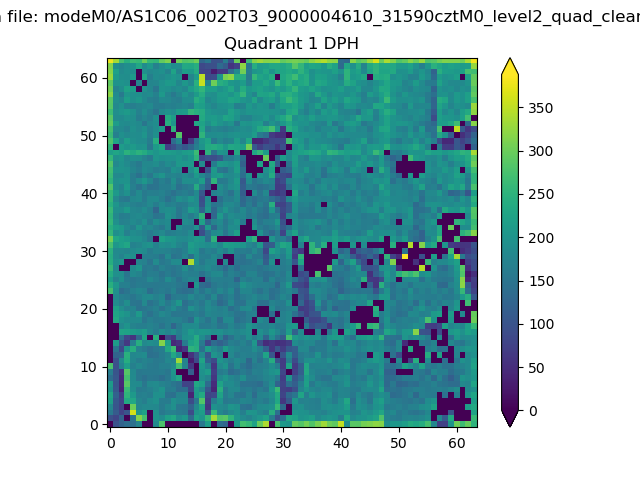
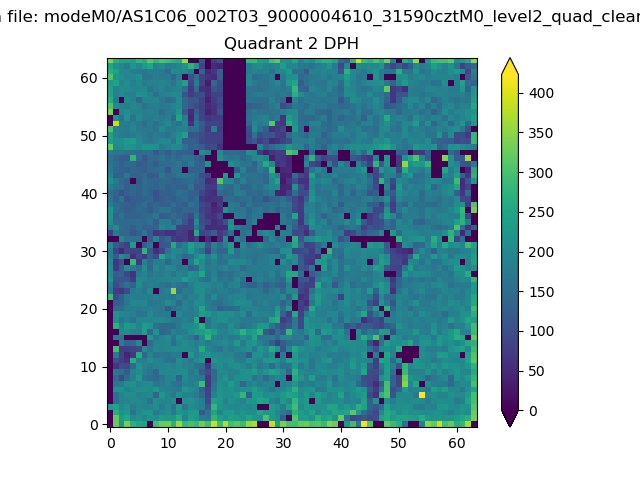
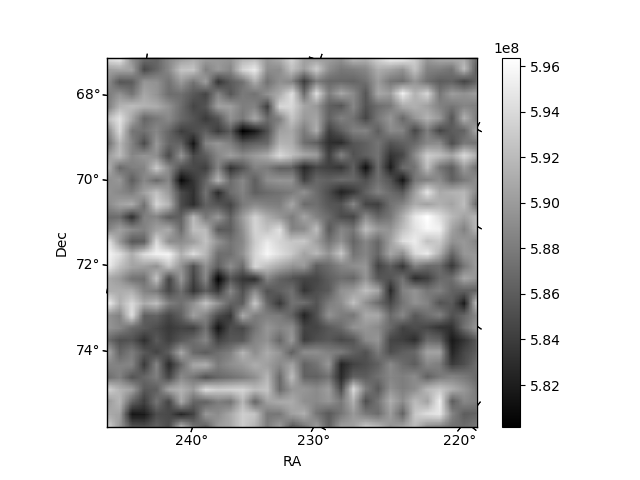
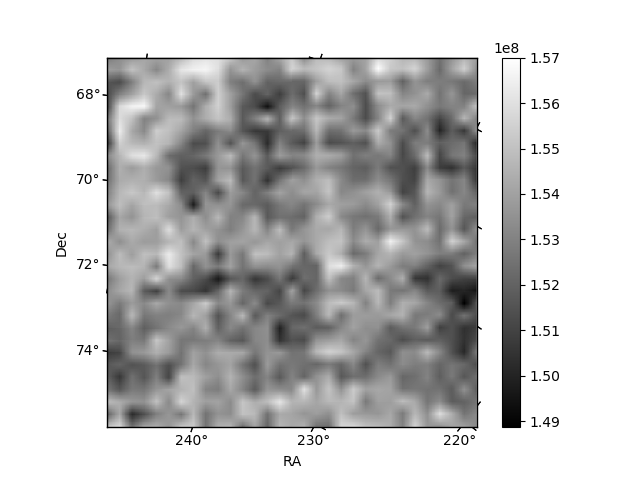
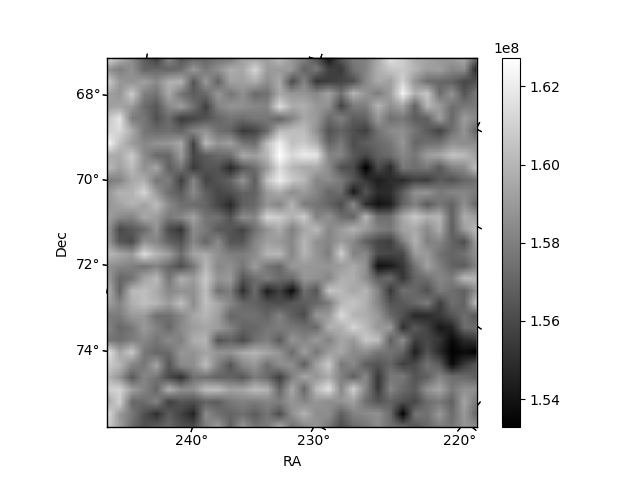
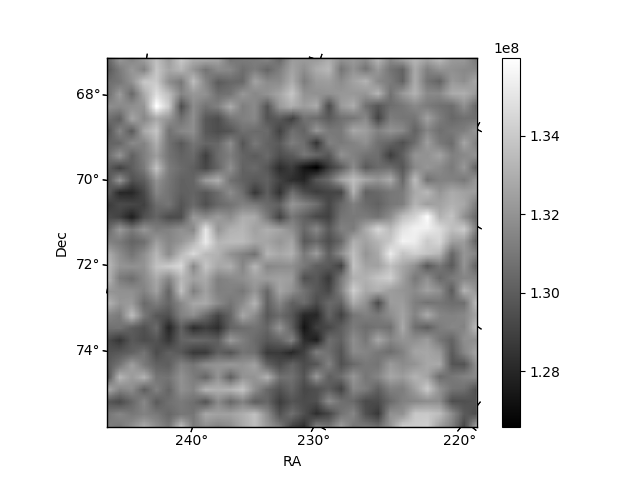
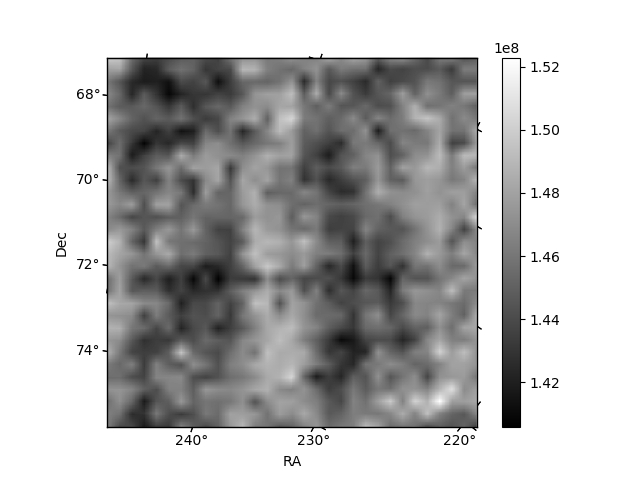
Histogram calculated using DETX and DETY for each event in the final _common_clean file
| Quadrant A | 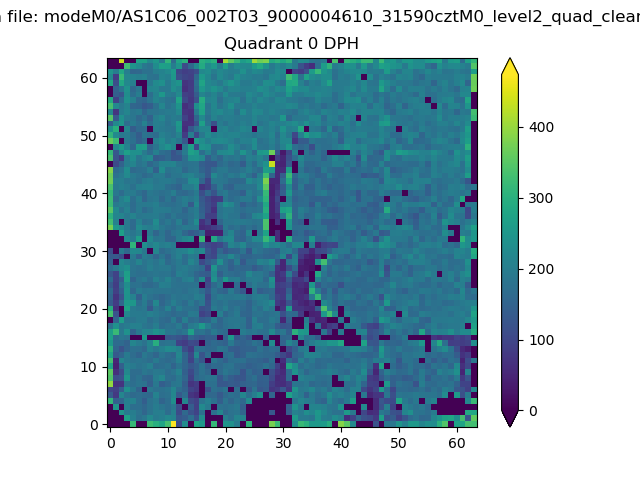 |
 |
Quadrant B |
|---|---|---|---|
| Quadrant D | 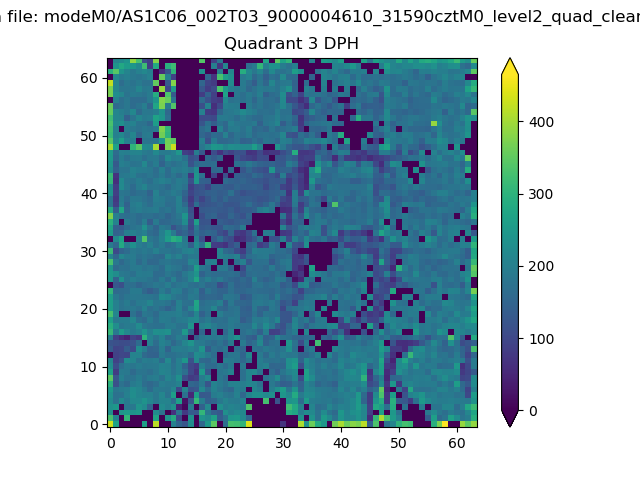 |
 |
Quadrant C |
| Plot type | Count rate plots | Images |
|---|---|---|
| Comparison with Poisson distribution Blue bars denote a histogram of data divided into 1 sec bins. Red curve is a Poisson curve with rate = median count rate of data. |
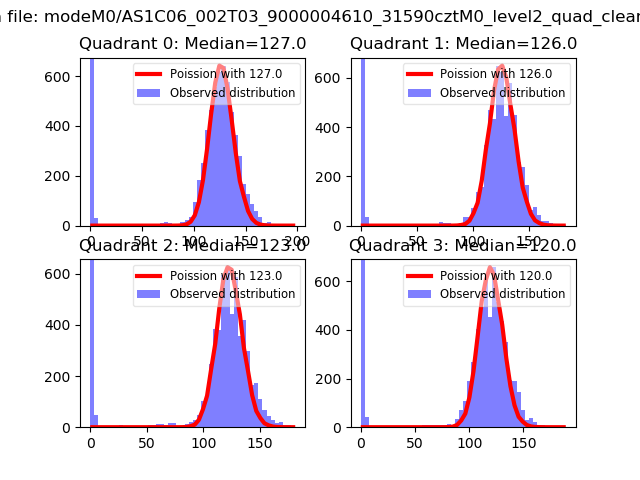 |
 |
| Quadrant-wise count rates Data is divided into 100 sec bins |
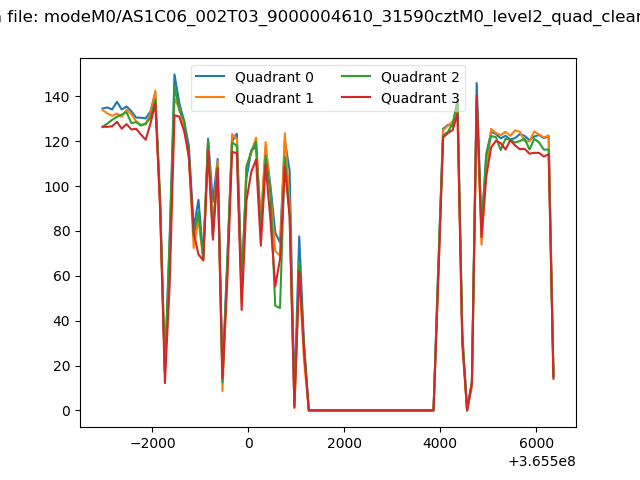 |
|
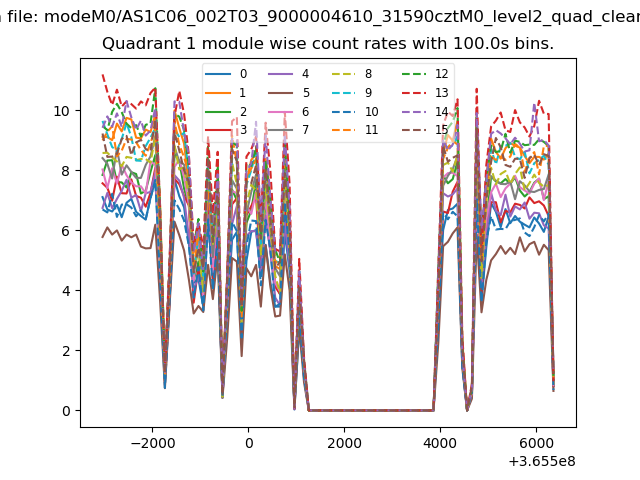
| Module-wise count rates for Quadrant A Data is divided into 100 sec bins |
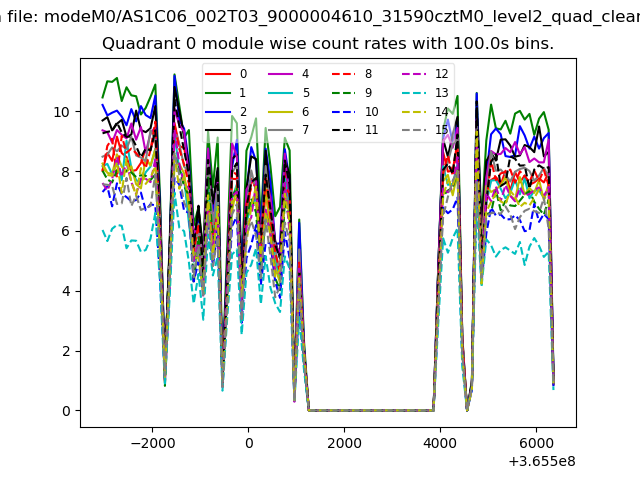 |
 |
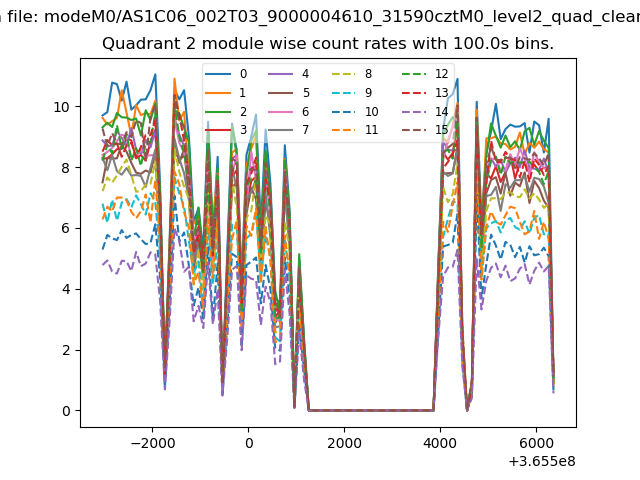
| Module-wise count rates for Quadrant B Data is divided into 100 sec bins |
 |
 |
| Module-wise count rates for Quadrant C Data is divided into 100 sec bins |
 |
 |
| Module-wise count rates for Quadrant D Data is divided into 100 sec bins |
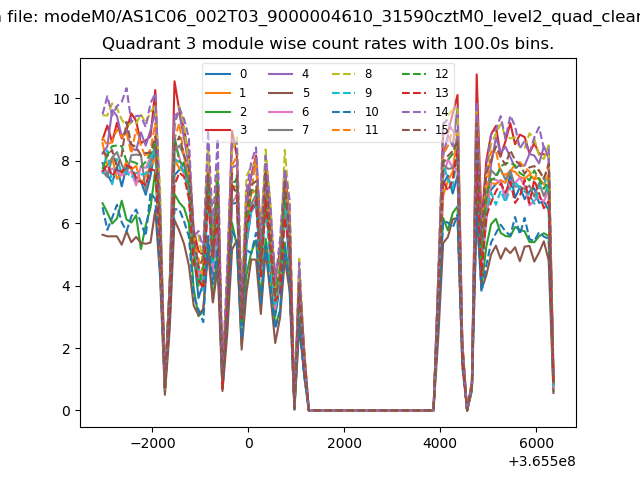 |
 |
| Parameter | Plot |
|---|---|
| CZT HV Monitor | 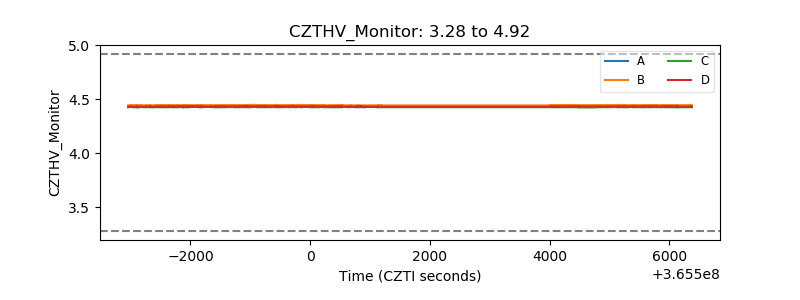 |
| D_VDD | 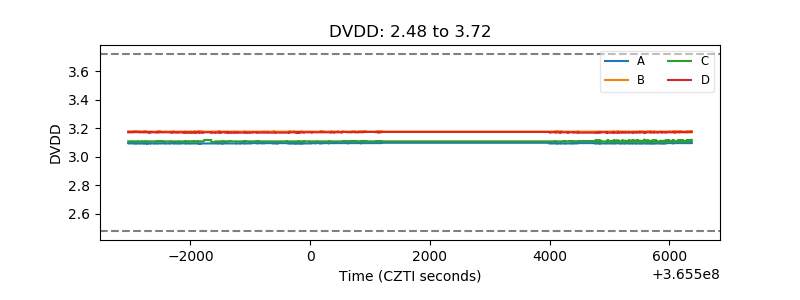 |
| Temperature 1 | 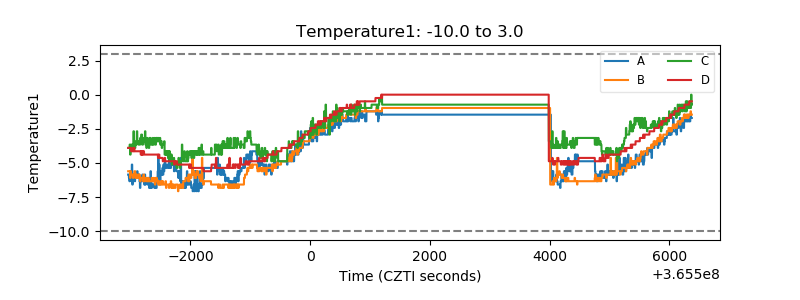 |
| Veto HV Monitor | 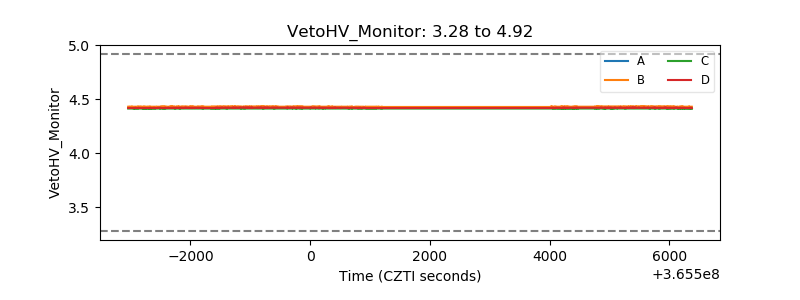 |
| Veto LLD |  |
| Alpha Counter | 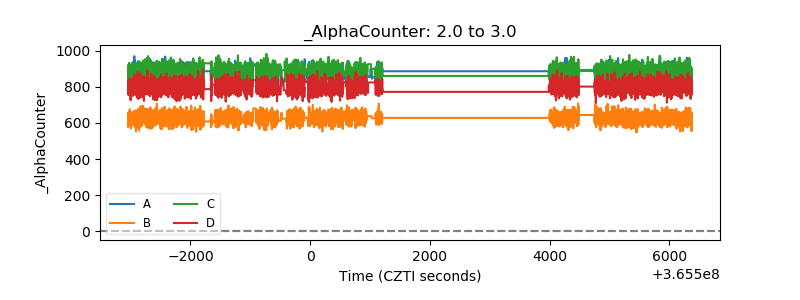 |
| _CPM_Rate | 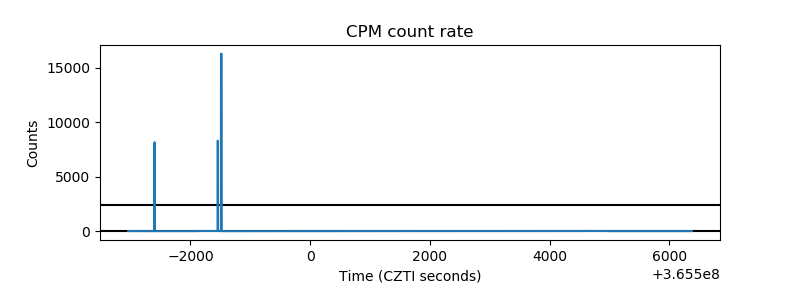 |
| CZT Counter | 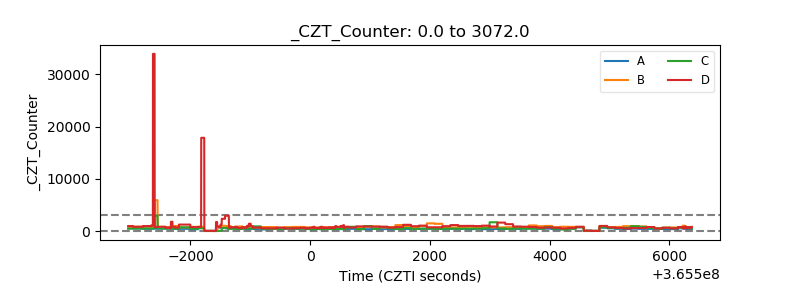 |
| +2.5 Volts monitor |  |
| +5 Volts monitor |  |
| _ROLL_ROT | 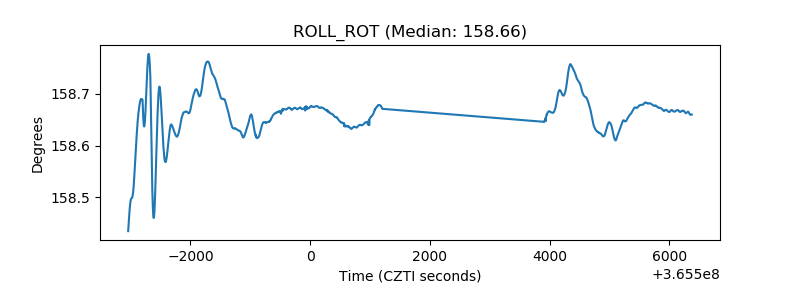 |
| _Roll_DEC | 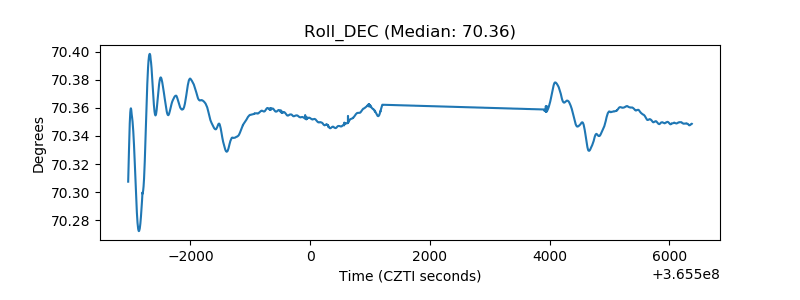 |
| _Roll_RA | 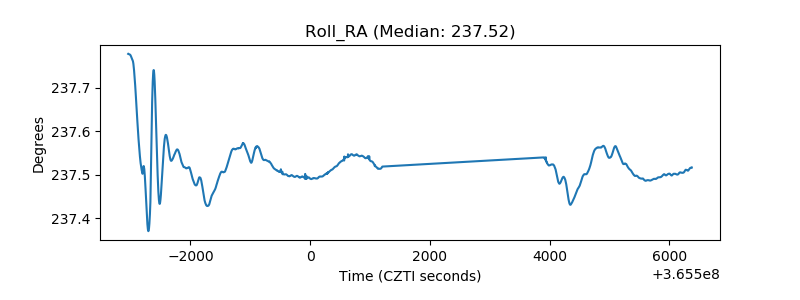 |
| Veto Counter | 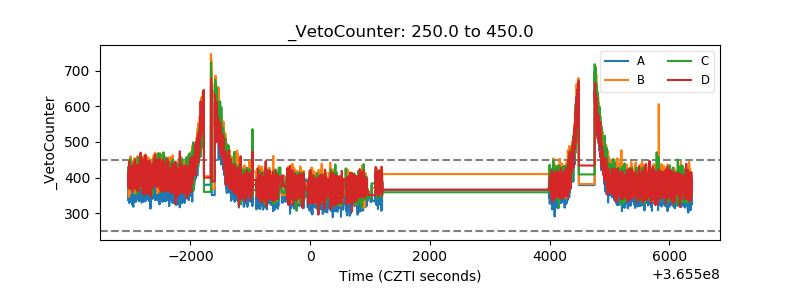 |