| Param | Original file | Final file |
|---|---|---|
| Filename | modeM0/AS1C06_002T03_9000004610_31593cztM0_level2.evt | modeM0/AS1C06_002T03_9000004610_31593cztM0_level2_quad_clean.evt |
| Size (bytes) | 2,451,214,080 | 479,070,720 |
| Size | 2.3 GB | 456.9 MB |
| Events in quadrant A | 11,954,426 | 3,318,961 |
| Events in quadrant B | 23,603,688 | 3,200,845 |
| Events in quadrant C | 13,744,589 | 3,163,173 |
| Events in quadrant D | 23,190,531 | 3,044,470 |
| Mode M0 | |||
|---|---|---|---|
| Quadrant | BADHDUFLAG | Total packets | Discarded packets |
| A | 0 | 52980 | 6 |
| B | 0 | 88992 | 6 |
| C | 0 | 57035 | 6 |
| D | 0 | 87197 | 6 |
| Mode SS | |||
|---|---|---|---|
| Quadrant | BADHDUFLAG | Total packets | Discarded packets |
| A | 0 | 528 | 0 |
| B | 0 | 528 | 0 |
| C | 0 | 528 | 0 |
| D | 0 | 528 | 0 |
| Mode M9 | |||
|---|---|---|---|
| Quadrant | BADHDUFLAG | Total packets | Discarded packets |
| A | 0 | 23 | 0 |
| B | 0 | 23 | 0 |
| C | 0 | 23 | 0 |
| D | 0 | 23 | 0 |
| Quadrant | Total seconds | Saturated seconds | Saturation percentage |
|---|---|---|---|
| A | 25927 | 429 | 1.654646% |
| B | 25927 | 1753 | 6.761291% |
| C | 25927 | 752 | 2.900451% |
| D | 25927 | 1405 | 5.419061% |
Noise dominated data is calculated using 1-second bins in cleaned event files. If a bin has >2000 counts, and if more than 50% of those come from <1% of pixels, then it is considered to be noise-dominated and hence unusable.
| Quadrant | # 1 sec bins | Bins with >0 counts | Bins with >2000 counts | High rate bins dominated by noise | Noise dominated (total time) | Noise dominated (detector-on time) | Marked lightcurve |
|---|---|---|---|---|---|---|---|
| A | 28227 | 25927 | 0 | 0 | 0.00% | 0.00% | 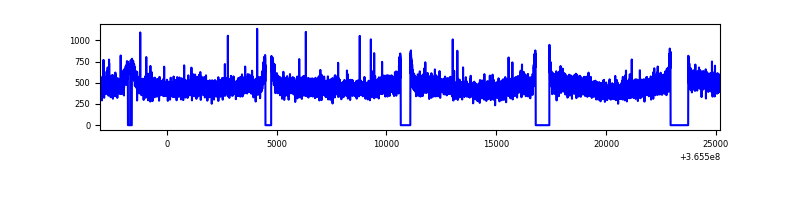 |
| B | 28227 | 25927 | 824 | 824 | 2.92% | 3.18% | 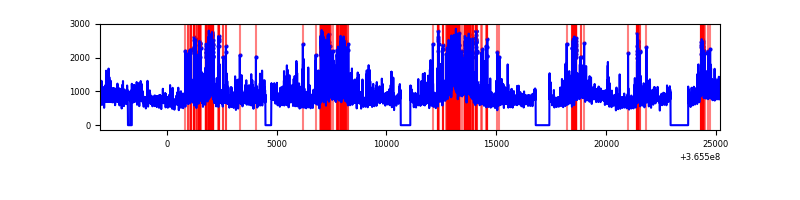 |
| C | 28227 | 25927 | 28 | 28 | 0.10% | 0.11% | 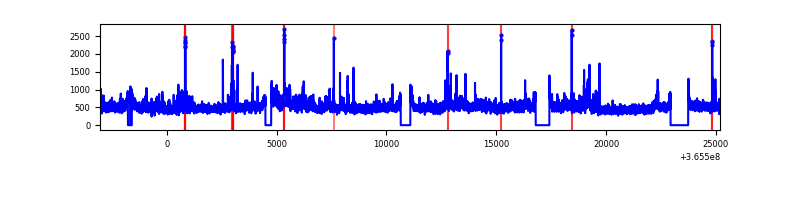 |
| D | 28227 | 25927 | 1019 | 1019 | 3.61% | 3.93% | 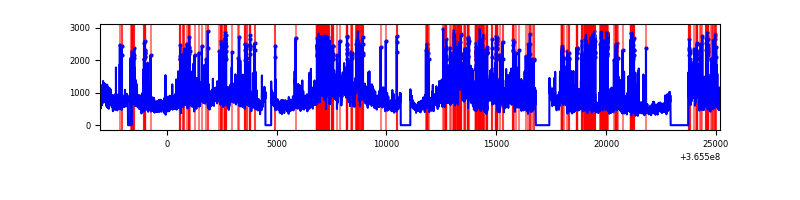 |
Top three noisy pixels from each quadrant. If the there are fewer than three noisy pixels in the level2.evt file, extra rows are filled as -1
| Pixel properties | Quadrant properties | ||||||
|---|---|---|---|---|---|---|---|
| Quadrant | DetID | PixID | Counts | Sigma | Mean | Median | Sigma |
| A | 13 | 254 | 49995 | 76.26 | 3095 | 3026 | 615.9 |
| A | 3 | 137 | 31309 | 45.92 | 3095 | 3026 | 615.9 |
| A | 0 | 226 | 26273 | 37.74 | 3095 | 3026 | 615.9 |
| B | 6 | 159 | 7214556 | 12870.79 | 3003 | 2933 | 560.3 |
| B | 5 | 172 | 1879303 | 3348.81 | 3003 | 2933 | 560.3 |
| B | 4 | 80 | 1569013 | 2795.03 | 3003 | 2933 | 560.3 |
| C | 3 | 233 | 1205828 | 1750.3 | 2953 | 2963 | 687.2 |
| C | 14 | 238 | 532081 | 769.93 | 2953 | 2963 | 687.2 |
| C | 4 | 175 | 127781 | 181.62 | 2953 | 2963 | 687.2 |
| D | 8 | 195 | 7463817 | 10533.86 | 2951 | 2865 | 708.3 |
| D | 12 | 218 | 2318098 | 3268.8 | 2951 | 2865 | 708.3 |
| D | 13 | 249 | 603922 | 848.61 | 2951 | 2865 | 708.3 |
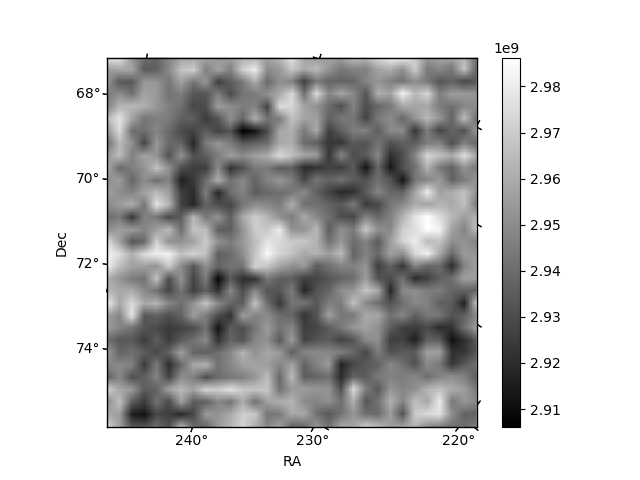
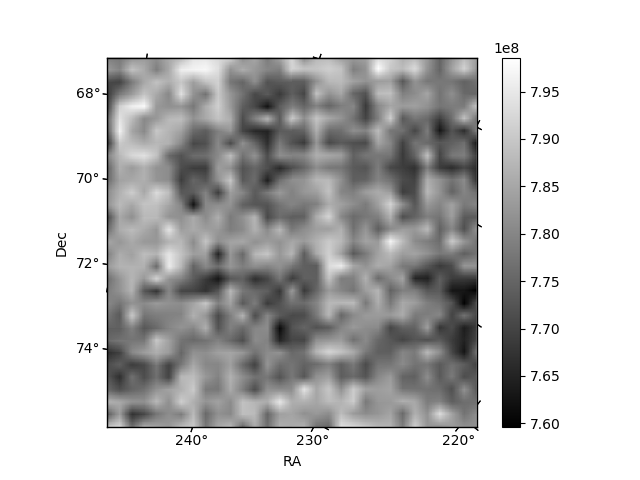
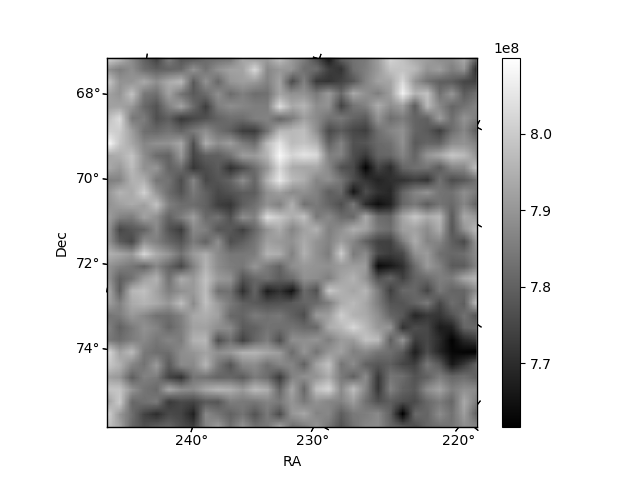
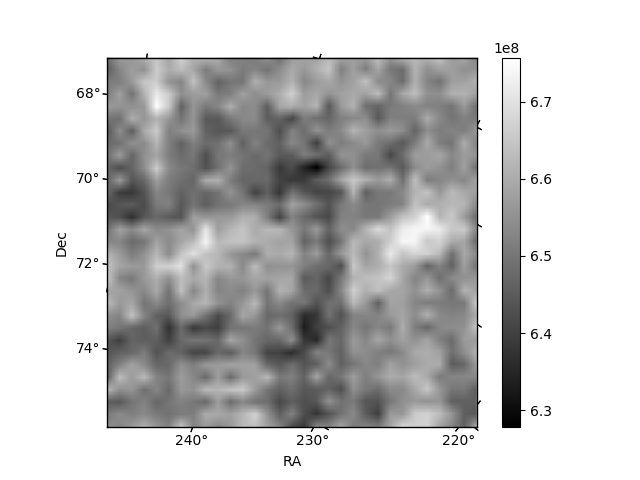
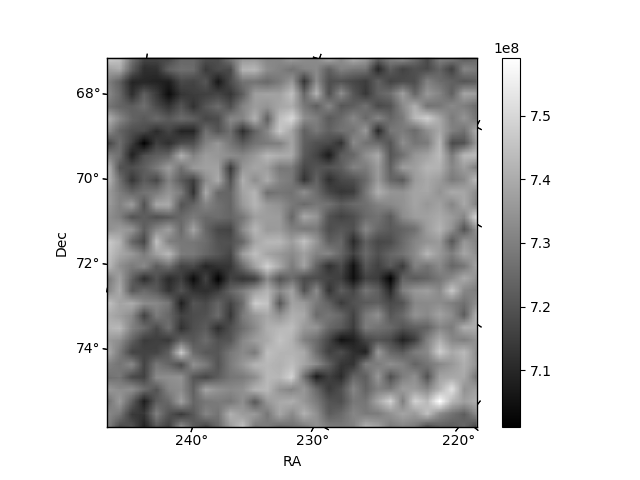
Histogram calculated using DETX and DETY for each event in the final _common_clean file
| Quadrant A | 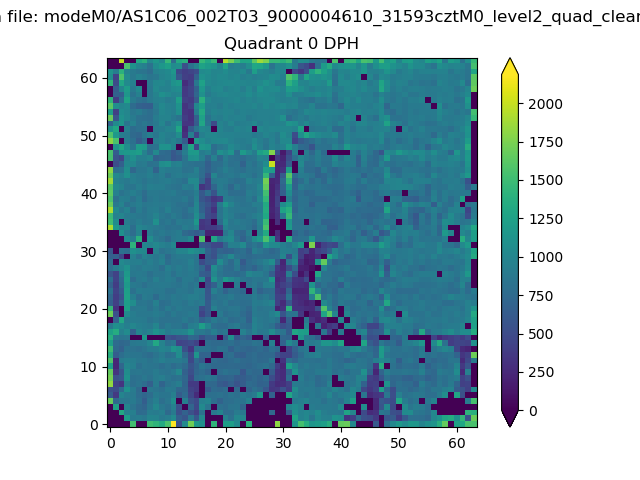 |
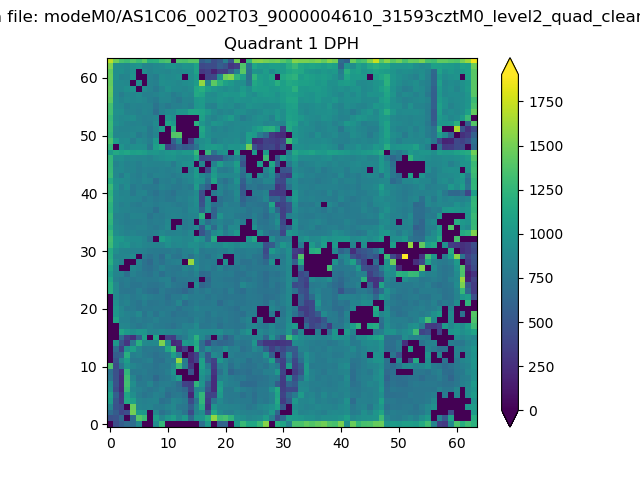 |
Quadrant B |
|---|---|---|---|
| Quadrant D | 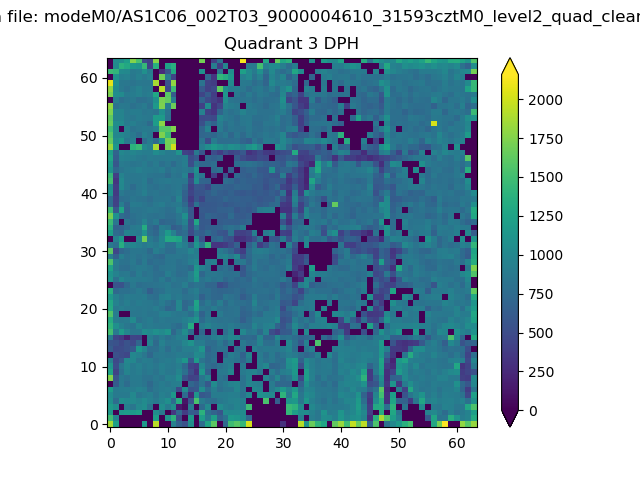 |
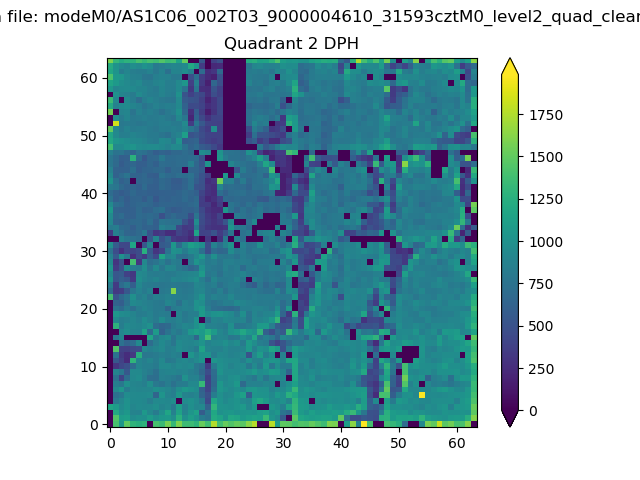 |
Quadrant C |
| Plot type | Count rate plots | Images |
|---|---|---|
| Comparison with Poisson distribution Blue bars denote a histogram of data divided into 1 sec bins. Red curve is a Poisson curve with rate = median count rate of data. |
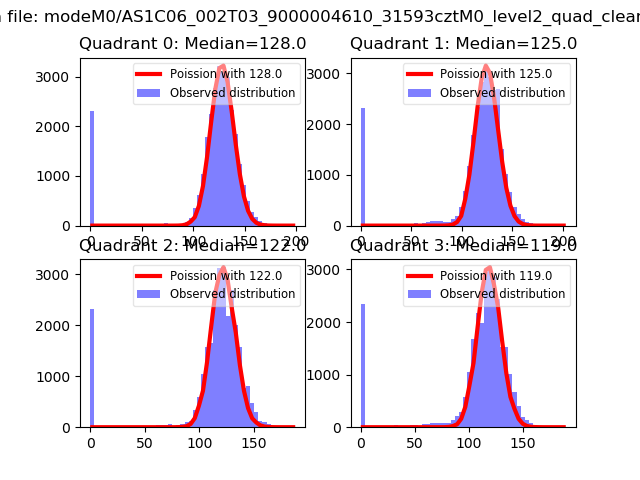 |
 |
| Quadrant-wise count rates Data is divided into 100 sec bins |
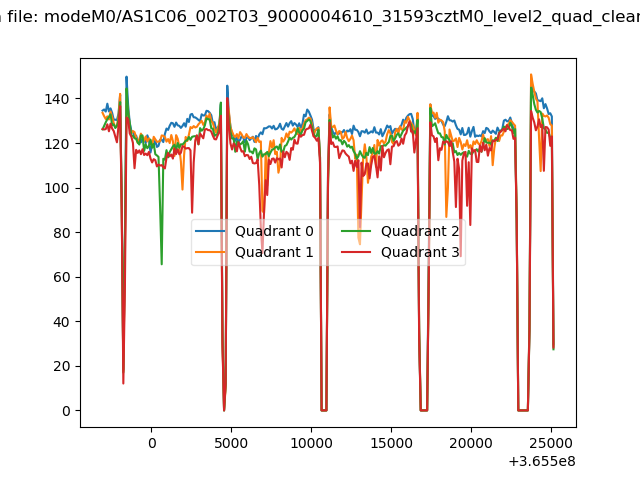 |
|
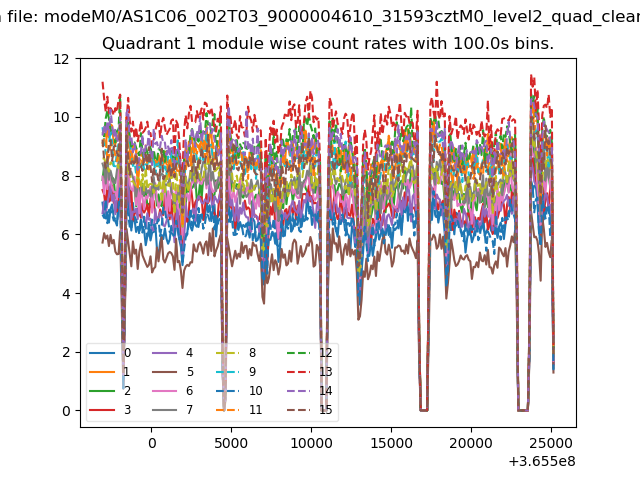
| Module-wise count rates for Quadrant A Data is divided into 100 sec bins |
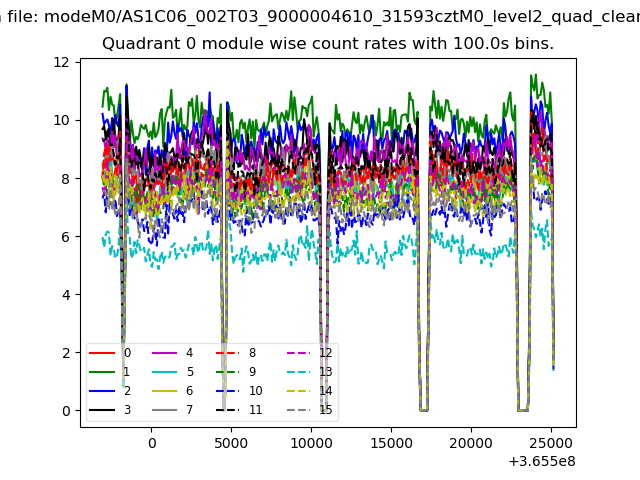 |
 |
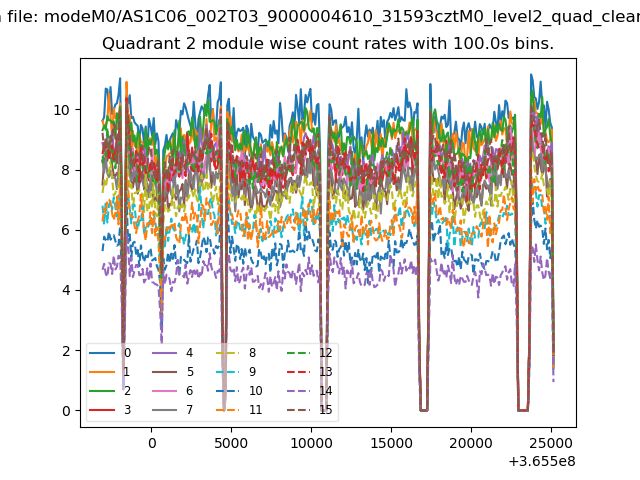
| Module-wise count rates for Quadrant B Data is divided into 100 sec bins |
 |
 |
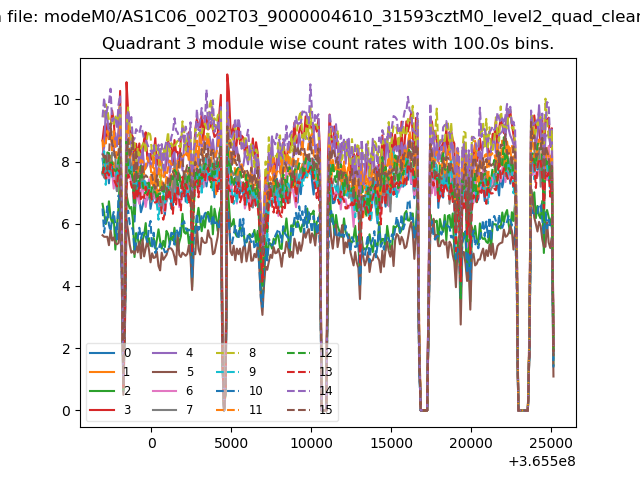
| Module-wise count rates for Quadrant C Data is divided into 100 sec bins |
 |
 |
| Module-wise count rates for Quadrant D Data is divided into 100 sec bins |
 |
 |
| Parameter | Plot |
|---|---|
| CZT HV Monitor | 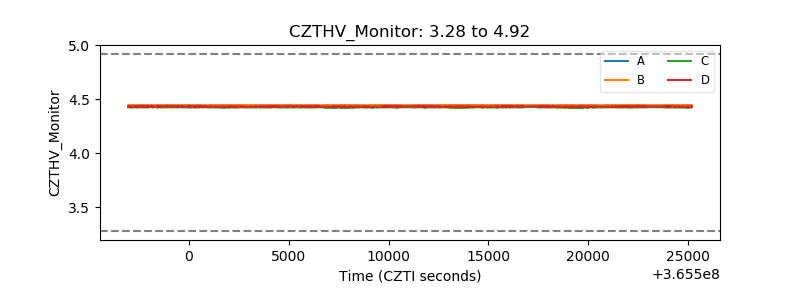 |
| D_VDD | 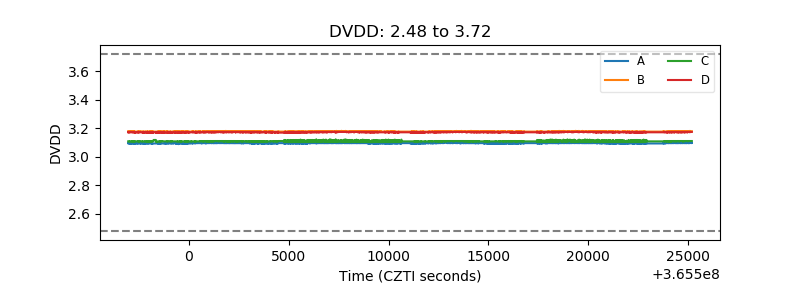 |
| Temperature 1 | 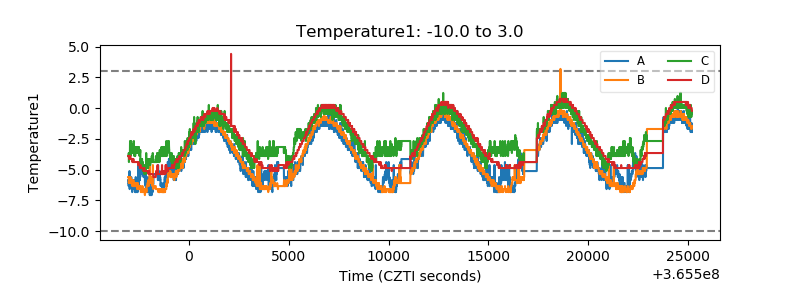 |
| Veto HV Monitor | 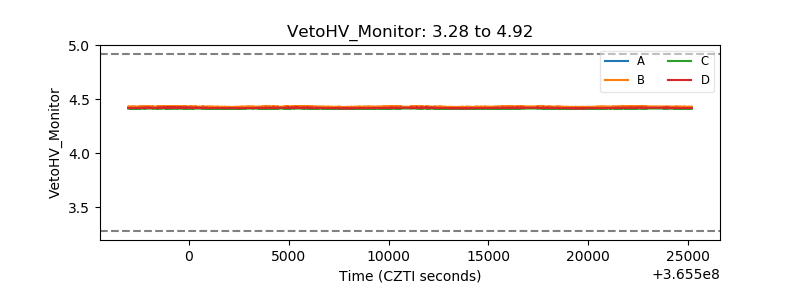 |
| Veto LLD | 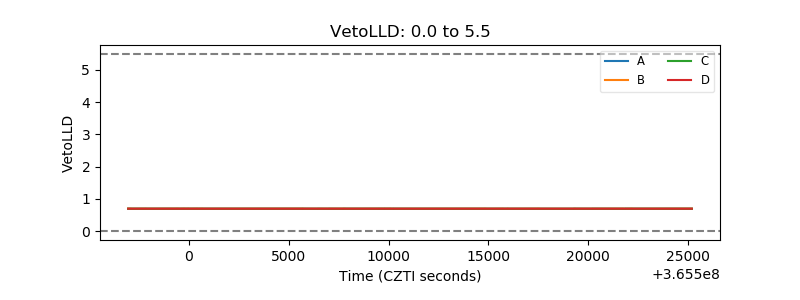 |
| Alpha Counter | 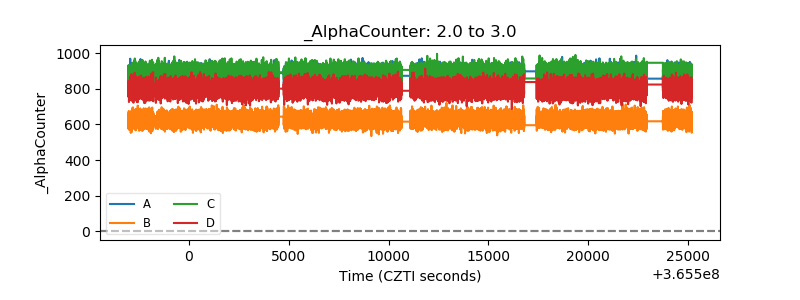 |
| _CPM_Rate | 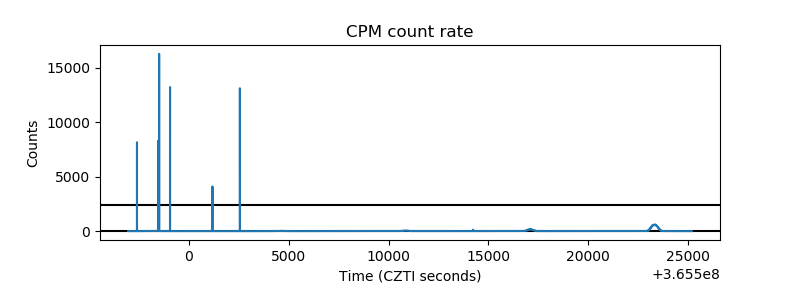 |
| CZT Counter | 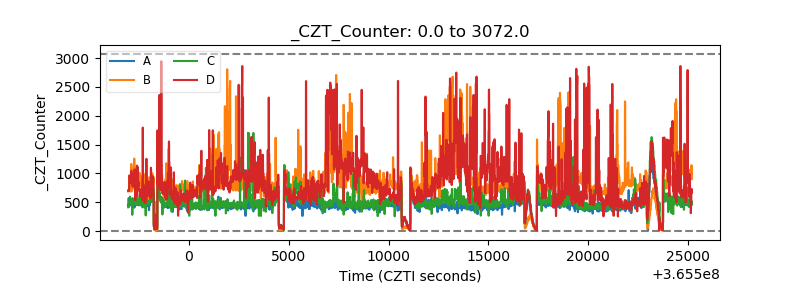 |
| +2.5 Volts monitor |  |
| +5 Volts monitor |  |
| _ROLL_ROT | 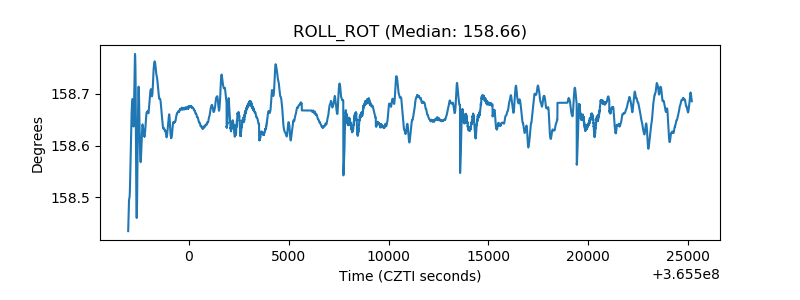 |
| _Roll_DEC | 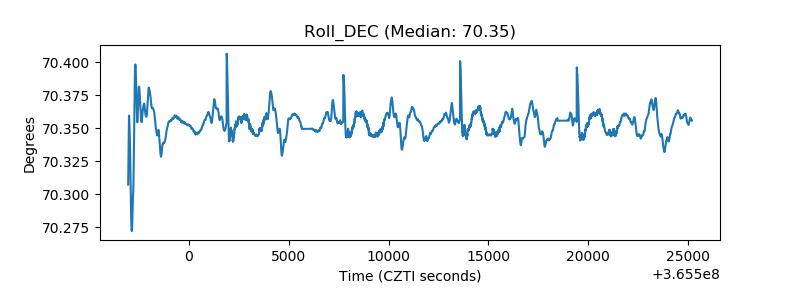 |
| _Roll_RA | 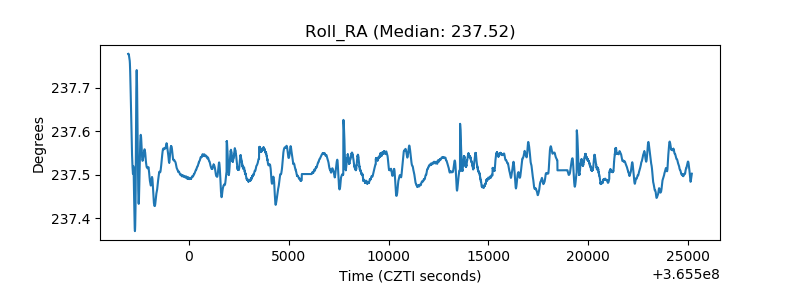 |
| Veto Counter | 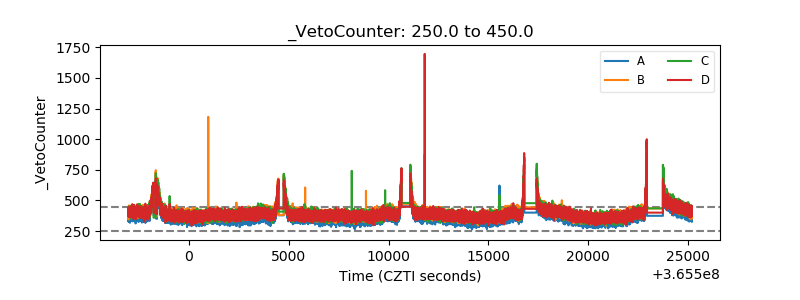 |