| Param | Original file | Final file |
|---|---|---|
| Filename | modeM0/AS1C06_002T03_9000004610_31594cztM0_level2.evt | modeM0/AS1C06_002T03_9000004610_31594cztM0_level2_quad_clean.evt |
| Size (bytes) | 645,356,160 | 129,139,200 |
| Size | 615.5 MB | 123.2 MB |
| Events in quadrant A | 3,175,994 | 897,352 |
| Events in quadrant B | 6,265,556 | 866,620 |
| Events in quadrant C | 5,168,587 | 837,371 |
| Events in quadrant D | 4,481,498 | 842,263 |
| Mode M0 | |||
|---|---|---|---|
| Quadrant | BADHDUFLAG | Total packets | Discarded packets |
| A | 0 | 13900 | 2 |
| B | 0 | 23527 | 2 |
| C | 0 | 19856 | 2 |
| D | 0 | 17931 | 5 |
| Mode SS | |||
|---|---|---|---|
| Quadrant | BADHDUFLAG | Total packets | Discarded packets |
| A | 0 | 138 | 0 |
| B | 0 | 138 | 0 |
| C | 0 | 138 | 0 |
| D | 0 | 138 | 0 |
| Mode M9 | |||
|---|---|---|---|
| Quadrant | BADHDUFLAG | Total packets | Discarded packets |
| A | 0 | 11 | 0 |
| B | 0 | 12 | 0 |
| C | 0 | 12 | 0 |
| D | 0 | 12 | 0 |
| Quadrant | Total seconds | Saturated seconds | Saturation percentage |
|---|---|---|---|
| A | 6701 | 33 | 0.492464% |
| B | 6701 | 248 | 3.700940% |
| C | 6701 | 403 | 6.014028% |
| D | 6700 | 161 | 2.402985% |
Noise dominated data is calculated using 1-second bins in cleaned event files. If a bin has >2000 counts, and if more than 50% of those come from <1% of pixels, then it is considered to be noise-dominated and hence unusable.
| Quadrant | # 1 sec bins | Bins with >0 counts | Bins with >2000 counts | High rate bins dominated by noise | Noise dominated (total time) | Noise dominated (detector-on time) | Marked lightcurve |
|---|---|---|---|---|---|---|---|
| A | 7671 | 6701 | 0 | 0 | 0.00% | 0.00% | 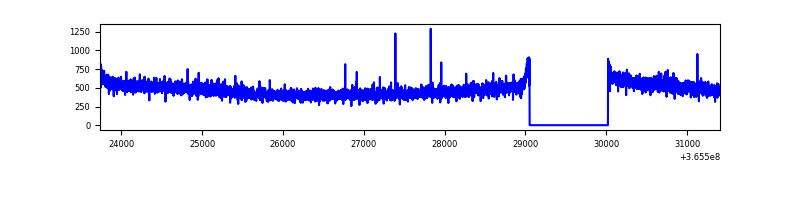 |
| B | 7671 | 6701 | 77 | 77 | 1.00% | 1.15% | 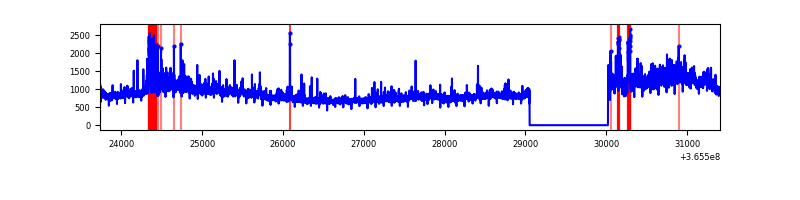 |
| C | 7671 | 6701 | 157 | 157 | 2.05% | 2.34% | 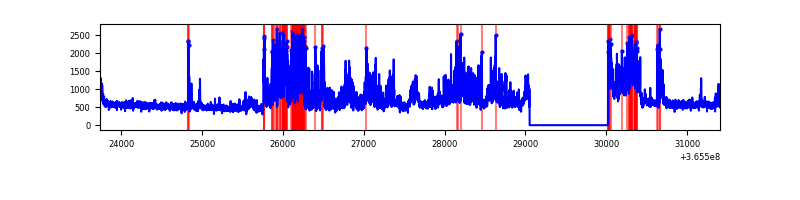 |
| D | 7670 | 6700 | 91 | 91 | 1.19% | 1.36% | 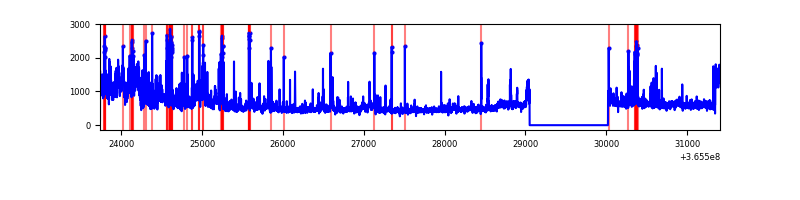 |
Top three noisy pixels from each quadrant. If the there are fewer than three noisy pixels in the level2.evt file, extra rows are filled as -1
| Pixel properties | Quadrant properties | ||||||
|---|---|---|---|---|---|---|---|
| Quadrant | DetID | PixID | Counts | Sigma | Mean | Median | Sigma |
| A | 13 | 254 | 13950 | 80.08 | 821 | 805 | 164.1 |
| A | 3 | 137 | 7912 | 43.3 | 821 | 805 | 164.1 |
| A | 0 | 226 | 7189 | 38.89 | 821 | 805 | 164.1 |
| B | 6 | 159 | 2088227 | 13992.61 | 798 | 777 | 149.2 |
| B | 12 | 1 | 584193 | 3910.76 | 798 | 777 | 149.2 |
| B | 5 | 172 | 196327 | 1310.81 | 798 | 777 | 149.2 |
| C | 3 | 233 | 1794359 | 9946.43 | 775 | 777 | 180.3 |
| C | 14 | 238 | 123591 | 681.07 | 775 | 777 | 180.3 |
| C | 4 | 175 | 64048 | 350.87 | 775 | 777 | 180.3 |
| D | 8 | 195 | 881933 | 4591.82 | 796 | 773 | 191.9 |
| D | 12 | 218 | 228113 | 1184.69 | 796 | 773 | 191.9 |
| D | 12 | 6 | 135311 | 701.09 | 796 | 773 | 191.9 |
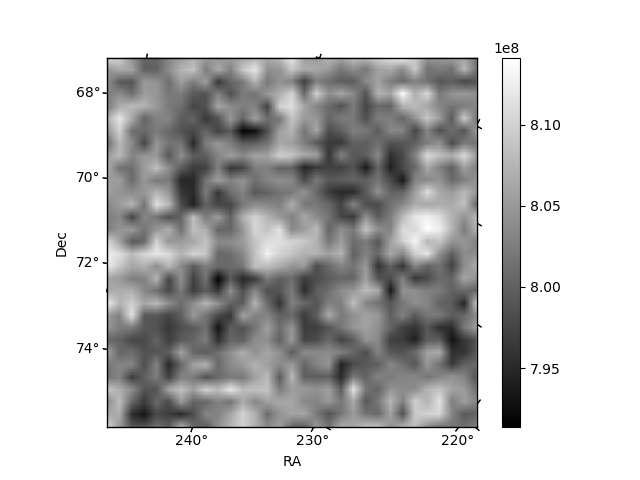
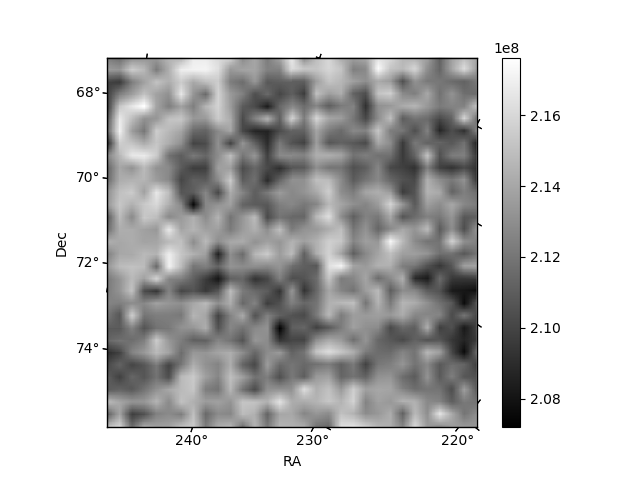
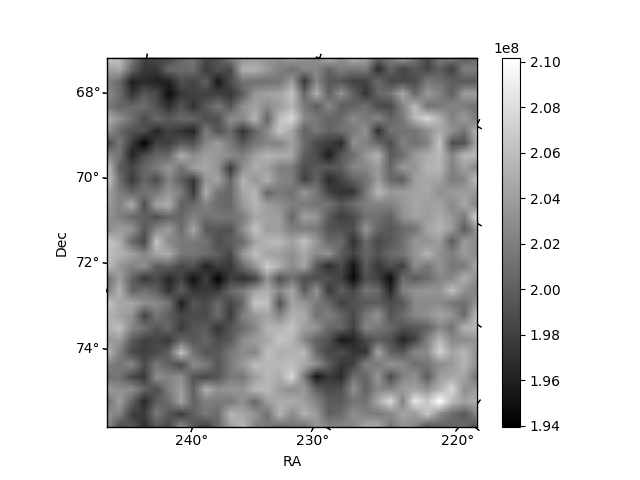
Histogram calculated using DETX and DETY for each event in the final _common_clean file
| Quadrant A | 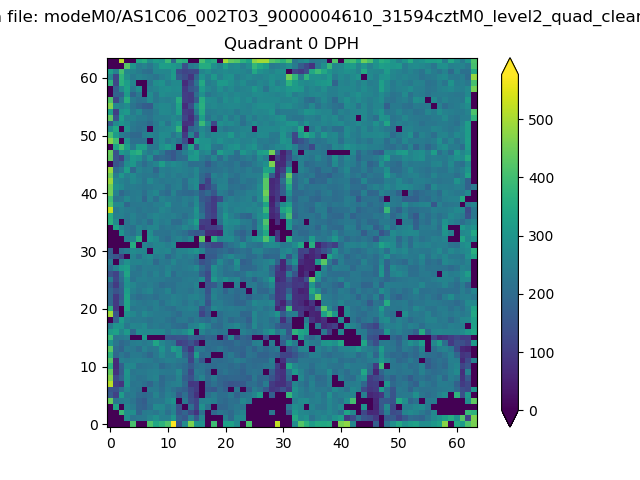 |
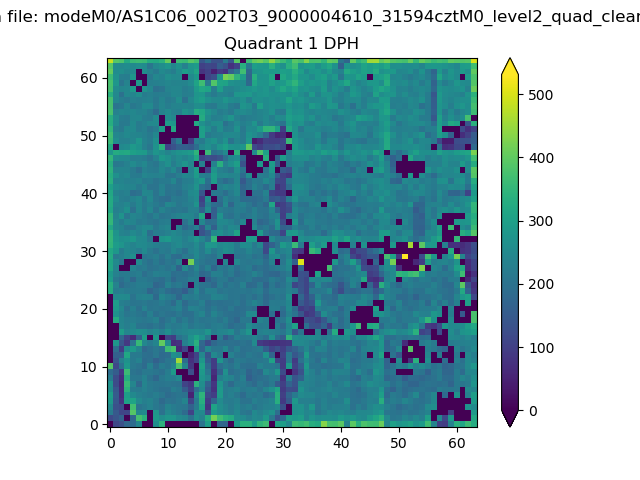 |
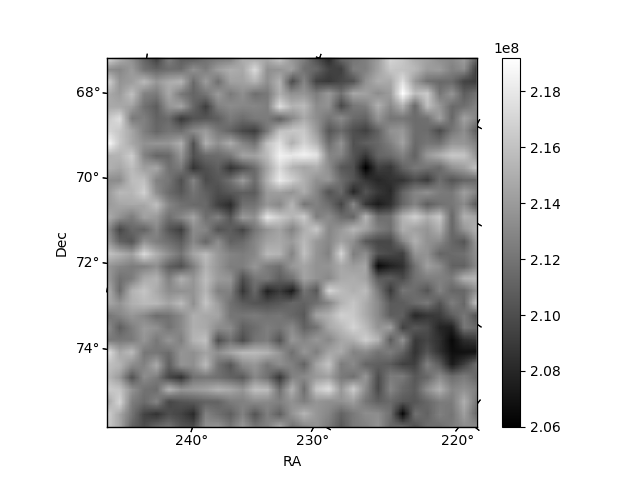
Quadrant B |
|---|---|---|---|
| Quadrant D | 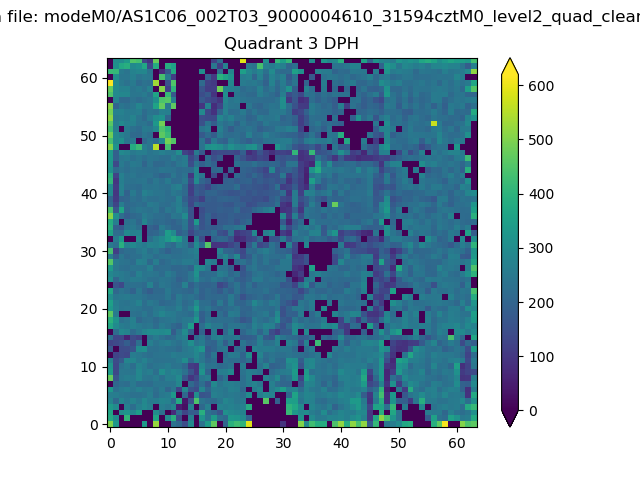 |
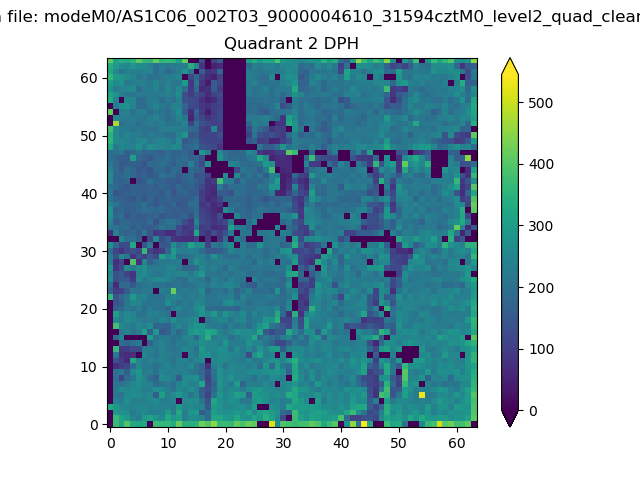 |
Quadrant C |
| Plot type | Count rate plots | Images |
|---|---|---|
| Comparison with Poisson distribution Blue bars denote a histogram of data divided into 1 sec bins. Red curve is a Poisson curve with rate = median count rate of data. |
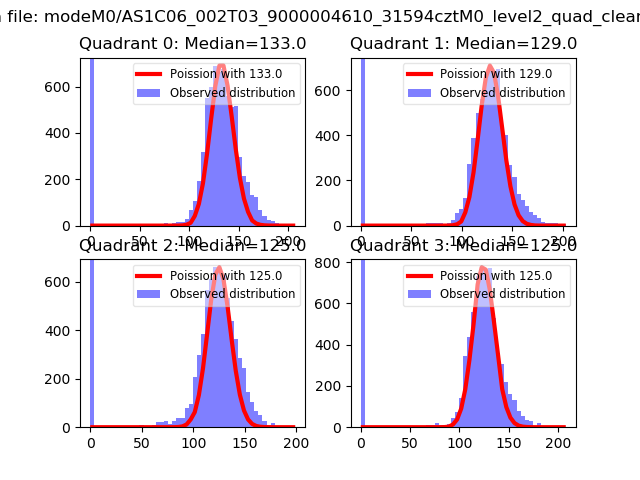 |
 |
| Quadrant-wise count rates Data is divided into 100 sec bins |
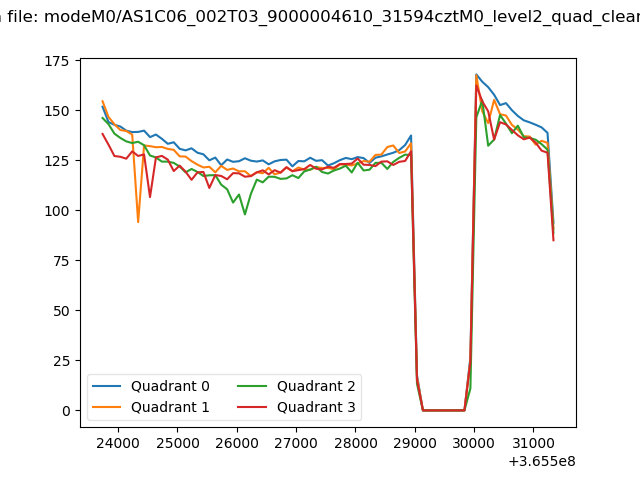 |
|
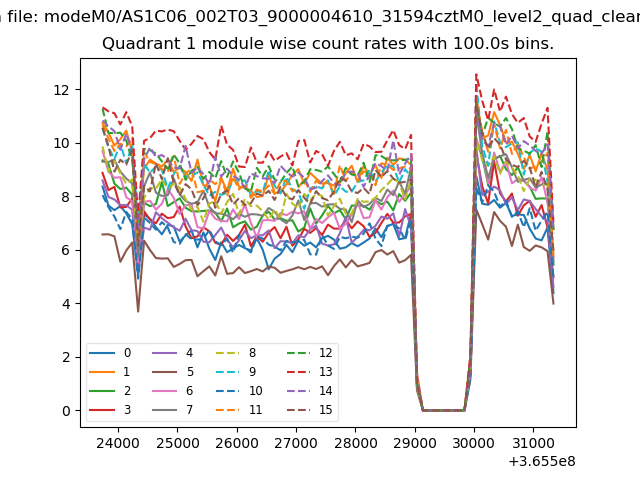
| Module-wise count rates for Quadrant A Data is divided into 100 sec bins |
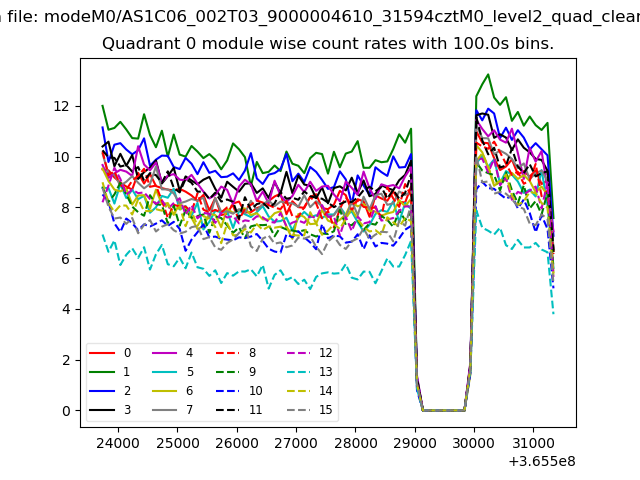 |
 |
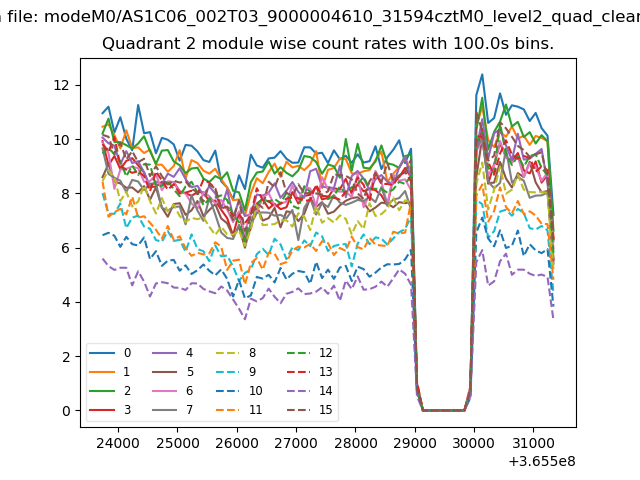
| Module-wise count rates for Quadrant B Data is divided into 100 sec bins |
 |
 |
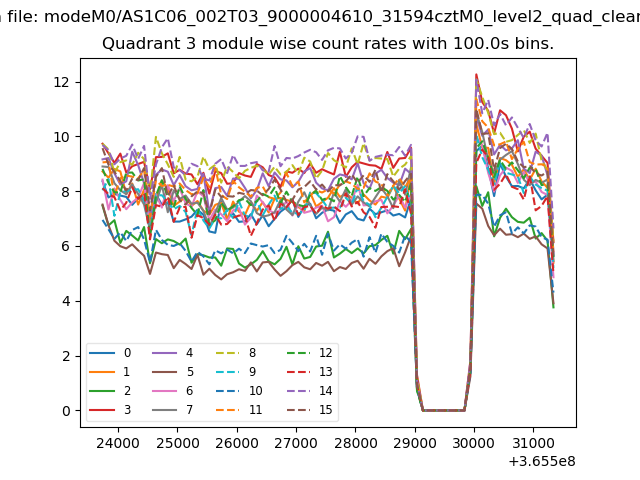
| Module-wise count rates for Quadrant C Data is divided into 100 sec bins |
 |
 |
| Module-wise count rates for Quadrant D Data is divided into 100 sec bins |
 |
 |
| Parameter | Plot |
|---|---|
| CZT HV Monitor | 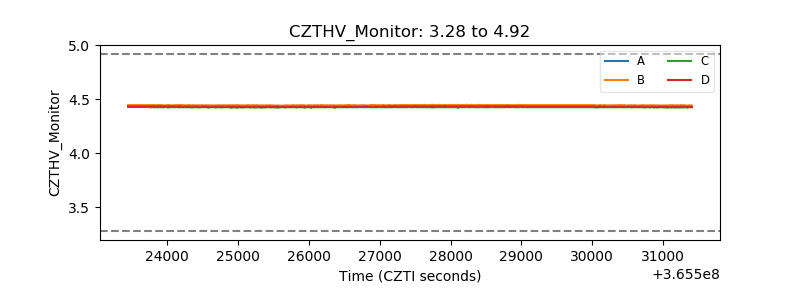 |
| D_VDD | 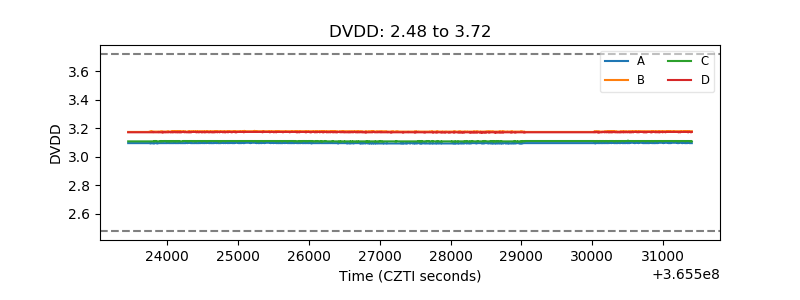 |
| Temperature 1 | 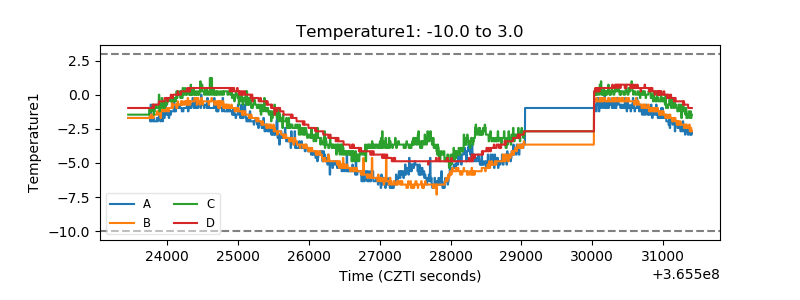 |
| Veto HV Monitor | 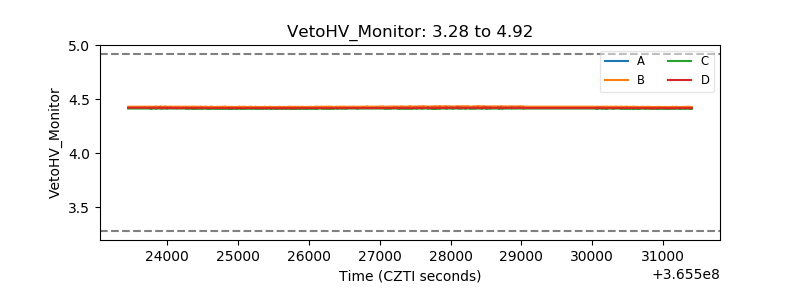 |
| Veto LLD | 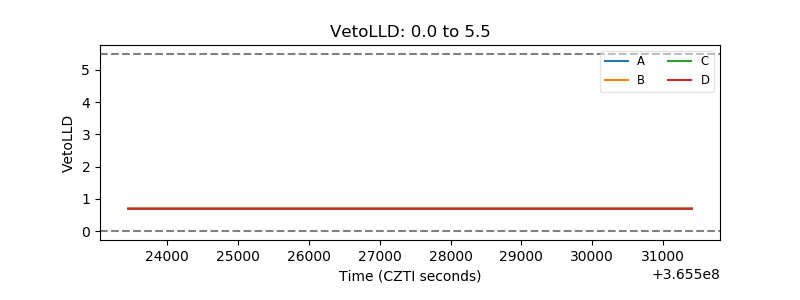 |
| Alpha Counter | 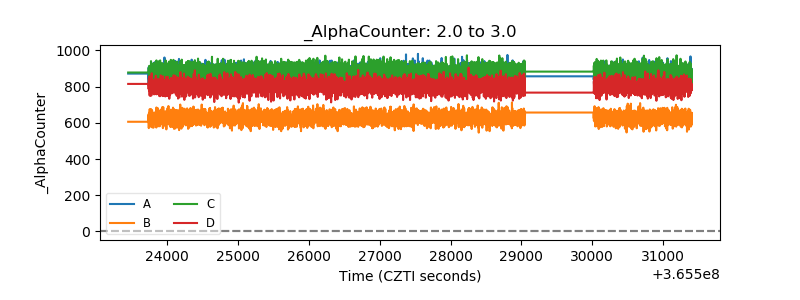 |
| _CPM_Rate | 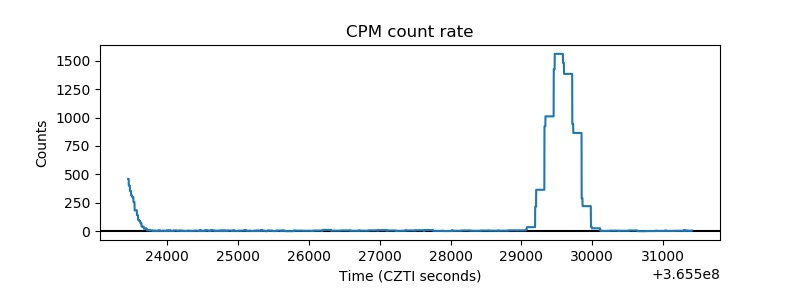 |
| CZT Counter | 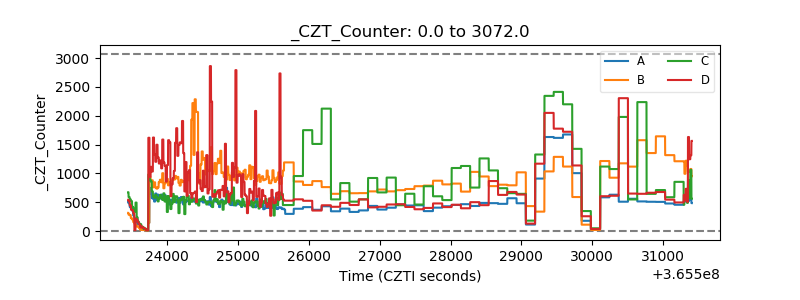 |
| +2.5 Volts monitor |  |
| +5 Volts monitor |  |
| _ROLL_ROT | 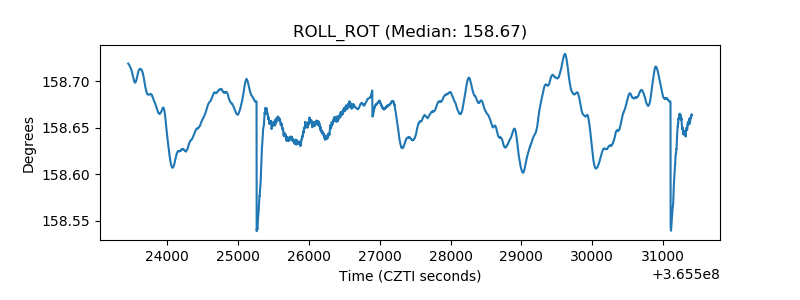 |
| _Roll_DEC | 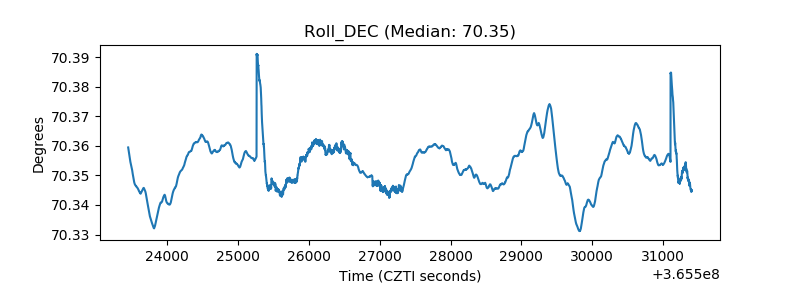 |
| _Roll_RA | 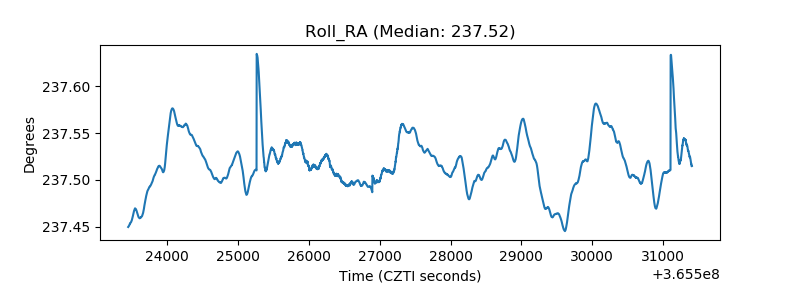 |
| Veto Counter | 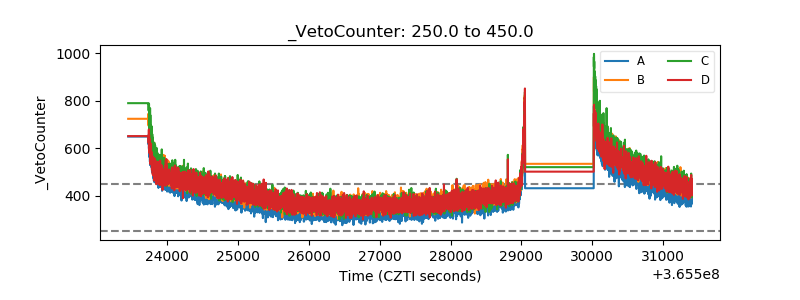 |