| Param | Original file | Final file |
|---|---|---|
| Filename | modeM0/AS1C06_002T03_9000004610_31597cztM0_level2.evt | modeM0/AS1C06_002T03_9000004610_31597cztM0_level2_quad_clean.evt |
| Size (bytes) | 689,463,360 | 122,981,760 |
| Size | 657.5 MB | 117.3 MB |
| Events in quadrant A | 2,929,951 | 862,722 |
| Events in quadrant B | 5,716,612 | 847,824 |
| Events in quadrant C | 3,678,516 | 844,891 |
| Events in quadrant D | 8,151,393 | 750,062 |
| Mode M0 | |||
|---|---|---|---|
| Quadrant | BADHDUFLAG | Total packets | Discarded packets |
| A | 0 | 12669 | 1 |
| B | 0 | 21377 | 1 |
| C | 0 | 14831 | 2 |
| D | 0 | 28468 | 1 |
| Mode SS | |||
|---|---|---|---|
| Quadrant | BADHDUFLAG | Total packets | Discarded packets |
| A | 0 | 122 | 0 |
| B | 0 | 122 | 0 |
| C | 0 | 122 | 0 |
| D | 0 | 122 | 0 |
| Mode M9 | |||
|---|---|---|---|
| Quadrant | BADHDUFLAG | Total packets | Discarded packets |
| A | 0 | 12 | 0 |
| B | 0 | 12 | 0 |
| C | 0 | 12 | 0 |
| D | 0 | 12 | 0 |
| Quadrant | Total seconds | Saturated seconds | Saturation percentage |
|---|---|---|---|
| A | 5995 | 34 | 0.567139% |
| B | 5996 | 293 | 4.886591% |
| C | 5995 | 247 | 4.120100% |
| D | 5995 | 1100 | 18.348624% |
Noise dominated data is calculated using 1-second bins in cleaned event files. If a bin has >2000 counts, and if more than 50% of those come from <1% of pixels, then it is considered to be noise-dominated and hence unusable.
| Quadrant | # 1 sec bins | Bins with >0 counts | Bins with >2000 counts | High rate bins dominated by noise | Noise dominated (total time) | Noise dominated (detector-on time) | Marked lightcurve |
|---|---|---|---|---|---|---|---|
| A | 7195 | 5995 | 2 | 2 | 0.03% | 0.03% | 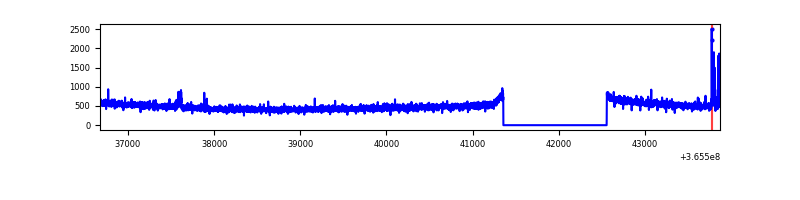 |
| B | 7196 | 5996 | 117 | 117 | 1.63% | 1.95% | 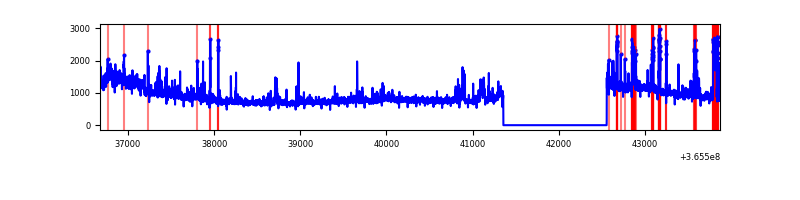 |
| C | 7195 | 5995 | 114 | 114 | 1.58% | 1.90% | 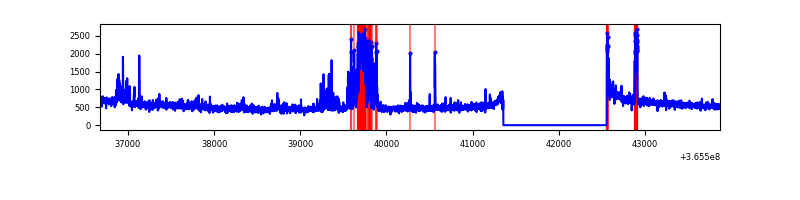 |
| D | 7195 | 5995 | 1128 | 1128 | 15.68% | 18.82% | 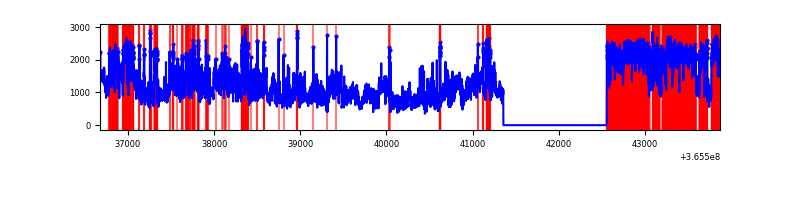 |
Top three noisy pixels from each quadrant. If the there are fewer than three noisy pixels in the level2.evt file, extra rows are filled as -1
| Pixel properties | Quadrant properties | ||||||
|---|---|---|---|---|---|---|---|
| Quadrant | DetID | PixID | Counts | Sigma | Mean | Median | Sigma |
| A | 0 | 13 | 42415 | 282.0 | 745 | 731 | 147.8 |
| A | 13 | 254 | 11673 | 74.02 | 745 | 731 | 147.8 |
| A | 4 | 208 | 8684 | 53.8 | 745 | 731 | 147.8 |
| B | 6 | 159 | 1980517 | 14447.44 | 736 | 719 | 137.0 |
| B | 12 | 1 | 249756 | 1817.33 | 736 | 719 | 137.0 |
| B | 5 | 172 | 172688 | 1254.93 | 736 | 719 | 137.0 |
| C | 3 | 233 | 470120 | 2754.0 | 730 | 734 | 170.4 |
| C | 14 | 238 | 118455 | 690.7 | 730 | 734 | 170.4 |
| C | 10 | 22 | 64050 | 371.49 | 730 | 734 | 170.4 |
| D | 8 | 195 | 4390093 | 27025.2 | 690 | 672 | 162.4 |
| D | 12 | 2 | 462690 | 2844.6 | 690 | 672 | 162.4 |
| D | 12 | 218 | 248070 | 1523.2 | 690 | 672 | 162.4 |
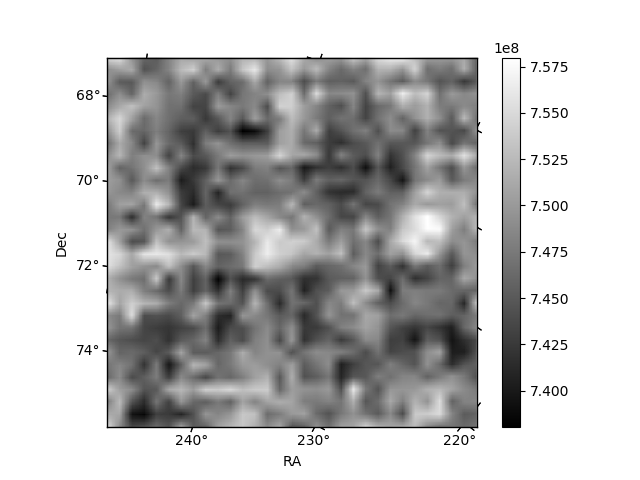
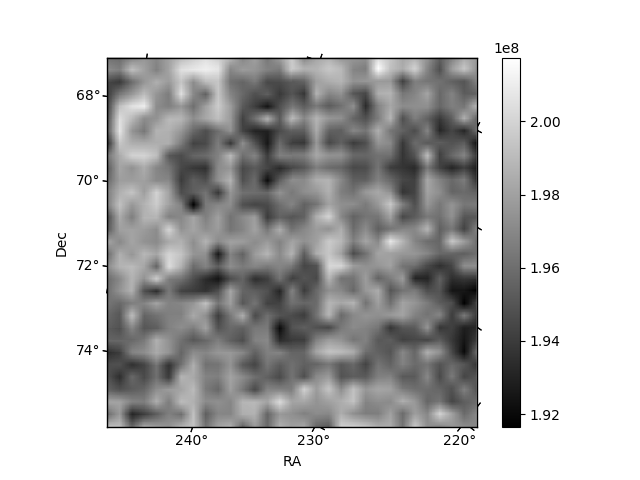
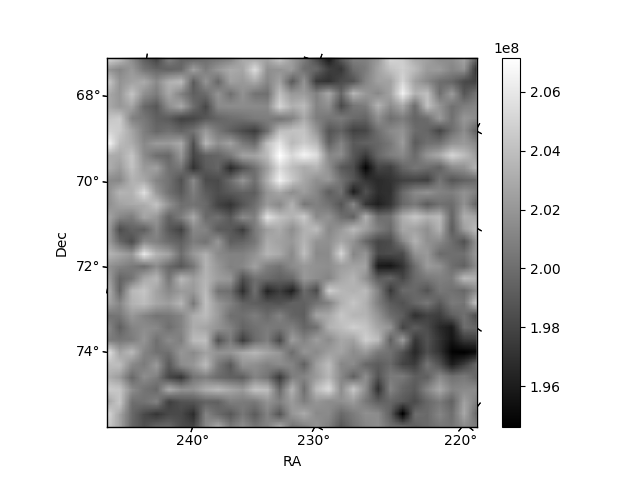
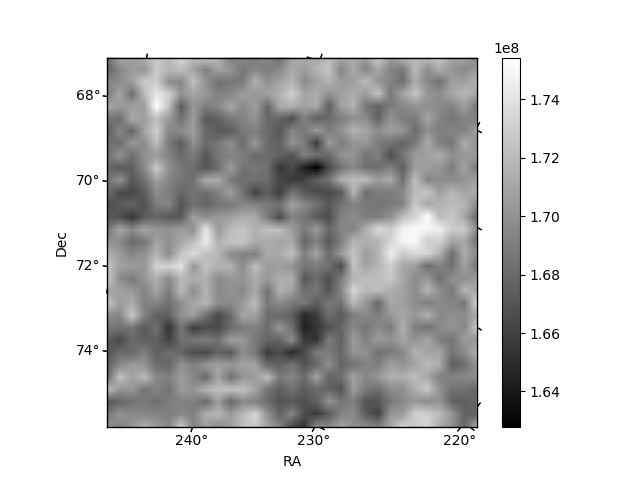
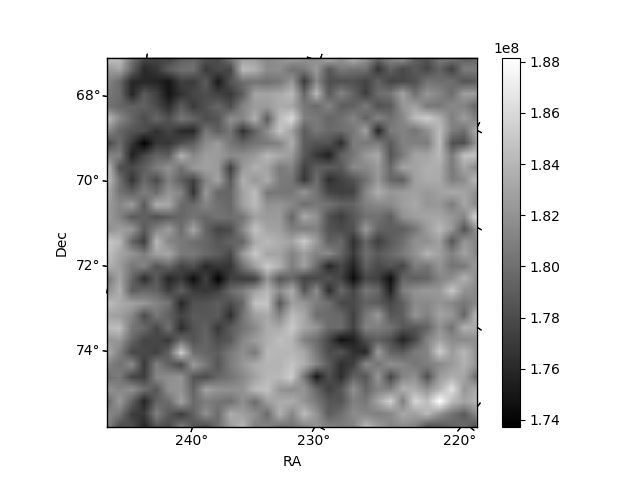
Histogram calculated using DETX and DETY for each event in the final _common_clean file
| Quadrant A | 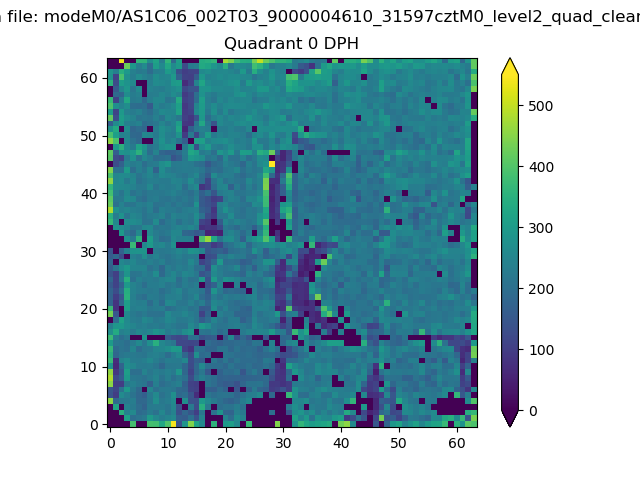 |
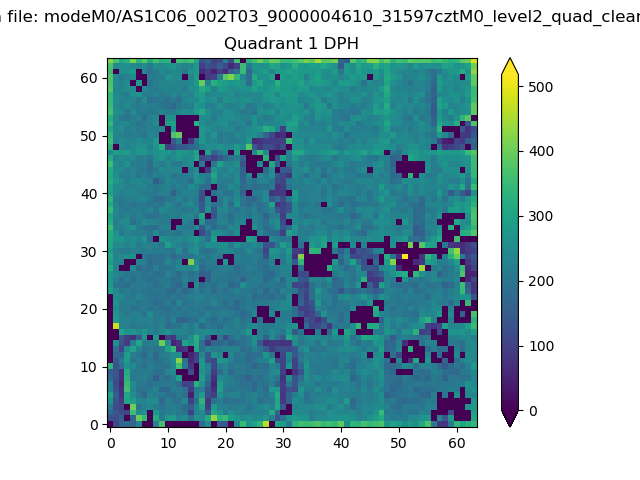 |
Quadrant B |
|---|---|---|---|
| Quadrant D | 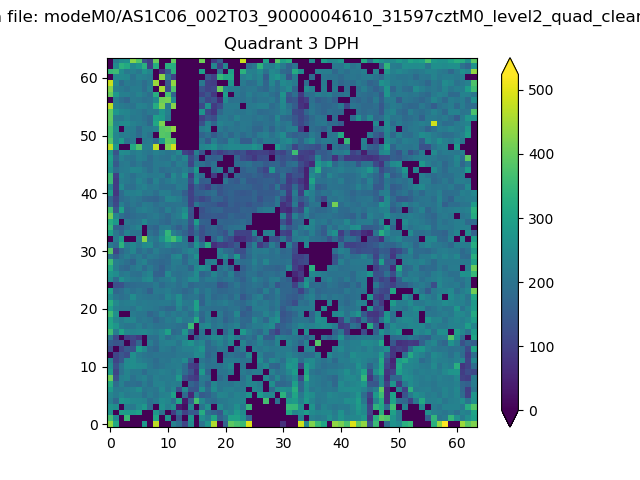 |
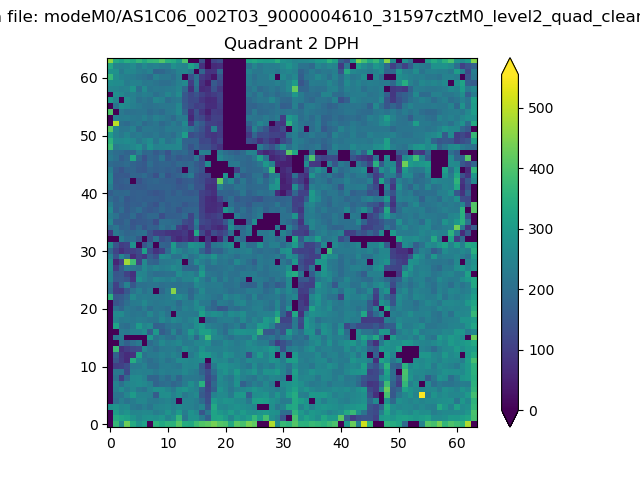 |
Quadrant C |
| Plot type | Count rate plots | Images |
|---|---|---|
| Comparison with Poisson distribution Blue bars denote a histogram of data divided into 1 sec bins. Red curve is a Poisson curve with rate = median count rate of data. |
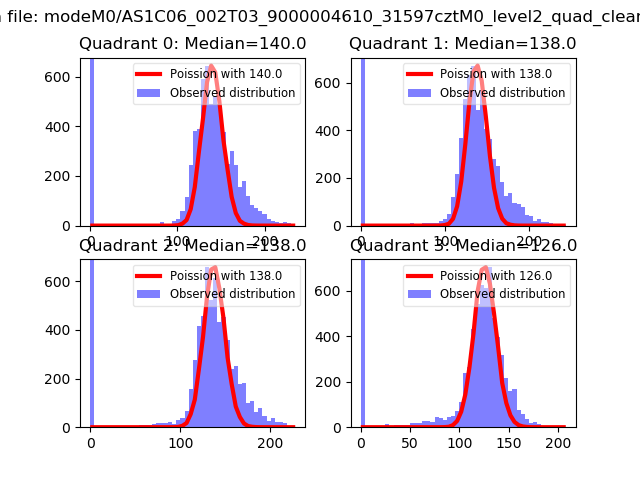 |
 |
| Quadrant-wise count rates Data is divided into 100 sec bins |
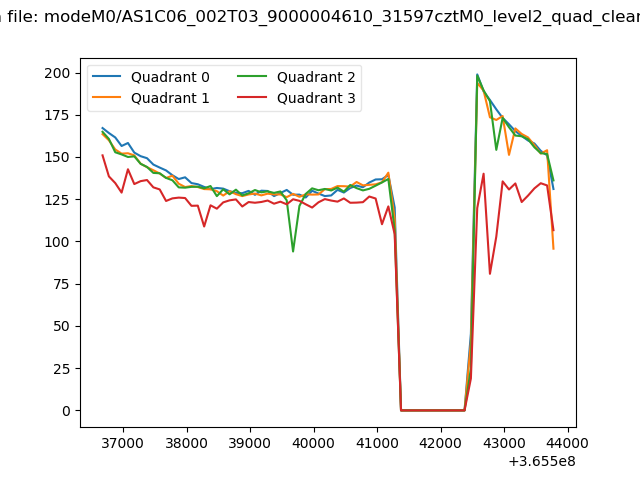 |
|
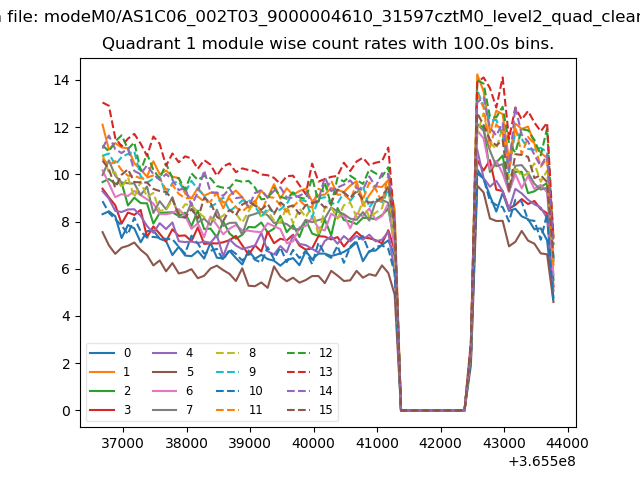
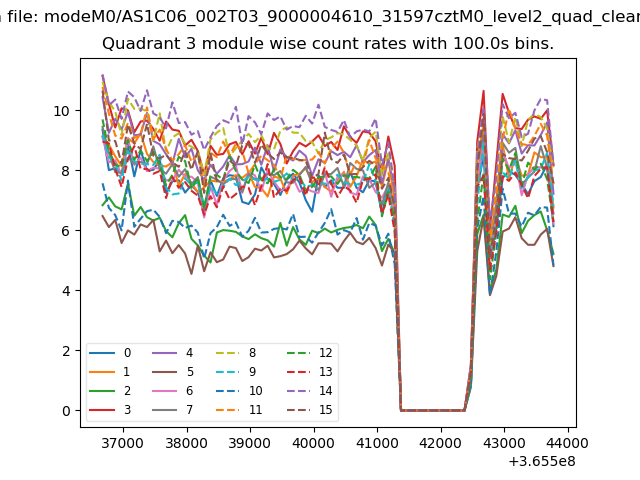
| Module-wise count rates for Quadrant A Data is divided into 100 sec bins |
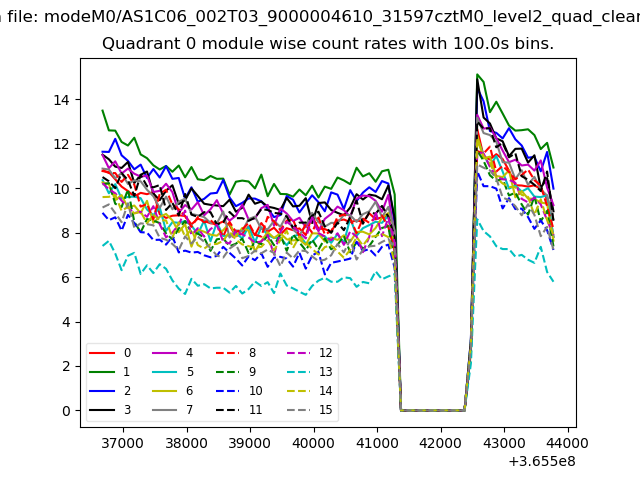 |
 |
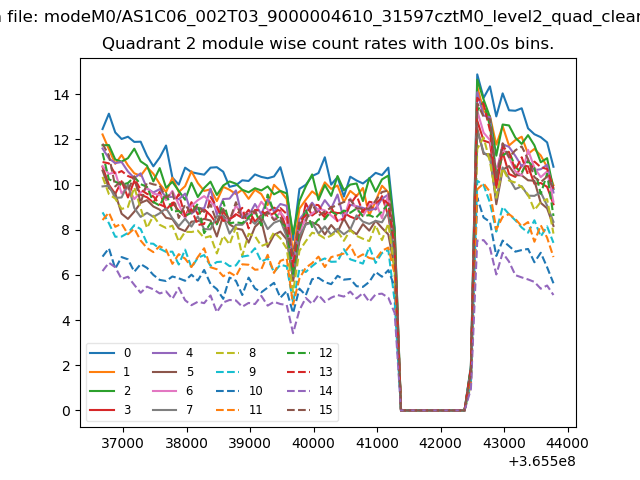
| Module-wise count rates for Quadrant B Data is divided into 100 sec bins |
 |
 |
| Module-wise count rates for Quadrant C Data is divided into 100 sec bins |
 |
 |
| Module-wise count rates for Quadrant D Data is divided into 100 sec bins |
 |
 |
| Parameter | Plot |
|---|---|
| CZT HV Monitor | 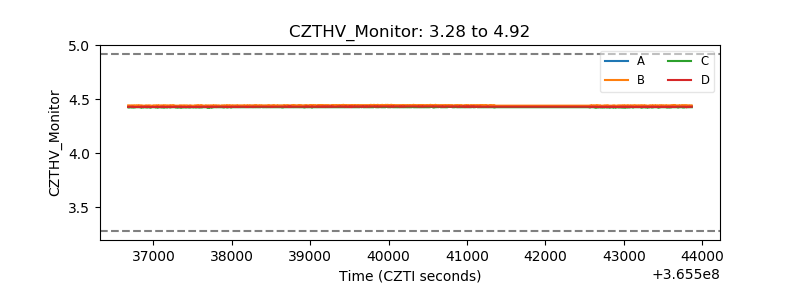 |
| D_VDD | 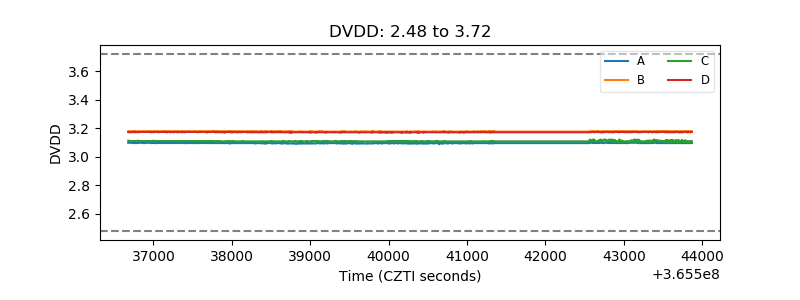 |
| Temperature 1 | 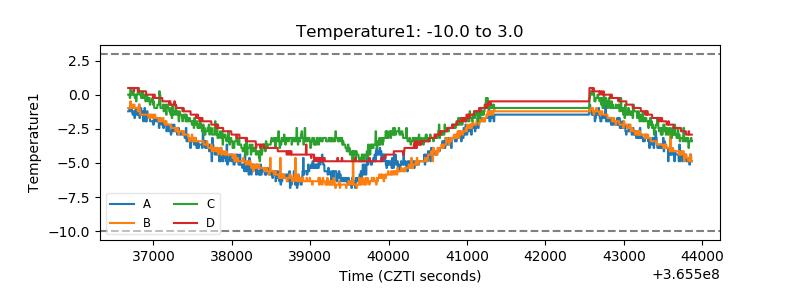 |
| Veto HV Monitor |  |
| Veto LLD | 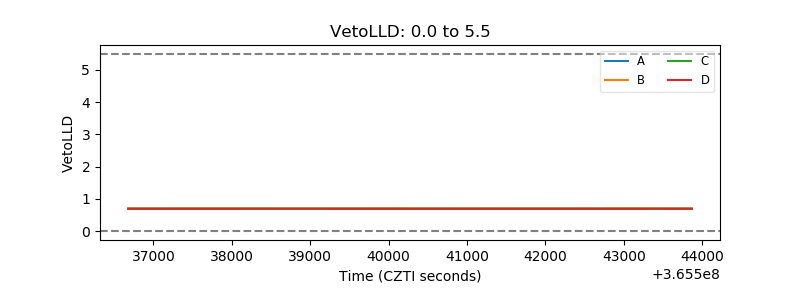 |
| Alpha Counter | 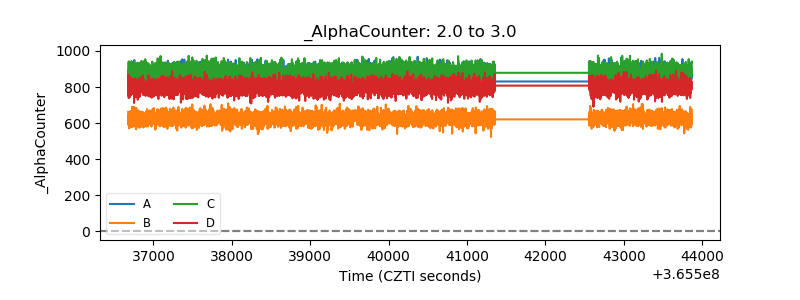 |
| _CPM_Rate | 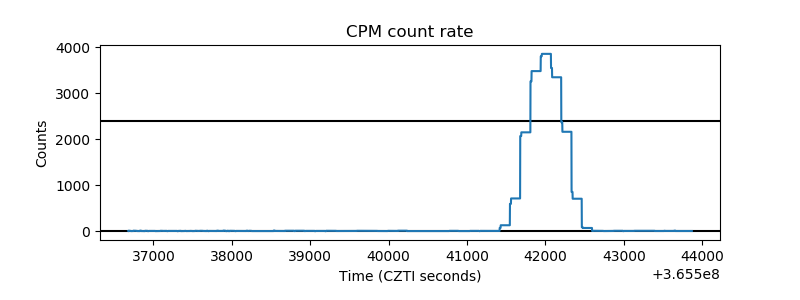 |
| CZT Counter | 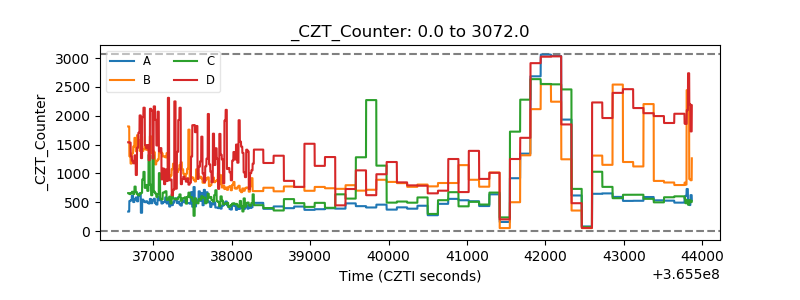 |
| +2.5 Volts monitor |  |
| +5 Volts monitor |  |
| _ROLL_ROT | 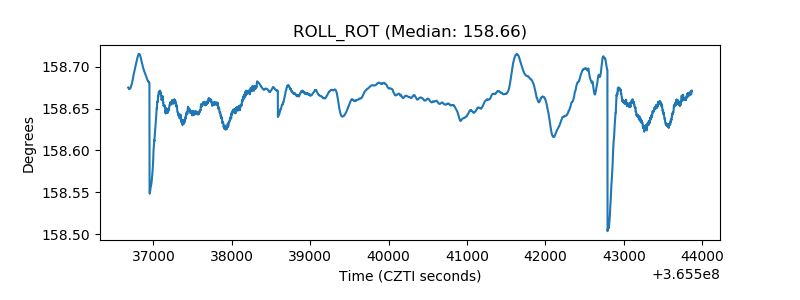 |
| _Roll_DEC | 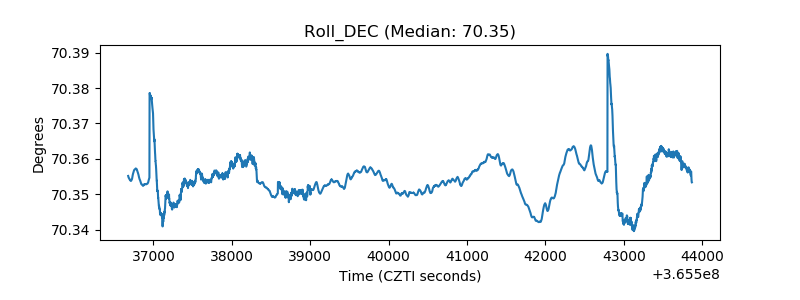 |
| _Roll_RA | 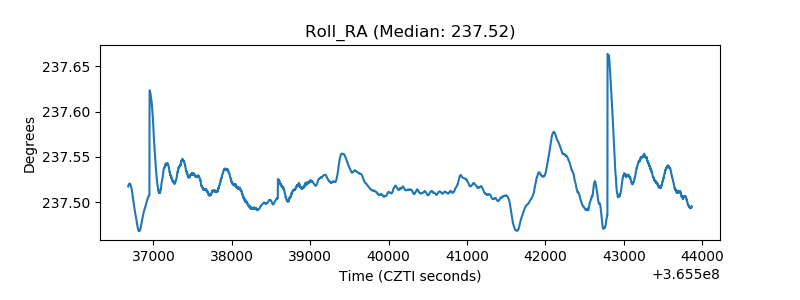 |
| Veto Counter | 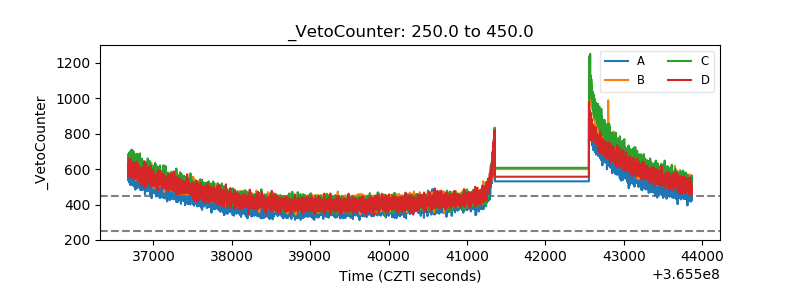 |