| Param | Original file | Final file |
|---|---|---|
| Filename | modeM0/AS1C06_002T03_9000004610_31598cztM0_level2.evt | modeM0/AS1C06_002T03_9000004610_31598cztM0_level2_quad_clean.evt |
| Size (bytes) | 838,664,640 | 107,320,320 |
| Size | 799.8 MB | 102.3 MB |
| Events in quadrant A | 8,535,510 | 526,442 |
| Events in quadrant B | 4,967,383 | 832,520 |
| Events in quadrant C | 4,622,625 | 752,266 |
| Events in quadrant D | 6,890,947 | 739,489 |
| Mode M0 | |||
|---|---|---|---|
| Quadrant | BADHDUFLAG | Total packets | Discarded packets |
| A | 0 | 29135 | 2 |
| B | 0 | 19091 | 1 |
| C | 0 | 17431 | 1 |
| D | 0 | 24402 | 1 |
| Mode SS | |||
|---|---|---|---|
| Quadrant | BADHDUFLAG | Total packets | Discarded packets |
| A | 0 | 116 | 0 |
| B | 0 | 116 | 0 |
| C | 0 | 116 | 0 |
| D | 0 | 116 | 0 |
| Mode M9 | |||
|---|---|---|---|
| Quadrant | BADHDUFLAG | Total packets | Discarded packets |
| A | 0 | 13 | 0 |
| B | 0 | 13 | 0 |
| C | 0 | 13 | 0 |
| D | 0 | 13 | 0 |
| Quadrant | Total seconds | Saturated seconds | Saturation percentage |
|---|---|---|---|
| A | 5679 | 2953 | 51.998591% |
| B | 5680 | 206 | 3.626761% |
| C | 5680 | 900 | 15.845070% |
| D | 5680 | 969 | 17.059859% |
Noise dominated data is calculated using 1-second bins in cleaned event files. If a bin has >2000 counts, and if more than 50% of those come from <1% of pixels, then it is considered to be noise-dominated and hence unusable.
| Quadrant | # 1 sec bins | Bins with >0 counts | Bins with >2000 counts | High rate bins dominated by noise | Noise dominated (total time) | Noise dominated (detector-on time) | Marked lightcurve |
|---|---|---|---|---|---|---|---|
| A | 6988 | 5678 | 2201 | 2201 | 31.50% | 38.76% | 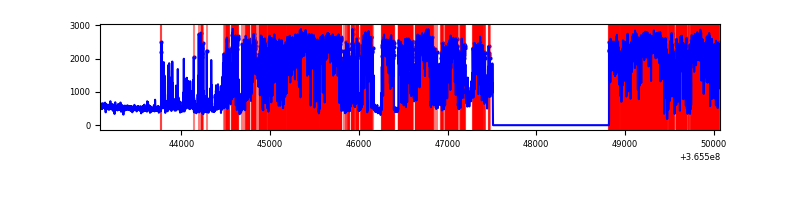 |
| B | 6990 | 5680 | 103 | 103 | 1.47% | 1.81% | 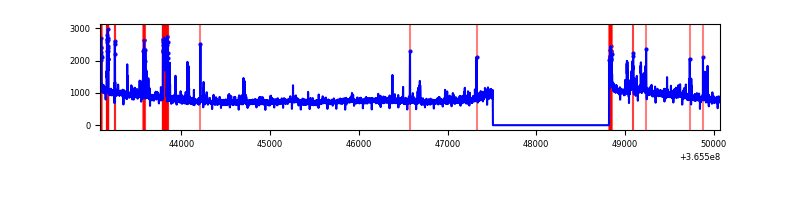 |
| C | 6989 | 5679 | 782 | 782 | 11.19% | 13.77% | 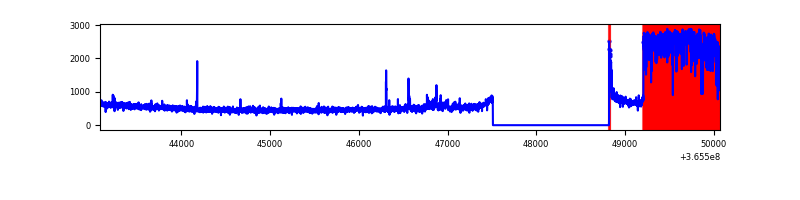 |
| D | 6989 | 5679 | 1064 | 1064 | 15.22% | 18.74% | 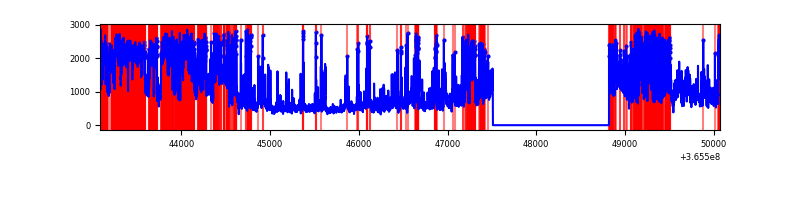 |
Top three noisy pixels from each quadrant. If the there are fewer than three noisy pixels in the level2.evt file, extra rows are filled as -1
| Pixel properties | Quadrant properties | ||||||
|---|---|---|---|---|---|---|---|
| Quadrant | DetID | PixID | Counts | Sigma | Mean | Median | Sigma |
| A | 0 | 13 | 6710246 | 71904.49 | 472 | 464 | 93.3 |
| A | 13 | 254 | 7699 | 77.53 | 472 | 464 | 93.3 |
| A | 3 | 137 | 4154 | 39.54 | 472 | 464 | 93.3 |
| B | 6 | 159 | 1702264 | 13182.41 | 704 | 687 | 129.1 |
| B | 0 | 229 | 129747 | 999.85 | 704 | 687 | 129.1 |
| B | 5 | 172 | 102297 | 787.19 | 704 | 687 | 129.1 |
| C | 3 | 233 | 1901717 | 12750.95 | 642 | 650 | 149.1 |
| C | 14 | 238 | 104158 | 694.25 | 642 | 650 | 149.1 |
| C | 0 | 10 | 32710 | 215.03 | 642 | 650 | 149.1 |
| D | 8 | 195 | 2170682 | 13854.47 | 662 | 644 | 156.6 |
| D | 11 | 176 | 930664 | 5937.65 | 662 | 644 | 156.6 |
| D | 12 | 218 | 547960 | 3494.3 | 662 | 644 | 156.6 |
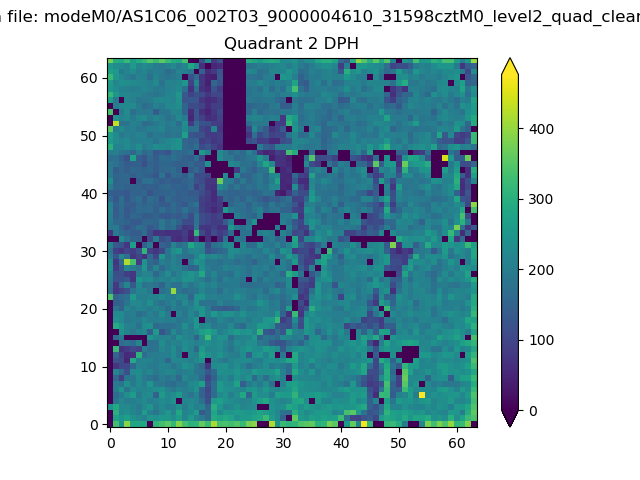
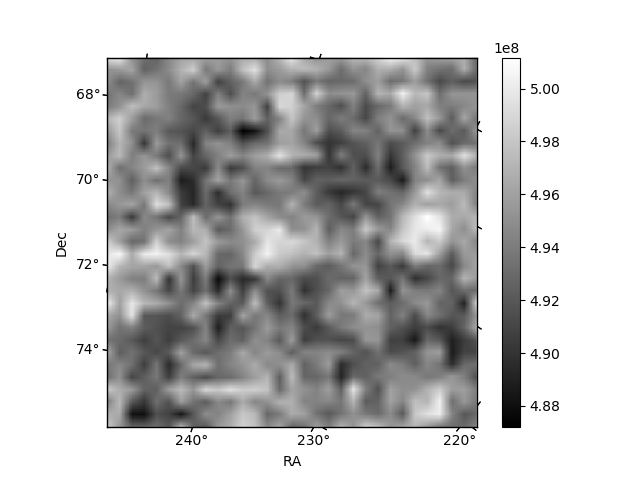
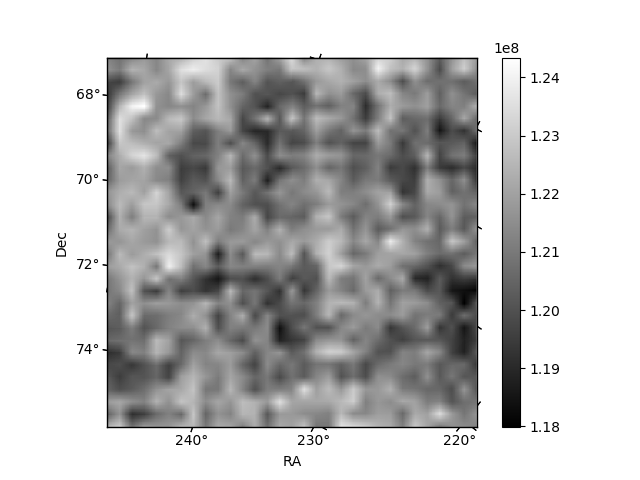
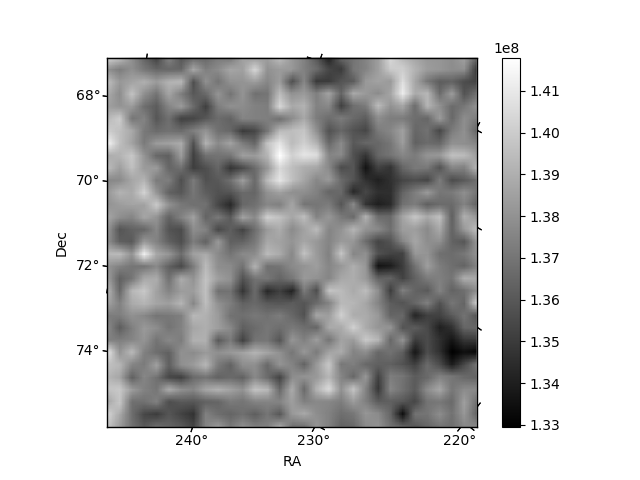
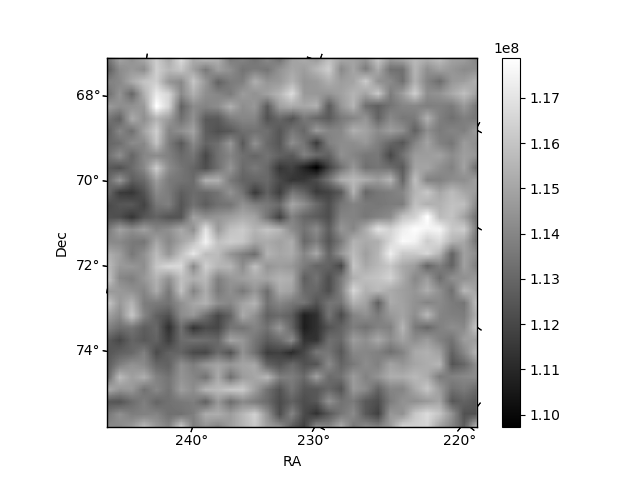
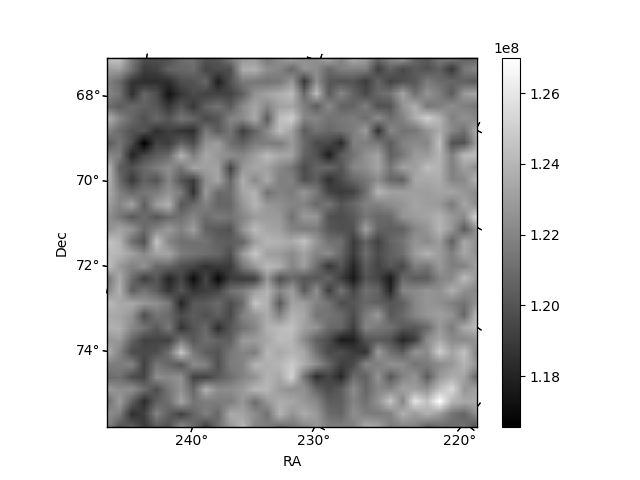
Histogram calculated using DETX and DETY for each event in the final _common_clean file
| Quadrant A | 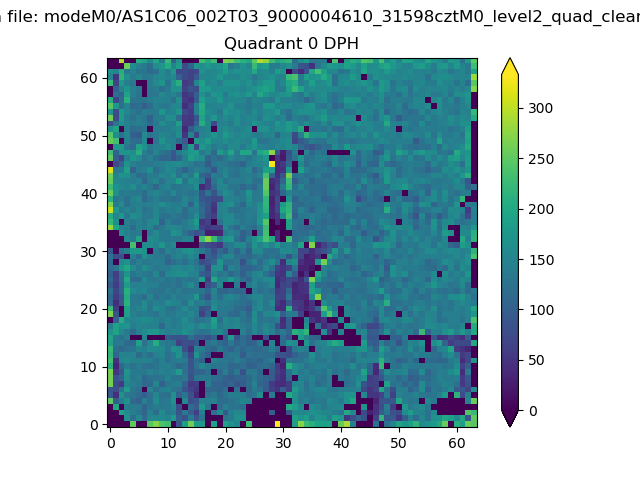 |
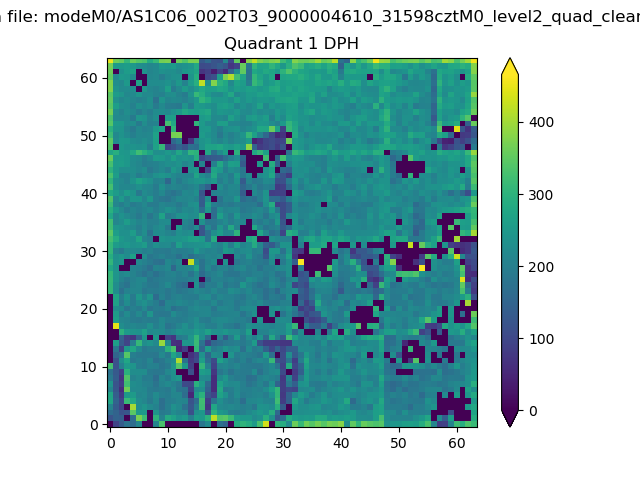 |
Quadrant B |
|---|---|---|---|
| Quadrant D | 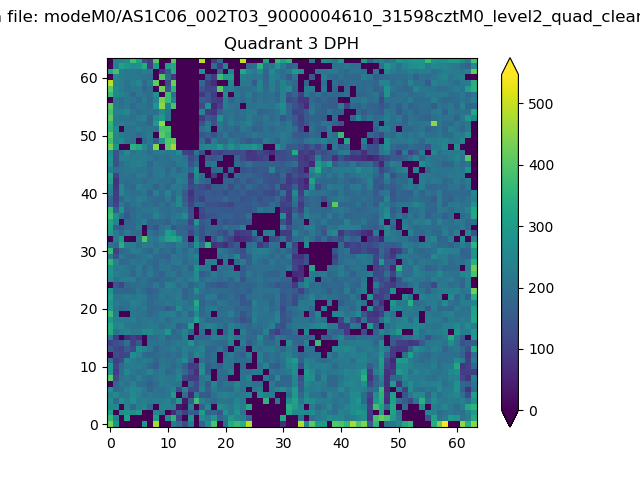 |
 |
Quadrant C |
| Plot type | Count rate plots | Images |
|---|---|---|
| Comparison with Poisson distribution Blue bars denote a histogram of data divided into 1 sec bins. Red curve is a Poisson curve with rate = median count rate of data. |
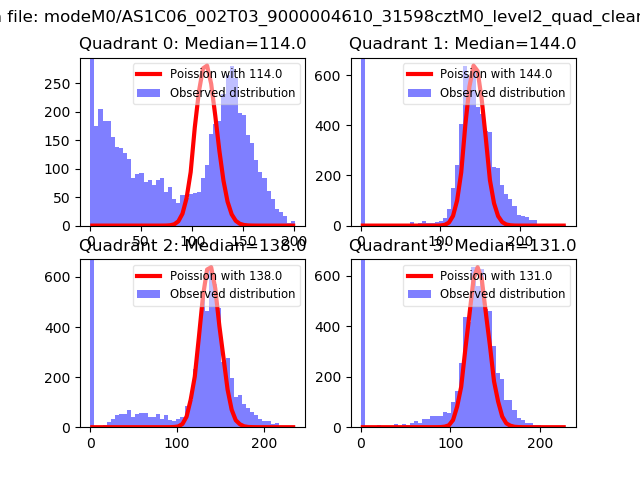 |
 |
| Quadrant-wise count rates Data is divided into 100 sec bins |
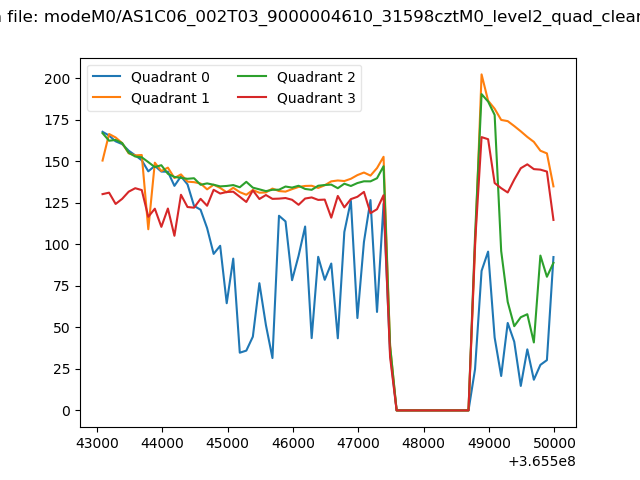 |
|
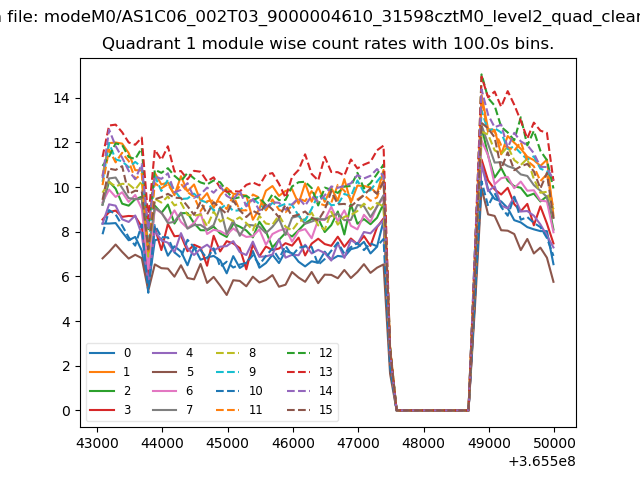
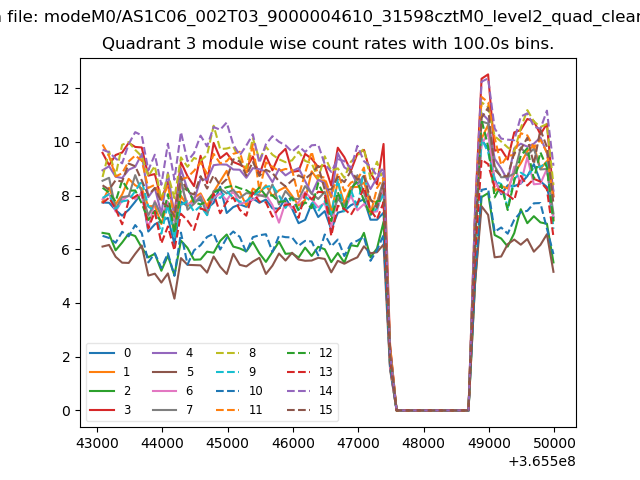
| Module-wise count rates for Quadrant A Data is divided into 100 sec bins |
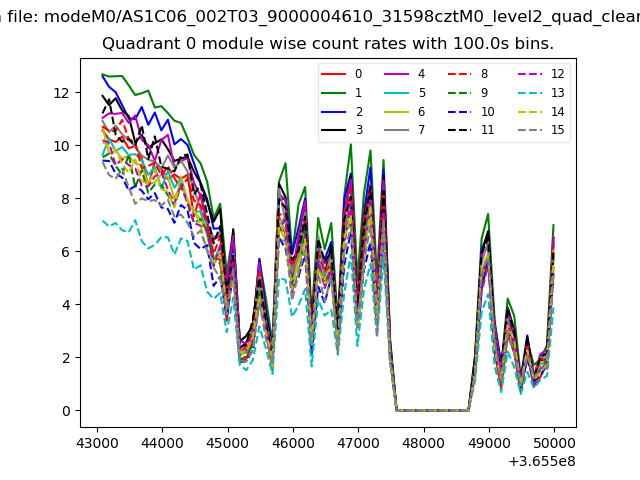 |
 |
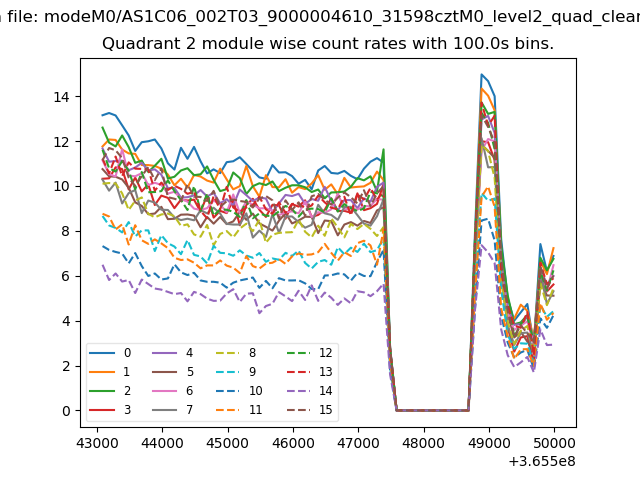
| Module-wise count rates for Quadrant B Data is divided into 100 sec bins |
 |
 |
| Module-wise count rates for Quadrant C Data is divided into 100 sec bins |
 |
 |
| Module-wise count rates for Quadrant D Data is divided into 100 sec bins |
 |
 |
| Parameter | Plot |
|---|---|
| CZT HV Monitor | 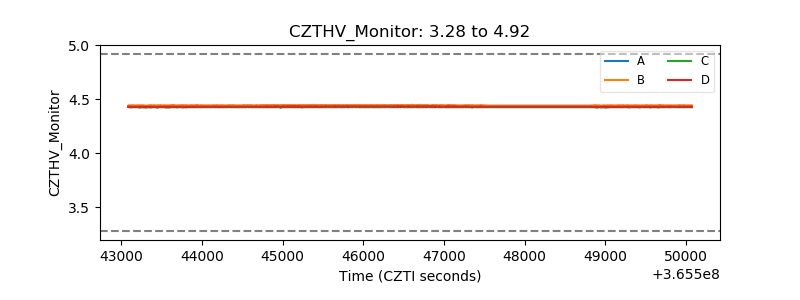 |
| D_VDD | 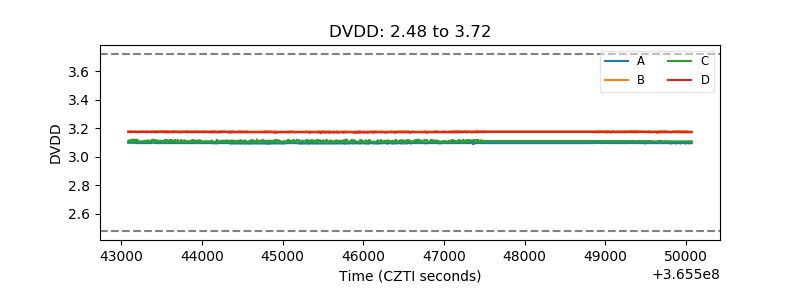 |
| Temperature 1 | 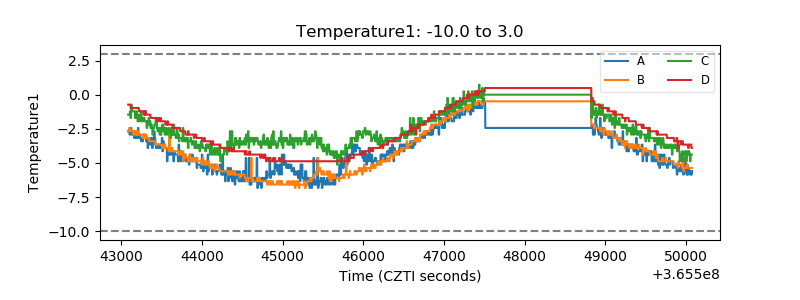 |
| Veto HV Monitor | 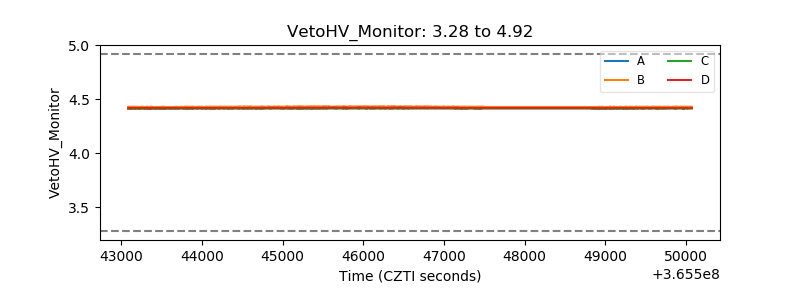 |
| Veto LLD | 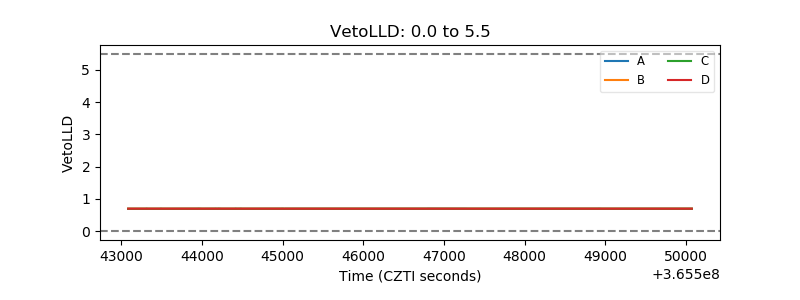 |
| Alpha Counter | 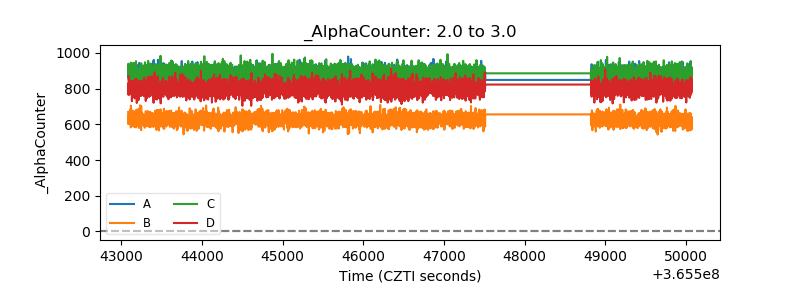 |
| _CPM_Rate | 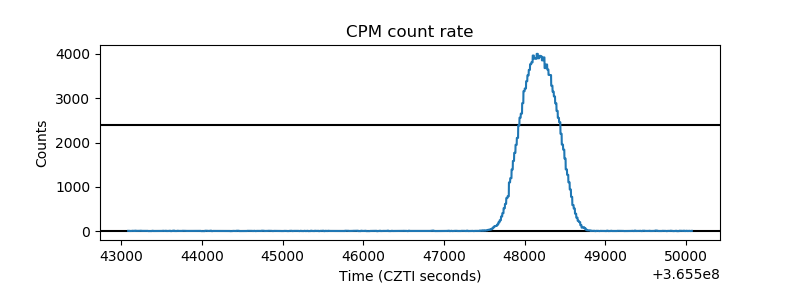 |
| CZT Counter | 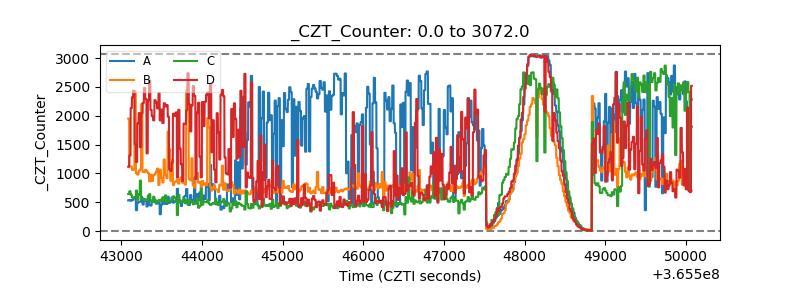 |
| +2.5 Volts monitor |  |
| +5 Volts monitor |  |
| _ROLL_ROT | 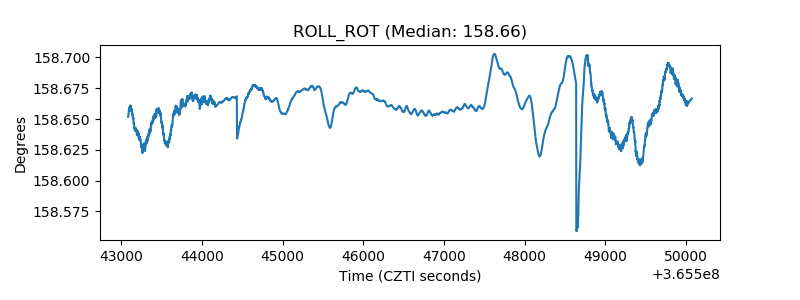 |
| _Roll_DEC | 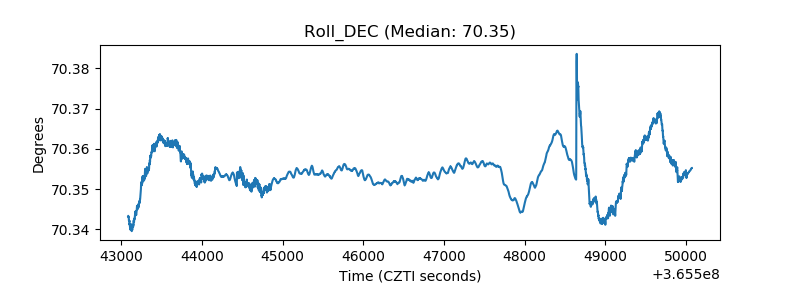 |
| _Roll_RA | 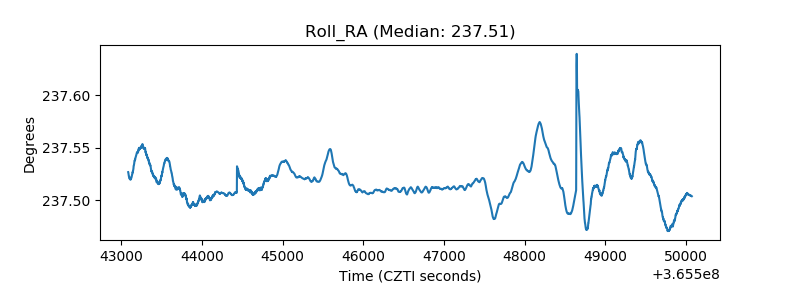 |
| Veto Counter | 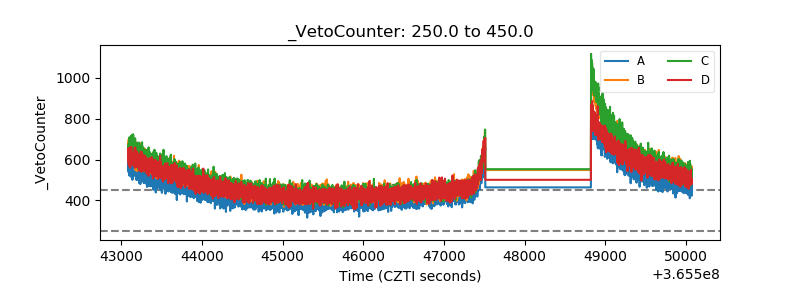 |