| Param | Original file | Final file |
|---|---|---|
| Filename | modeM0/AS1C06_002T03_9000004610_31601cztM0_level2.evt | modeM0/AS1C06_002T03_9000004610_31601cztM0_level2_quad_clean.evt |
| Size (bytes) | 727,666,560 | 123,531,840 |
| Size | 694.0 MB | 117.8 MB |
| Events in quadrant A | 5,218,110 | 804,549 |
| Events in quadrant B | 5,259,601 | 867,753 |
| Events in quadrant C | 3,326,245 | 850,182 |
| Events in quadrant D | 7,798,646 | 768,297 |
| Mode M0 | |||
|---|---|---|---|
| Quadrant | BADHDUFLAG | Total packets | Discarded packets |
| A | 0 | 19880 | 1 |
| B | 0 | 20387 | 1 |
| C | 0 | 14067 | 1 |
| D | 0 | 27870 | 1 |
| Mode SS | |||
|---|---|---|---|
| Quadrant | BADHDUFLAG | Total packets | Discarded packets |
| A | 0 | 132 | 0 |
| B | 0 | 132 | 0 |
| C | 0 | 132 | 0 |
| D | 0 | 132 | 0 |
| Mode M9 | |||
|---|---|---|---|
| Quadrant | BADHDUFLAG | Total packets | Discarded packets |
| A | 0 | 10 | 0 |
| B | 0 | 10 | 0 |
| C | 0 | 10 | 0 |
| D | 0 | 10 | 0 |
| Quadrant | Total seconds | Saturated seconds | Saturation percentage |
|---|---|---|---|
| A | 6444 | 851 | 13.206083% |
| B | 6445 | 198 | 3.072149% |
| C | 6445 | 137 | 2.125679% |
| D | 6445 | 810 | 12.567882% |
Noise dominated data is calculated using 1-second bins in cleaned event files. If a bin has >2000 counts, and if more than 50% of those come from <1% of pixels, then it is considered to be noise-dominated and hence unusable.
| Quadrant | # 1 sec bins | Bins with >0 counts | Bins with >2000 counts | High rate bins dominated by noise | Noise dominated (total time) | Noise dominated (detector-on time) | Marked lightcurve |
|---|---|---|---|---|---|---|---|
| A | 7503 | 6443 | 680 | 680 | 9.06% | 10.55% |  |
| B | 7504 | 6444 | 44 | 44 | 0.59% | 0.68% |  |
| C | 7504 | 6444 | 5 | 5 | 0.07% | 0.08% |  |
| D | 7504 | 6444 | 598 | 598 | 7.97% | 9.28% |  |
Top three noisy pixels from each quadrant. If the there are fewer than three noisy pixels in the level2.evt file, extra rows are filled as -1
| Pixel properties | Quadrant properties | ||||||
|---|---|---|---|---|---|---|---|
| Quadrant | DetID | PixID | Counts | Sigma | Mean | Median | Sigma |
| A | 0 | 13 | 2436993 | 16843.77 | 720 | 707 | 144.6 |
| A | 13 | 254 | 11499 | 74.61 | 720 | 707 | 144.6 |
| A | 3 | 137 | 6904 | 42.84 | 720 | 707 | 144.6 |
| B | 6 | 159 | 1895265 | 13258.17 | 764 | 746 | 142.9 |
| B | 5 | 172 | 148611 | 1034.78 | 764 | 746 | 142.9 |
| B | 4 | 80 | 126006 | 876.59 | 764 | 746 | 142.9 |
| C | 3 | 233 | 251389 | 1442.75 | 741 | 743 | 173.7 |
| C | 14 | 238 | 128054 | 732.82 | 741 | 743 | 173.7 |
| C | 4 | 175 | 30412 | 170.78 | 741 | 743 | 173.7 |
| D | 8 | 195 | 3956976 | 23460.25 | 710 | 692 | 168.6 |
| D | 12 | 2 | 448447 | 2655.13 | 710 | 692 | 168.6 |
| D | 12 | 218 | 349258 | 2066.95 | 710 | 692 | 168.6 |
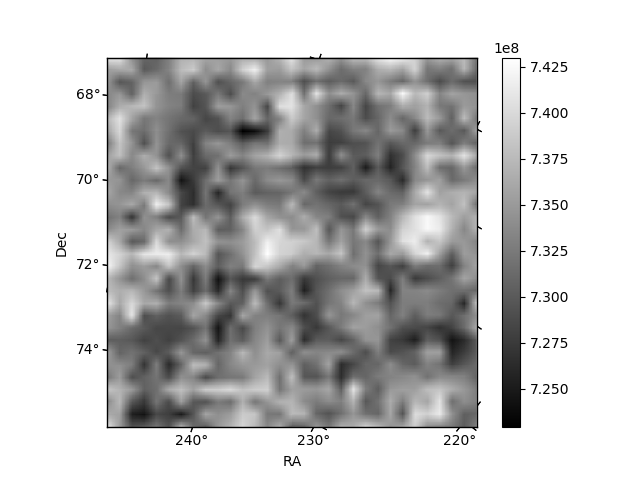
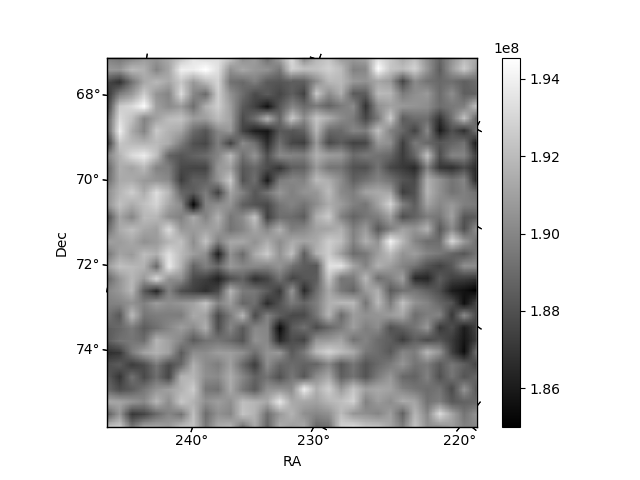
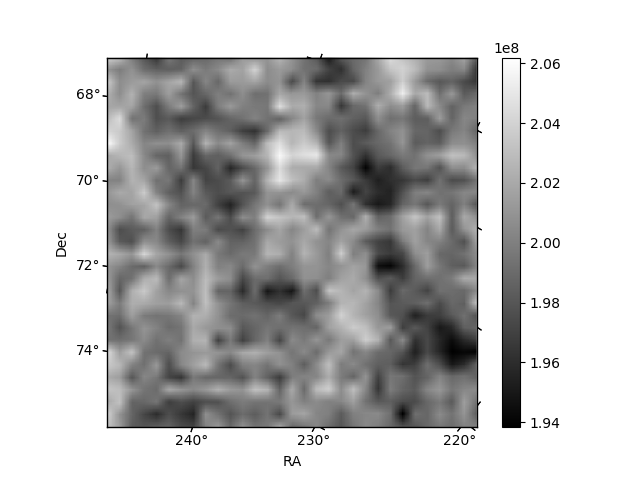
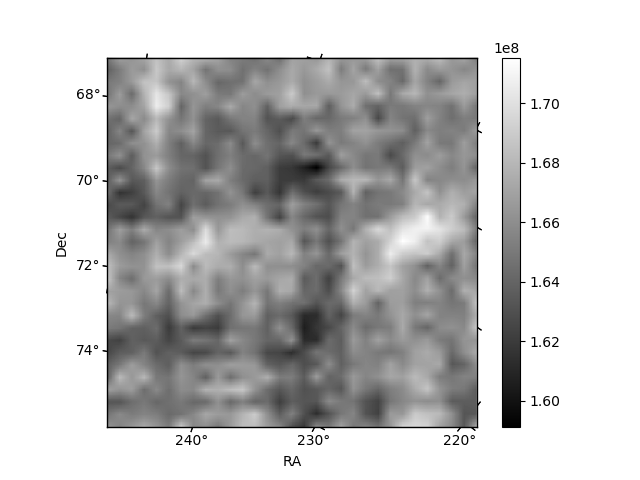
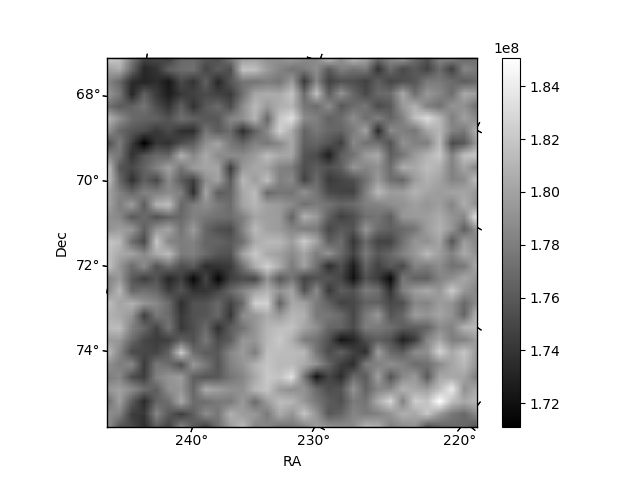
Histogram calculated using DETX and DETY for each event in the final _common_clean file
| Quadrant A | 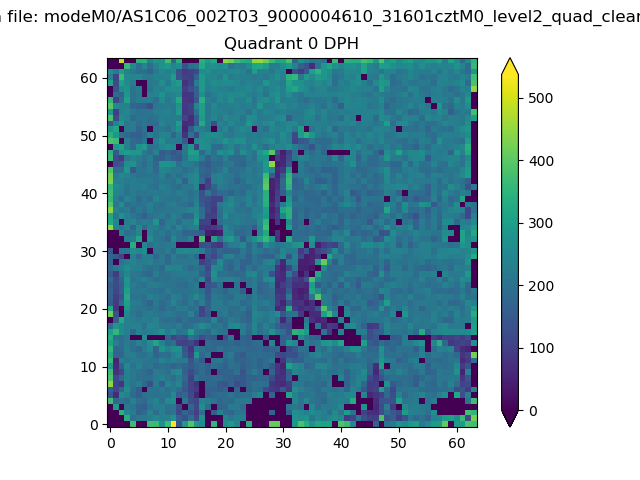 |
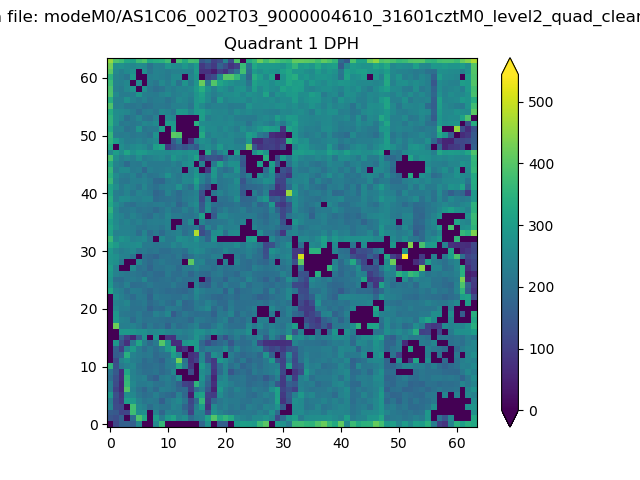 |
Quadrant B |
|---|---|---|---|
| Quadrant D | 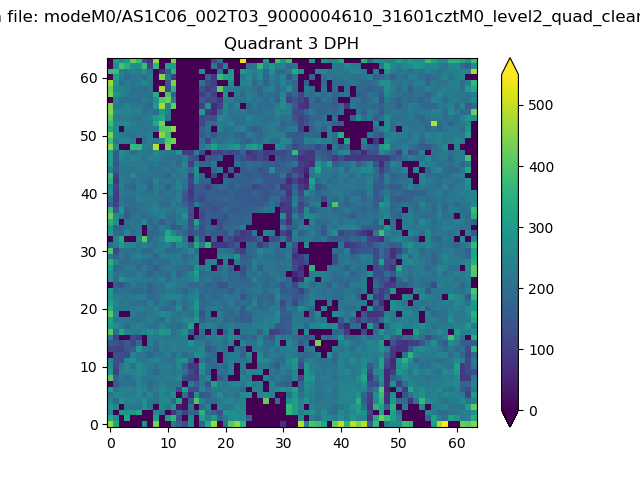 |
 |
Quadrant C |
| Plot type | Count rate plots | Images |
|---|---|---|
| Comparison with Poisson distribution Blue bars denote a histogram of data divided into 1 sec bins. Red curve is a Poisson curve with rate = median count rate of data. |
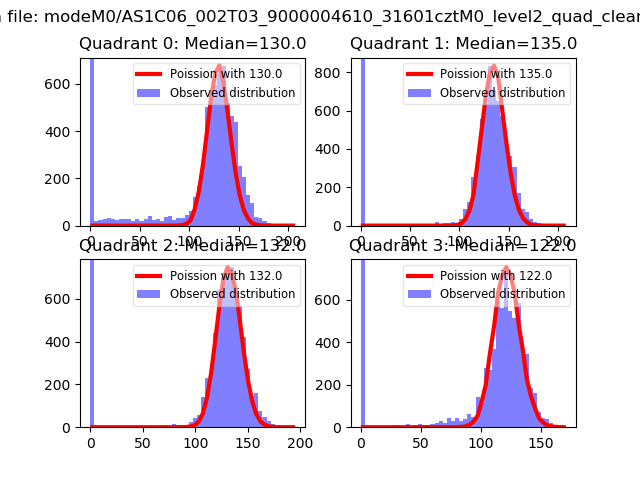 |
 |
| Quadrant-wise count rates Data is divided into 100 sec bins |
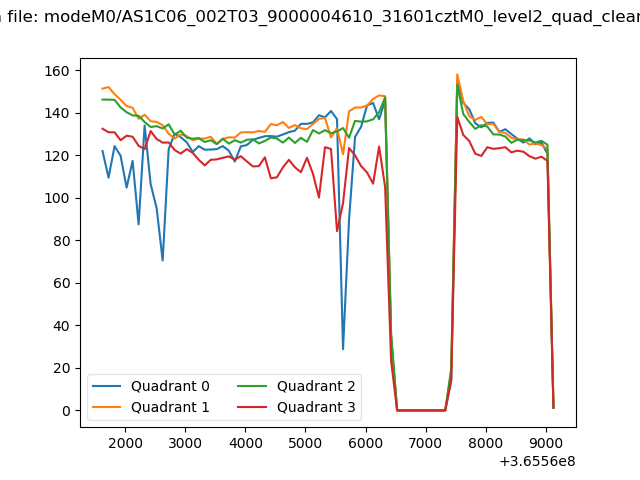 |
|
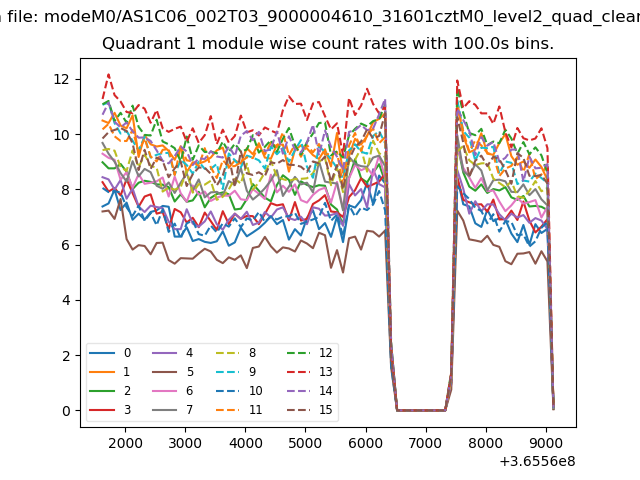
| Module-wise count rates for Quadrant A Data is divided into 100 sec bins |
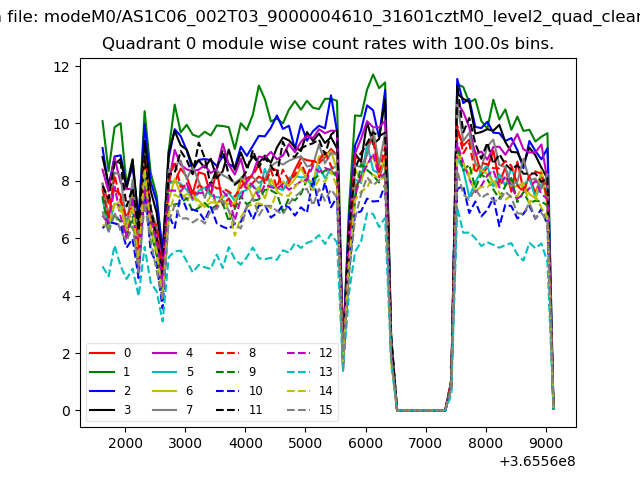 |
 |
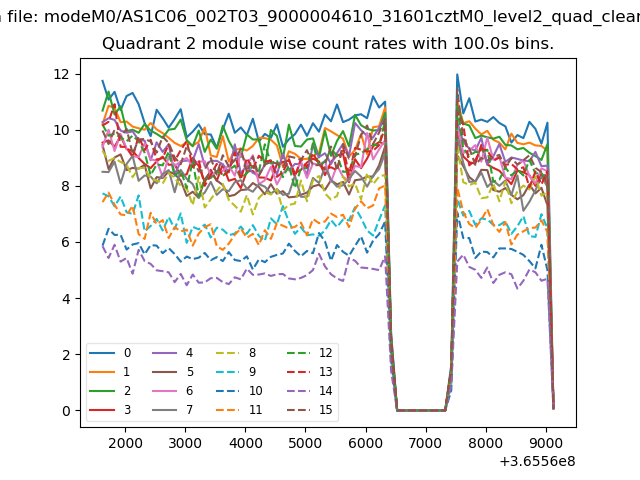
| Module-wise count rates for Quadrant B Data is divided into 100 sec bins |
 |
 |
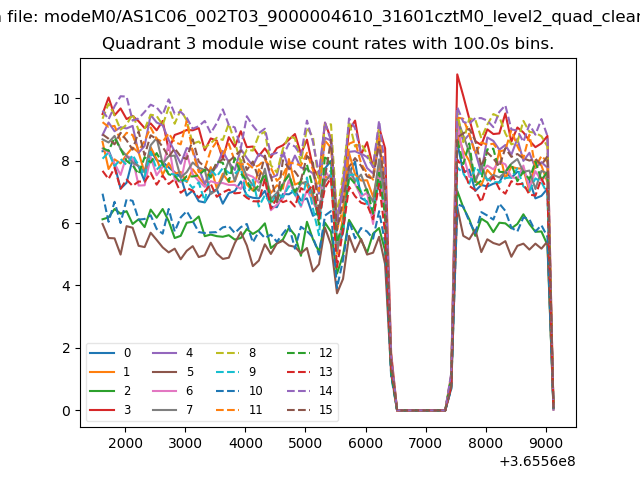
| Module-wise count rates for Quadrant C Data is divided into 100 sec bins |
 |
 |
| Module-wise count rates for Quadrant D Data is divided into 100 sec bins |
 |
 |
| Parameter | Plot |
|---|---|
| CZT HV Monitor |  |
| D_VDD | 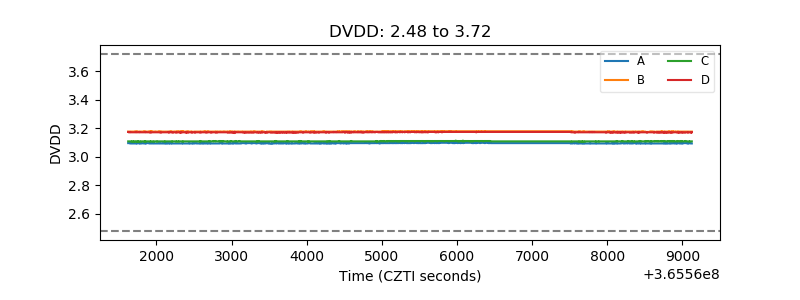 |
| Temperature 1 | 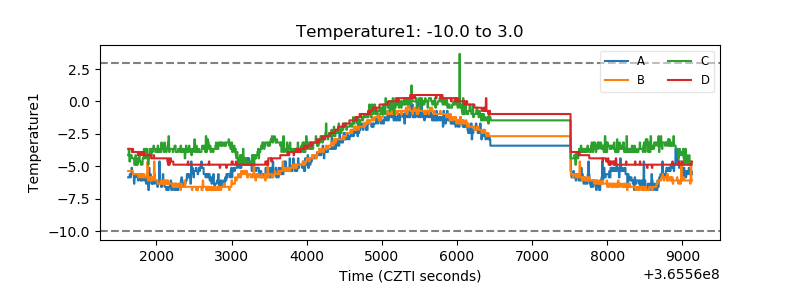 |
| Veto HV Monitor | 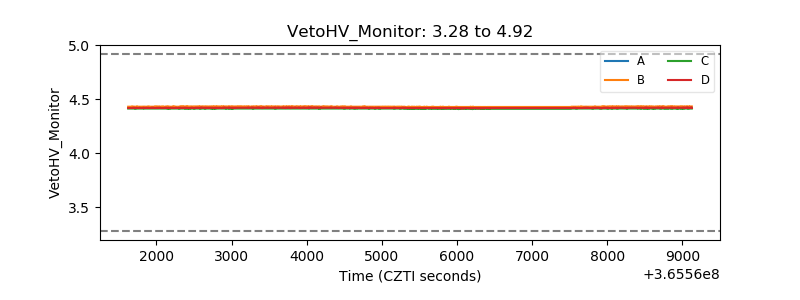 |
| Veto LLD | 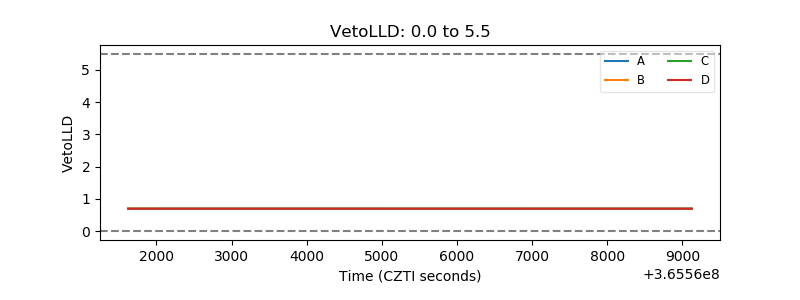 |
| Alpha Counter | 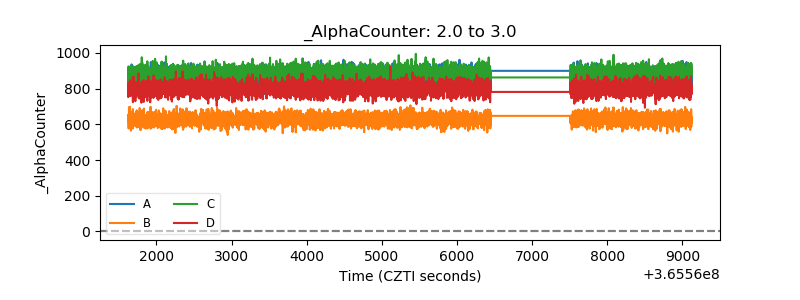 |
| _CPM_Rate | 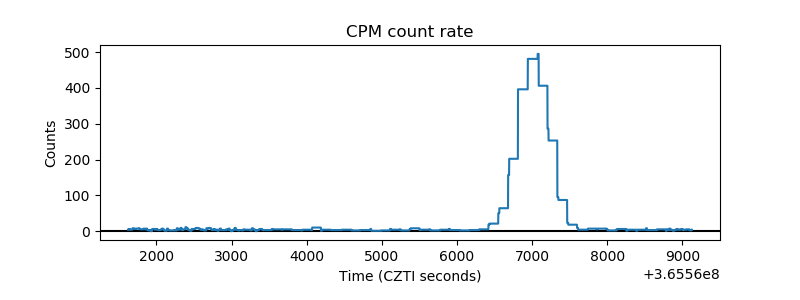 |
| CZT Counter | 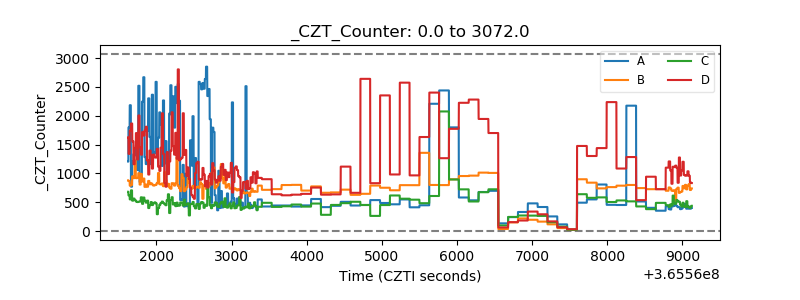 |
| +2.5 Volts monitor |  |
| +5 Volts monitor |  |
| _ROLL_ROT | 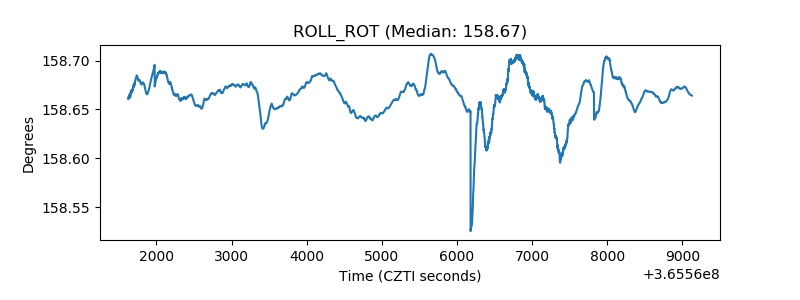 |
| _Roll_DEC |  |
| _Roll_RA | 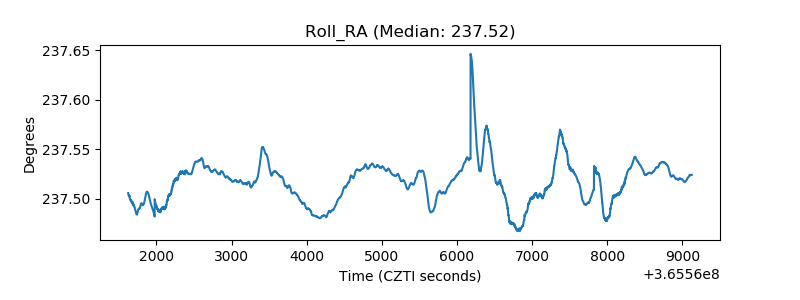 |
| Veto Counter | 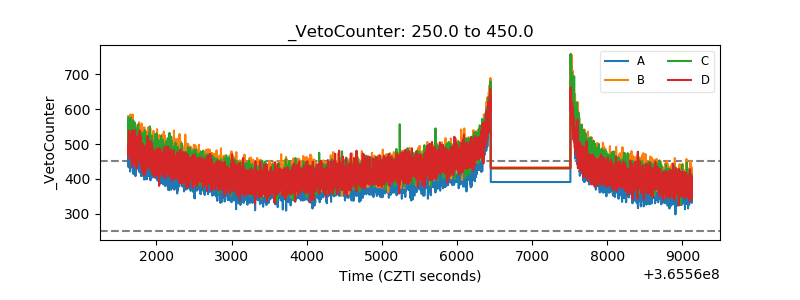 |