| Param | Original file | Final file |
|---|---|---|
| Filename | modeM0/AS1C06_002T03_9000004610_31602cztM0_level2.evt | modeM0/AS1C06_002T03_9000004610_31602cztM0_level2_quad_clean.evt |
| Size (bytes) | 676,379,520 | 121,178,880 |
| Size | 645.0 MB | 115.6 MB |
| Events in quadrant A | 4,026,676 | 804,373 |
| Events in quadrant B | 5,273,247 | 829,571 |
| Events in quadrant C | 3,325,000 | 818,324 |
| Events in quadrant D | 7,420,393 | 763,747 |
| Mode M0 | |||
|---|---|---|---|
| Quadrant | BADHDUFLAG | Total packets | Discarded packets |
| A | 0 | 16642 | 181 |
| B | 0 | 20753 | 360 |
| C | 0 | 14198 | 233 |
| D | 0 | 27059 | 393 |
| Mode SS | |||
|---|---|---|---|
| Quadrant | BADHDUFLAG | Total packets | Discarded packets |
| A | 0 | 136 | 4 |
| B | 0 | 137 | 5 |
| C | 0 | 136 | 4 |
| D | 0 | 136 | 4 |
| Mode M9 | |||
|---|---|---|---|
| Quadrant | BADHDUFLAG | Total packets | Discarded packets |
| A | 0 | 7 | 0 |
| B | 0 | 7 | 0 |
| C | 0 | 7 | 0 |
| D | 0 | 7 | 0 |
| Quadrant | Total seconds | Saturated seconds | Saturation percentage |
|---|---|---|---|
| A | 6520 | 517 | 7.929448% |
| B | 6494 | 223 | 3.433939% |
| C | 6507 | 146 | 2.243738% |
| D | 6500 | 425 | 6.538462% |
Noise dominated data is calculated using 1-second bins in cleaned event files. If a bin has >2000 counts, and if more than 50% of those come from <1% of pixels, then it is considered to be noise-dominated and hence unusable.
| Quadrant | # 1 sec bins | Bins with >0 counts | Bins with >2000 counts | High rate bins dominated by noise | Noise dominated (total time) | Noise dominated (detector-on time) | Marked lightcurve |
|---|---|---|---|---|---|---|---|
| A | 7437 | 6536 | 292 | 292 | 3.93% | 4.47% | 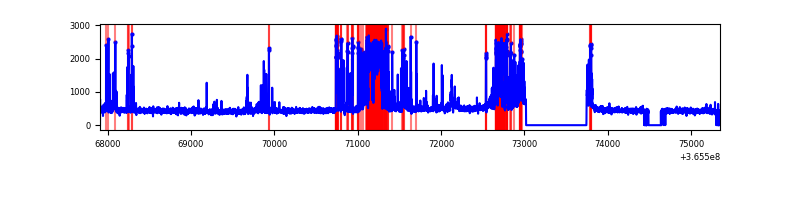 |
| B | 7437 | 6527 | 62 | 62 | 0.83% | 0.95% |  |
| C | 7438 | 6530 | 11 | 11 | 0.15% | 0.17% | 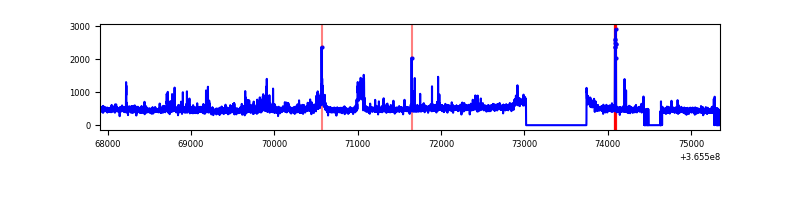 |
| D | 7423 | 6523 | 297 | 297 | 4.00% | 4.55% | 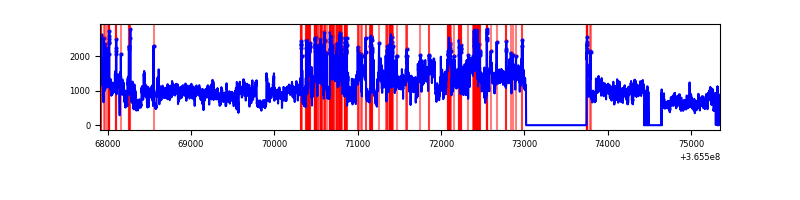 |
Top three noisy pixels from each quadrant. If the there are fewer than three noisy pixels in the level2.evt file, extra rows are filled as -1
| Pixel properties | Quadrant properties | ||||||
|---|---|---|---|---|---|---|---|
| Quadrant | DetID | PixID | Counts | Sigma | Mean | Median | Sigma |
| A | 0 | 13 | 1202295 | 8222.69 | 731 | 714 | 146.1 |
| A | 13 | 254 | 11847 | 76.19 | 731 | 714 | 146.1 |
| A | 3 | 137 | 7308 | 45.12 | 731 | 714 | 146.1 |
| B | 6 | 159 | 1907345 | 13490.4 | 750 | 730 | 141.3 |
| B | 5 | 172 | 170186 | 1199.0 | 750 | 730 | 141.3 |
| B | 4 | 80 | 123619 | 869.51 | 750 | 730 | 141.3 |
| C | 3 | 233 | 181798 | 1051.93 | 734 | 738 | 172.1 |
| C | 14 | 238 | 127543 | 736.72 | 734 | 738 | 172.1 |
| C | 10 | 22 | 45407 | 259.52 | 734 | 738 | 172.1 |
| D | 8 | 195 | 3941190 | 22986.04 | 720 | 701 | 171.4 |
| D | 12 | 2 | 318063 | 1851.27 | 720 | 701 | 171.4 |
| D | 12 | 233 | 102113 | 591.57 | 720 | 701 | 171.4 |
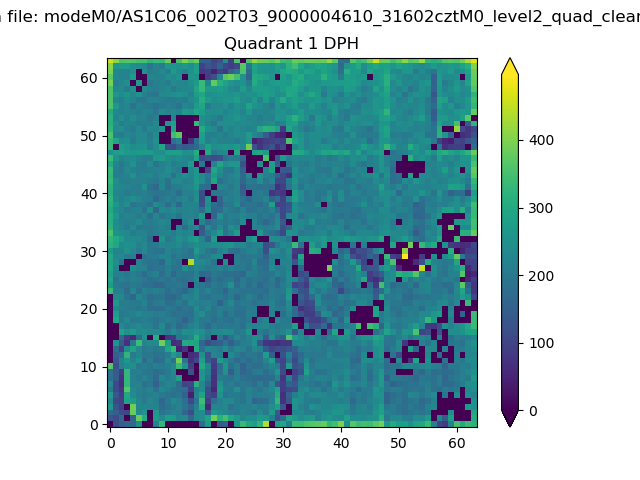
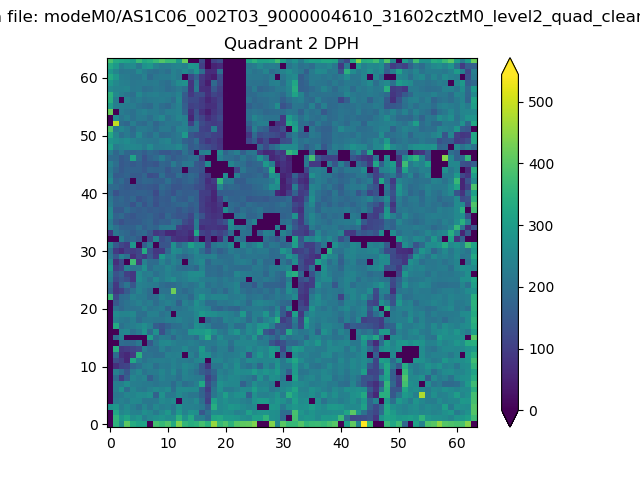
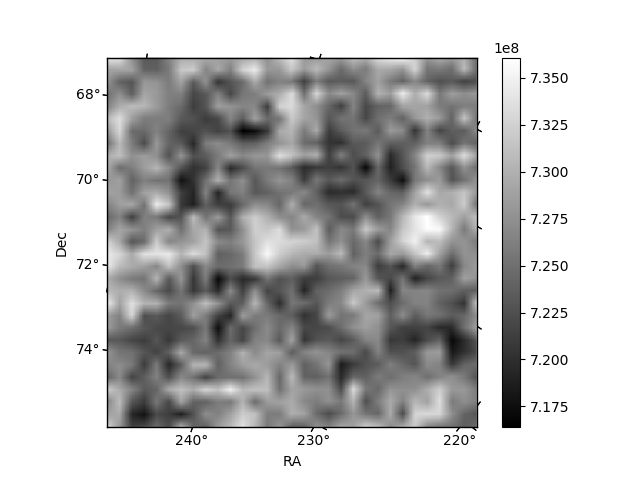
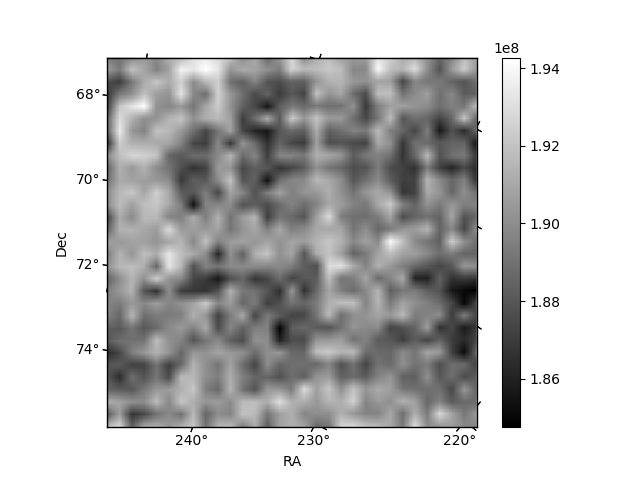
Histogram calculated using DETX and DETY for each event in the final _common_clean file
| Quadrant A | 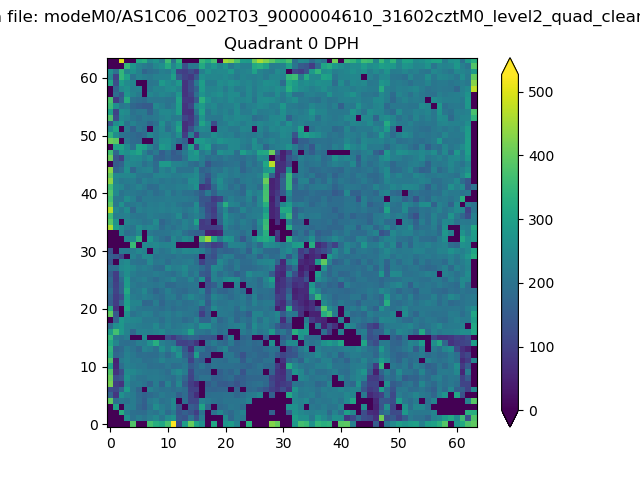 |
 |
Quadrant B |
|---|---|---|---|
| Quadrant D | 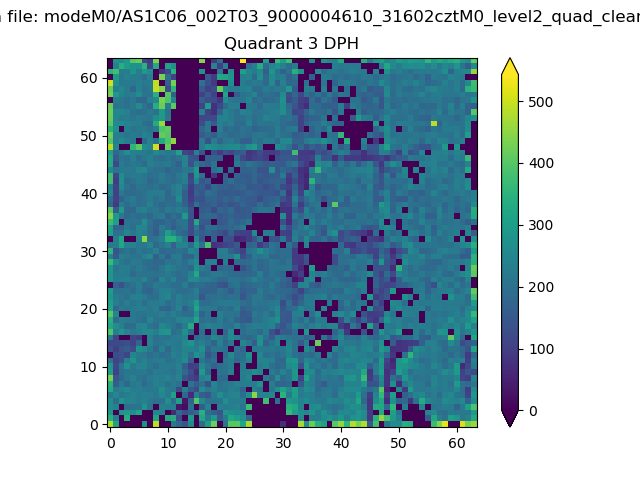 |
 |
Quadrant C |
| Plot type | Count rate plots | Images |
|---|---|---|
| Comparison with Poisson distribution Blue bars denote a histogram of data divided into 1 sec bins. Red curve is a Poisson curve with rate = median count rate of data. |
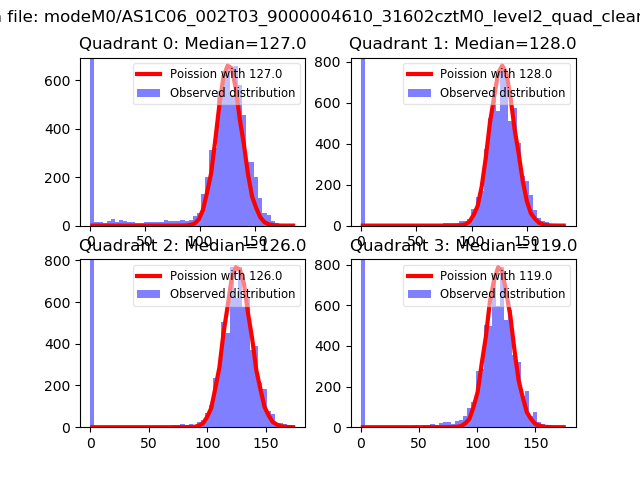 |
 |
| Quadrant-wise count rates Data is divided into 100 sec bins |
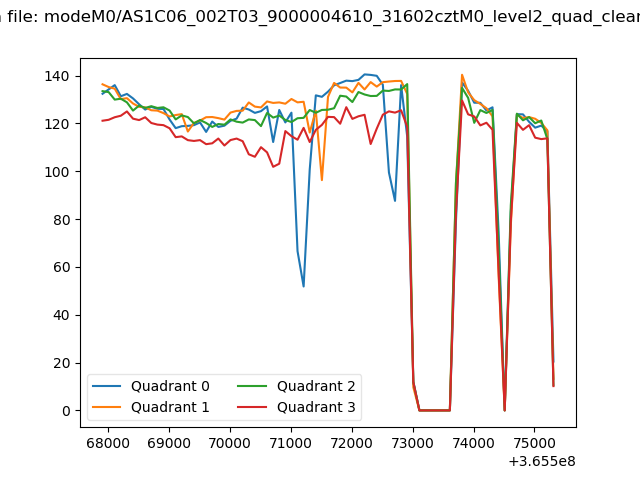 |
|
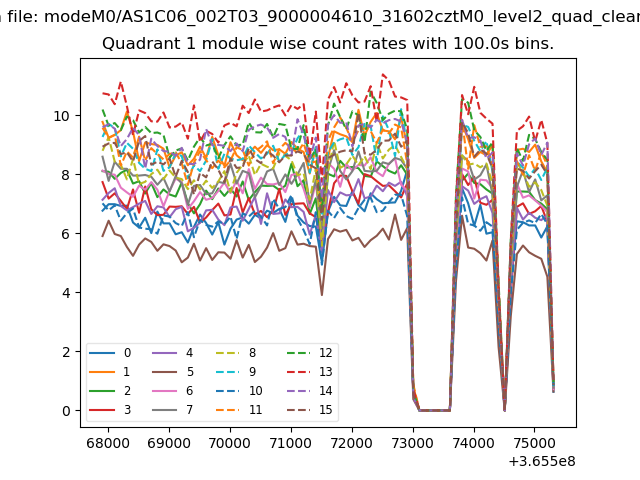
| Module-wise count rates for Quadrant A Data is divided into 100 sec bins |
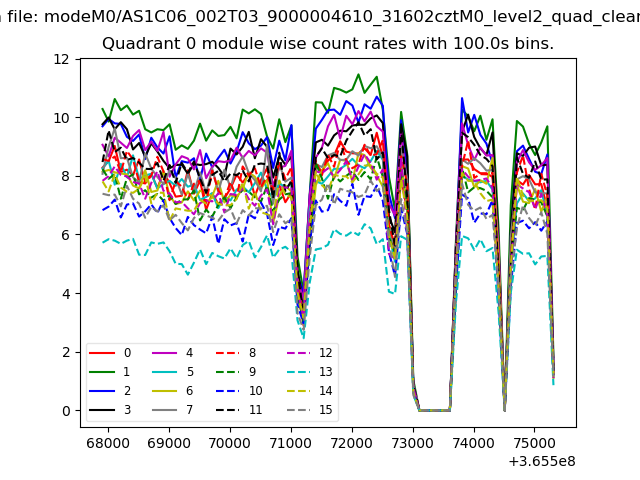 |
 |
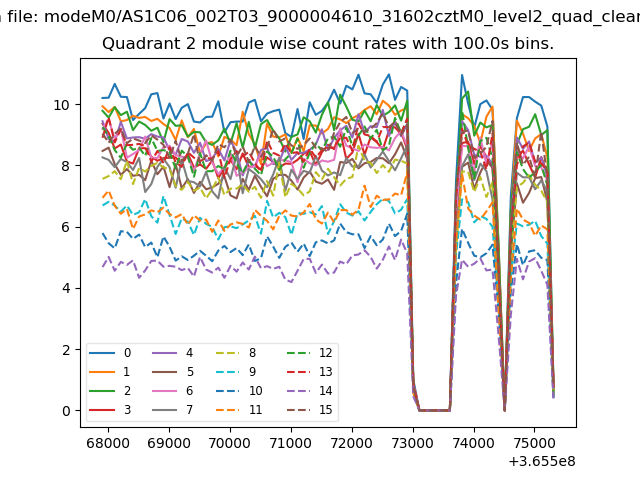
| Module-wise count rates for Quadrant B Data is divided into 100 sec bins |
 |
 |
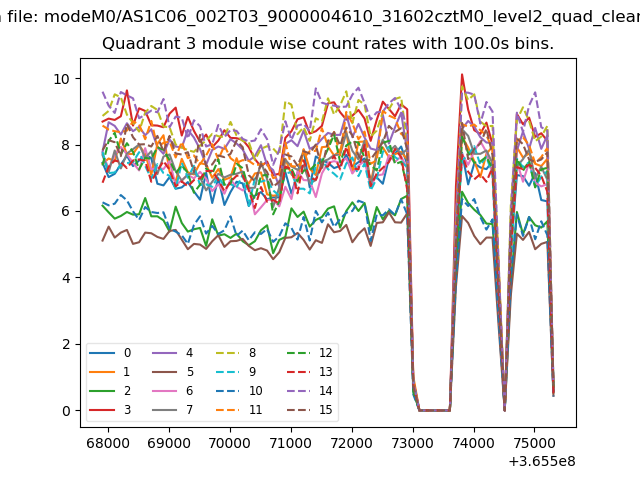
| Module-wise count rates for Quadrant C Data is divided into 100 sec bins |
 |
 |
| Module-wise count rates for Quadrant D Data is divided into 100 sec bins |
 |
 |
| Parameter | Plot |
|---|---|
| CZT HV Monitor | 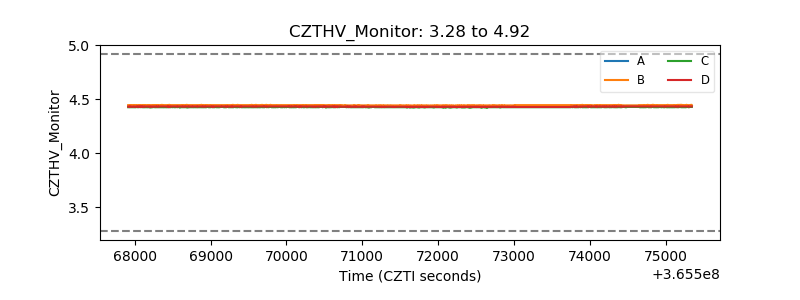 |
| D_VDD | 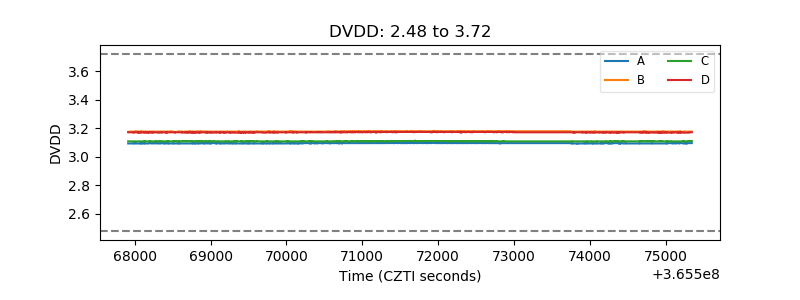 |
| Temperature 1 | 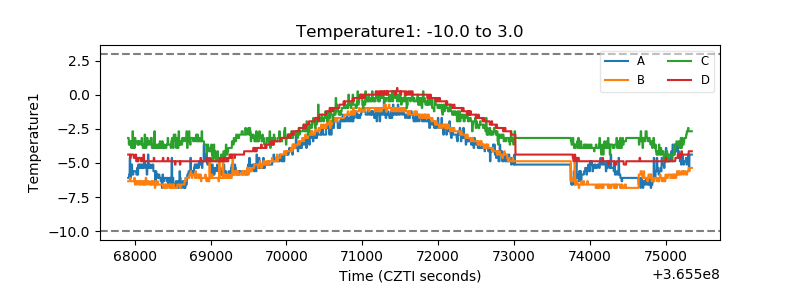 |
| Veto HV Monitor | 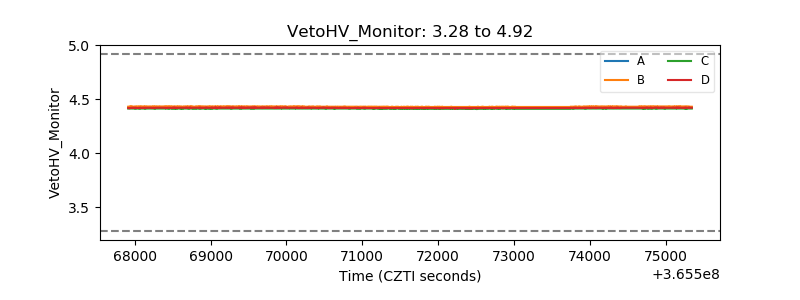 |
| Veto LLD | 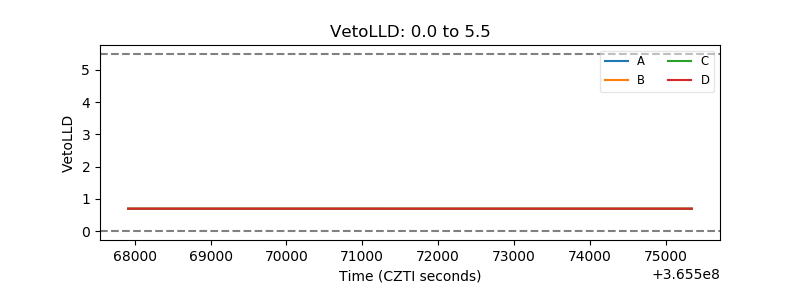 |
| Alpha Counter | 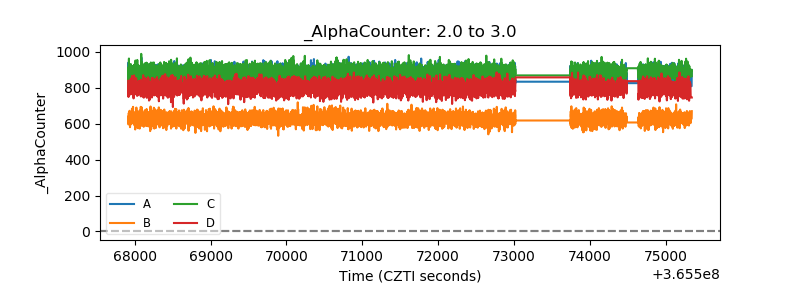 |
| _CPM_Rate | 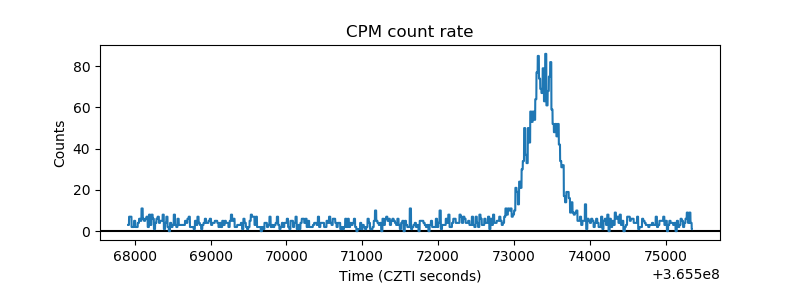 |
| CZT Counter | 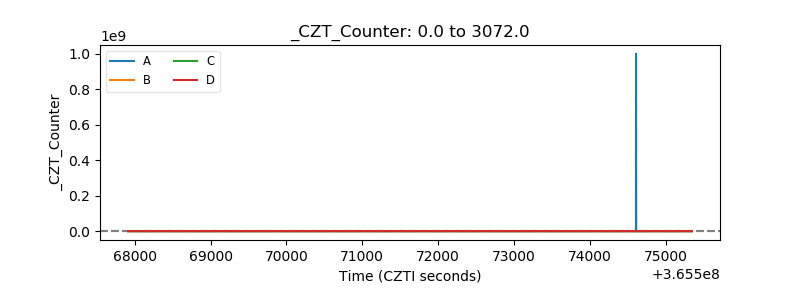 |
| +2.5 Volts monitor |  |
| +5 Volts monitor |  |
| _ROLL_ROT | 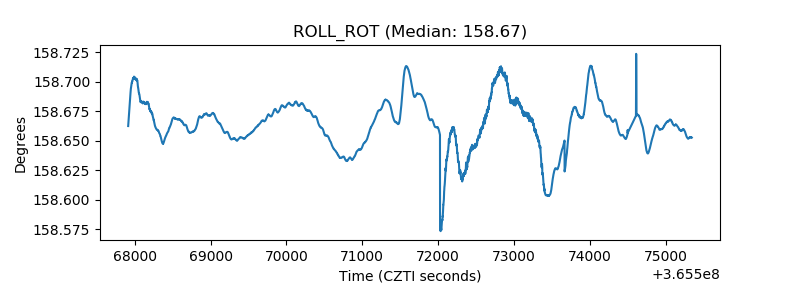 |
| _Roll_DEC | 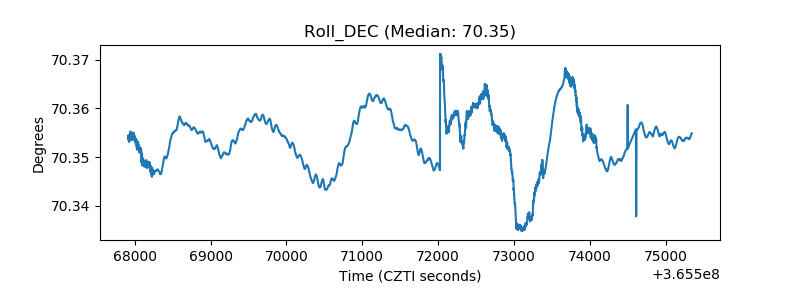 |
| _Roll_RA | 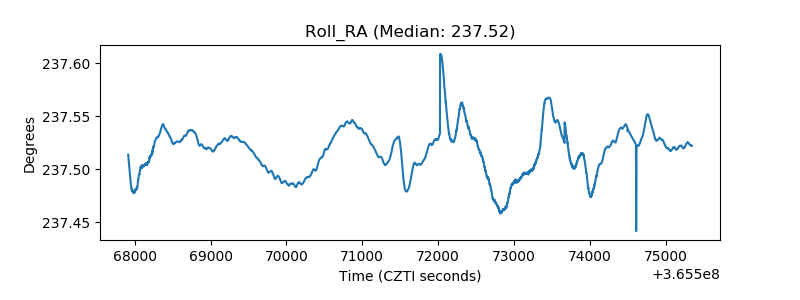 |
| Veto Counter | 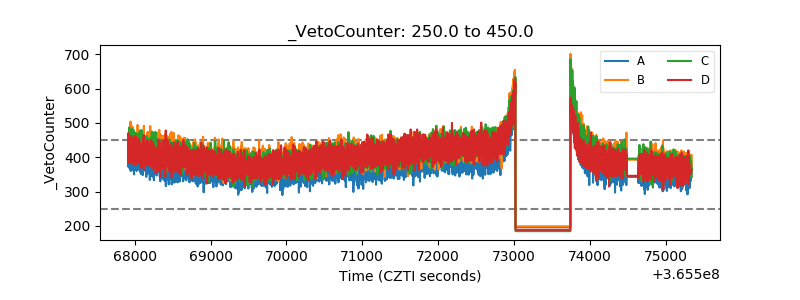 |