| Param | Original file | Final file |
|---|---|---|
| Filename | modeM0/AS1C06_002T03_9000004610_31603cztM0_level2.evt | modeM0/AS1C06_002T03_9000004610_31603cztM0_level2_quad_clean.evt |
| Size (bytes) | 797,195,520 | 124,882,560 |
| Size | 760.3 MB | 119.1 MB |
| Events in quadrant A | 5,836,079 | 795,825 |
| Events in quadrant B | 5,580,800 | 889,927 |
| Events in quadrant C | 3,731,812 | 874,124 |
| Events in quadrant D | 8,515,363 | 726,945 |
| Mode M0 | |||
|---|---|---|---|
| Quadrant | BADHDUFLAG | Total packets | Discarded packets |
| A | 0 | 22263 | 12 |
| B | 0 | 21837 | 14 |
| C | 0 | 15726 | 6 |
| D | 0 | 30352 | 59 |
| Mode SS | |||
|---|---|---|---|
| Quadrant | BADHDUFLAG | Total packets | Discarded packets |
| A | 0 | 144 | 0 |
| B | 0 | 143 | 0 |
| C | 0 | 144 | 0 |
| D | 0 | 144 | 0 |
| Mode M9 | |||
|---|---|---|---|
| Quadrant | BADHDUFLAG | Total packets | Discarded packets |
| A | 0 | 2 | 0 |
| B | 0 | 2 | 0 |
| C | 0 | 2 | 0 |
| D | 0 | 2 | 0 |
| Quadrant | Total seconds | Saturated seconds | Saturation percentage |
|---|---|---|---|
| A | 7098 | 1372 | 19.329389% |
| B | 7100 | 301 | 4.239437% |
| C | 7102 | 243 | 3.421571% |
| D | 7086 | 1588 | 22.410387% |
Noise dominated data is calculated using 1-second bins in cleaned event files. If a bin has >2000 counts, and if more than 50% of those come from <1% of pixels, then it is considered to be noise-dominated and hence unusable.
| Quadrant | # 1 sec bins | Bins with >0 counts | Bins with >2000 counts | High rate bins dominated by noise | Noise dominated (total time) | Noise dominated (detector-on time) | Marked lightcurve |
|---|---|---|---|---|---|---|---|
| A | 7311 | 7103 | 857 | 857 | 11.72% | 12.07% | 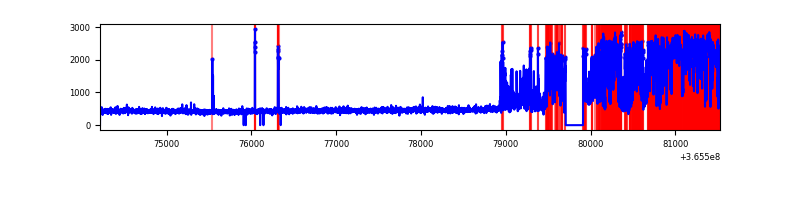 |
| B | 7310 | 7104 | 24 | 24 | 0.33% | 0.34% | 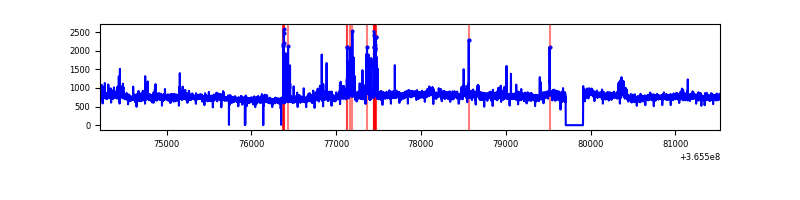 |
| C | 7311 | 7103 | 22 | 22 | 0.30% | 0.31% | 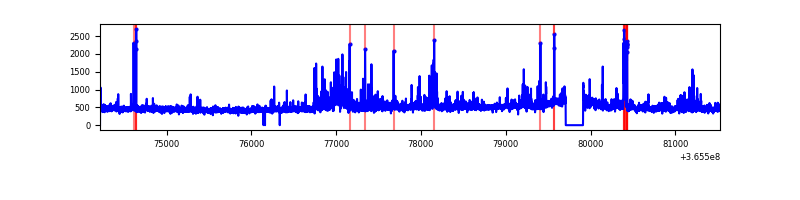 |
| D | 7312 | 7098 | 1130 | 1130 | 15.45% | 15.92% | 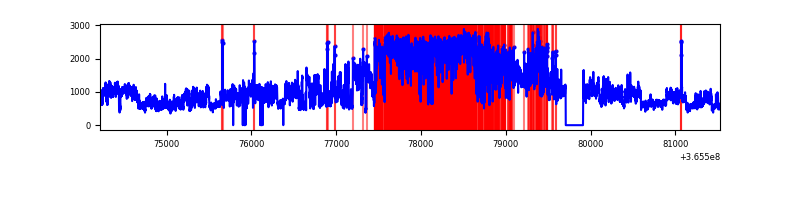 |
Top three noisy pixels from each quadrant. If the there are fewer than three noisy pixels in the level2.evt file, extra rows are filled as -1
| Pixel properties | Quadrant properties | ||||||
|---|---|---|---|---|---|---|---|
| Quadrant | DetID | PixID | Counts | Sigma | Mean | Median | Sigma |
| A | 0 | 13 | 2919771 | 19496.33 | 745 | 730 | 149.7 |
| A | 15 | 174 | 38530 | 252.47 | 745 | 730 | 149.7 |
| A | 13 | 254 | 12347 | 77.59 | 745 | 730 | 149.7 |
| B | 6 | 159 | 2027269 | 13005.65 | 821 | 799 | 155.8 |
| B | 5 | 172 | 116168 | 740.43 | 821 | 799 | 155.8 |
| B | 4 | 80 | 97423 | 620.12 | 821 | 799 | 155.8 |
| C | 3 | 233 | 361029 | 1917.07 | 799 | 802 | 187.9 |
| C | 14 | 238 | 138413 | 732.34 | 799 | 802 | 187.9 |
| C | 14 | 225 | 58583 | 307.5 | 799 | 802 | 187.9 |
| D | 8 | 195 | 2836506 | 16880.64 | 704 | 684 | 168.0 |
| D | 12 | 2 | 2706095 | 16104.35 | 704 | 684 | 168.0 |
| D | 13 | 249 | 160318 | 950.24 | 704 | 684 | 168.0 |
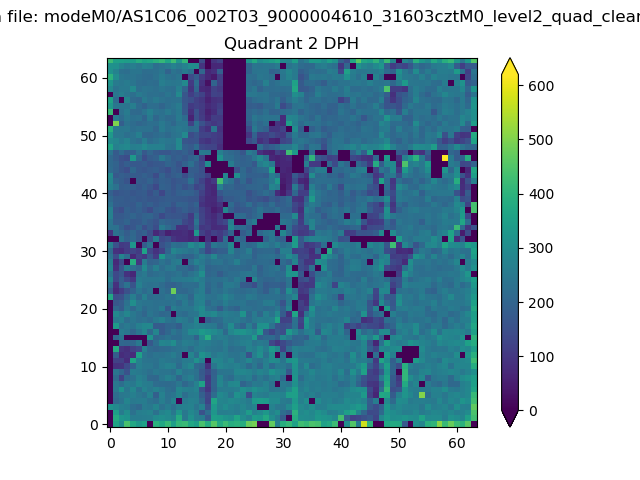
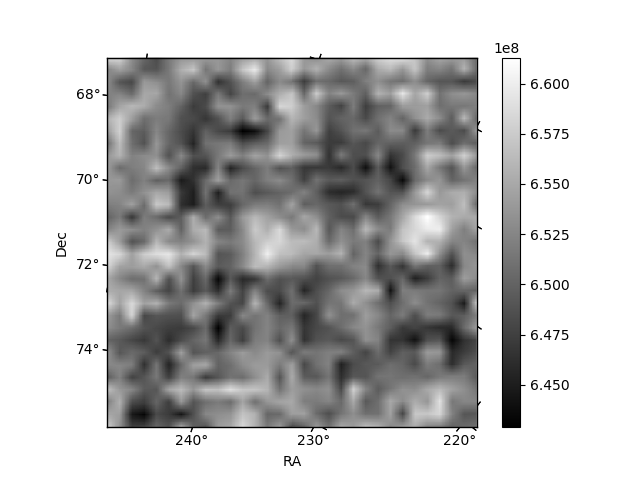
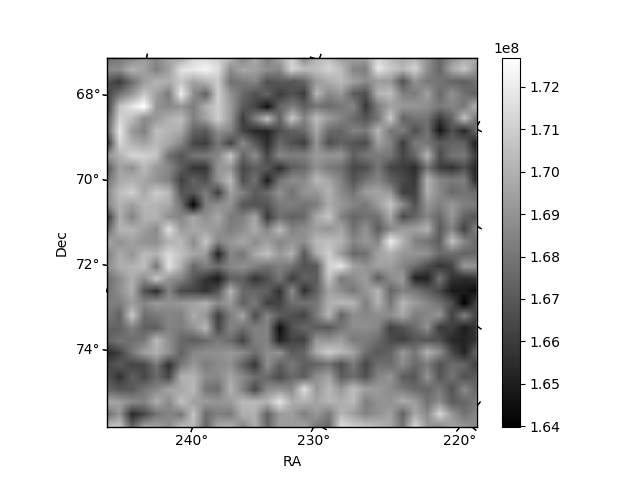
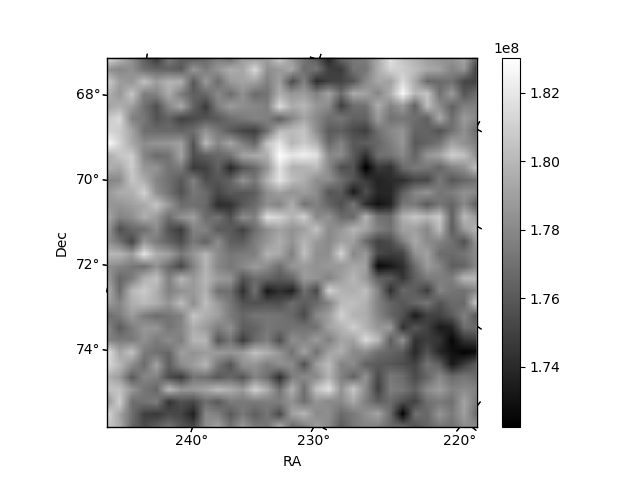
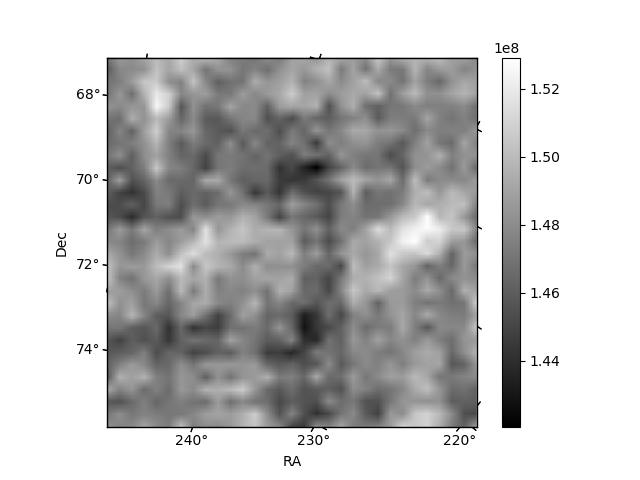
Histogram calculated using DETX and DETY for each event in the final _common_clean file
| Quadrant A | 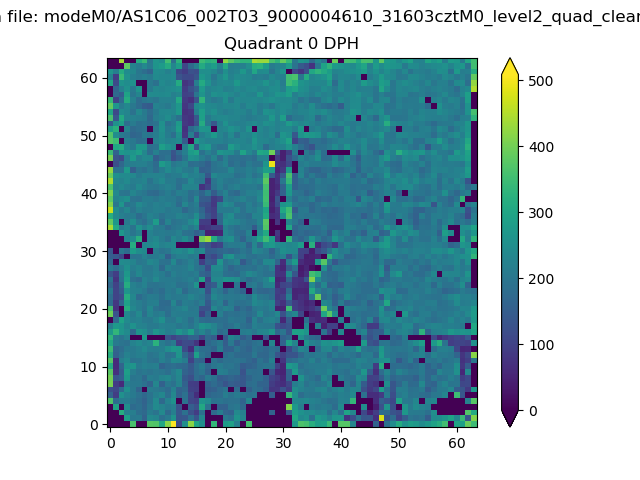 |
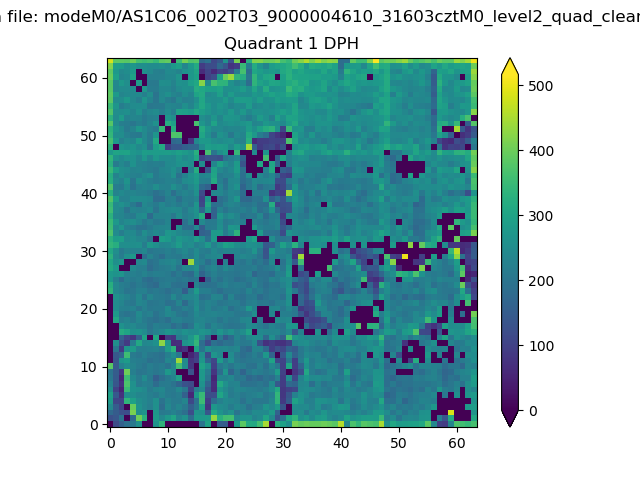 |
Quadrant B |
|---|---|---|---|
| Quadrant D | 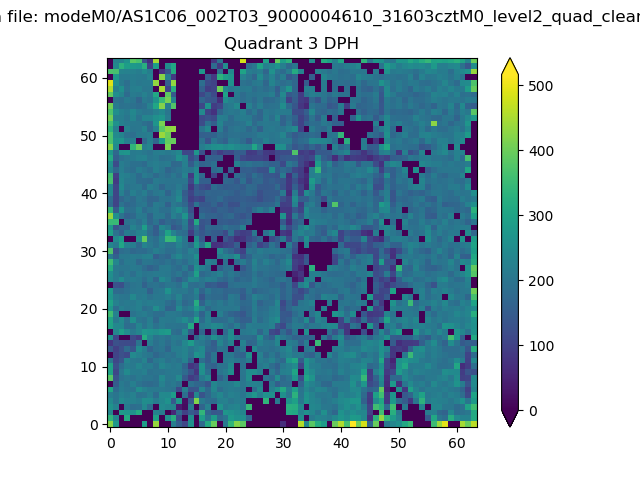 |
 |
Quadrant C |
| Plot type | Count rate plots | Images |
|---|---|---|
| Comparison with Poisson distribution Blue bars denote a histogram of data divided into 1 sec bins. Red curve is a Poisson curve with rate = median count rate of data. |
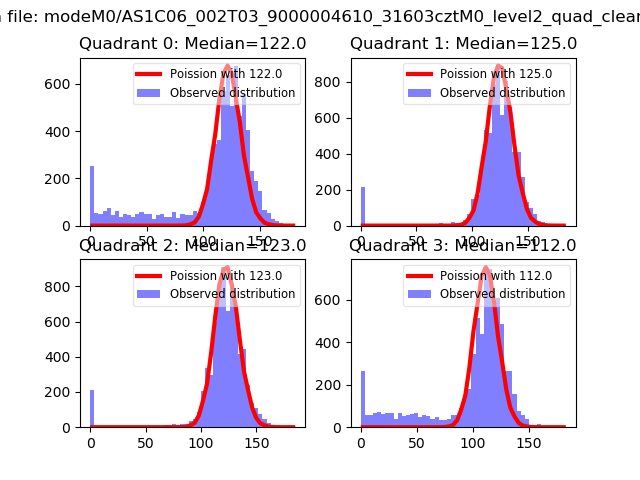 |
 |
| Quadrant-wise count rates Data is divided into 100 sec bins |
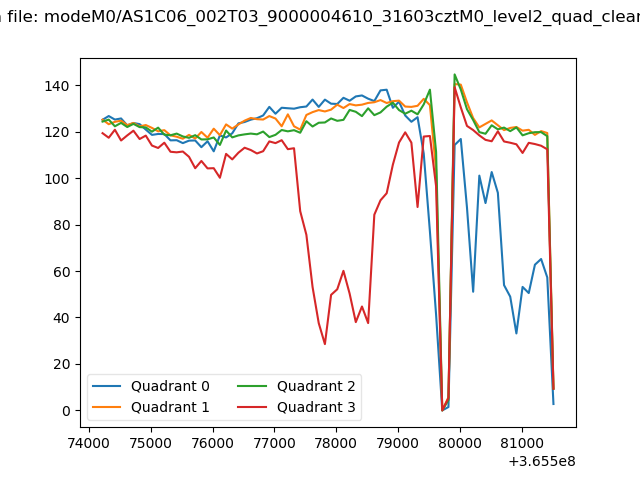 |
|
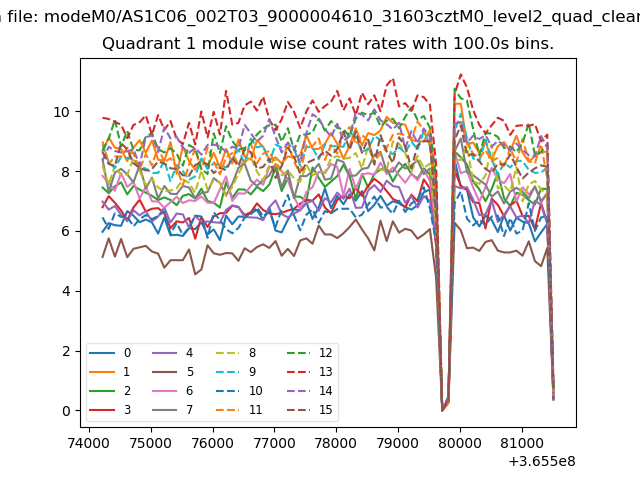
| Module-wise count rates for Quadrant A Data is divided into 100 sec bins |
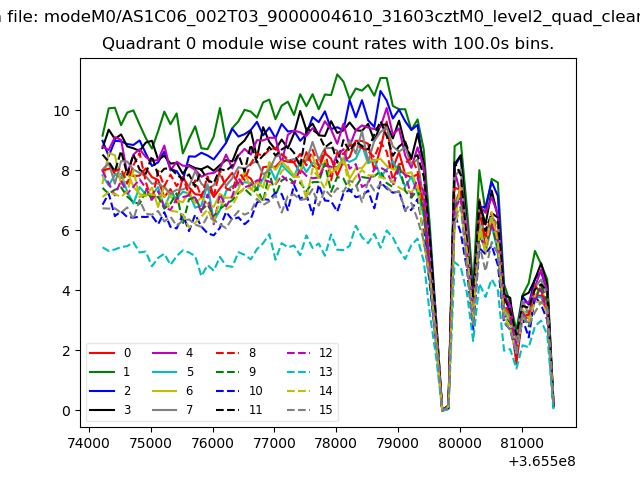 |
 |
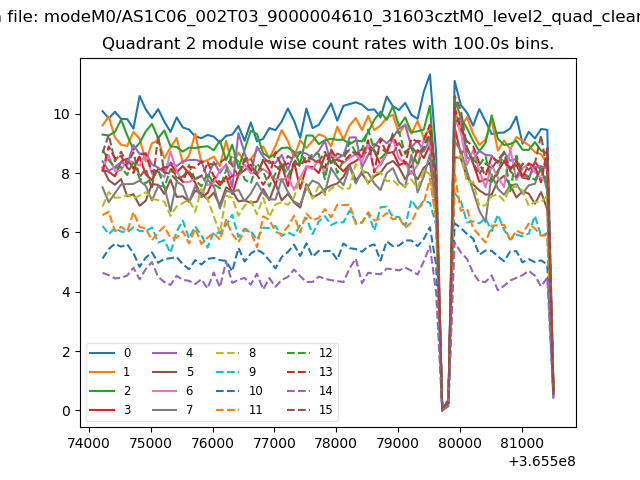
| Module-wise count rates for Quadrant B Data is divided into 100 sec bins |
 |
 |
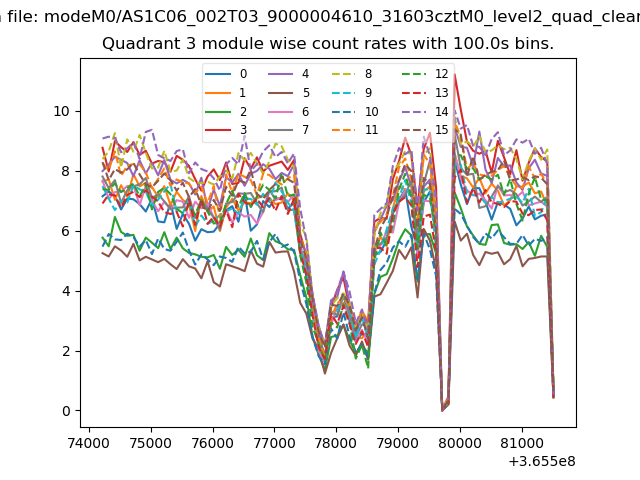
| Module-wise count rates for Quadrant C Data is divided into 100 sec bins |
 |
 |
| Module-wise count rates for Quadrant D Data is divided into 100 sec bins |
 |
 |
| Parameter | Plot |
|---|---|
| CZT HV Monitor | 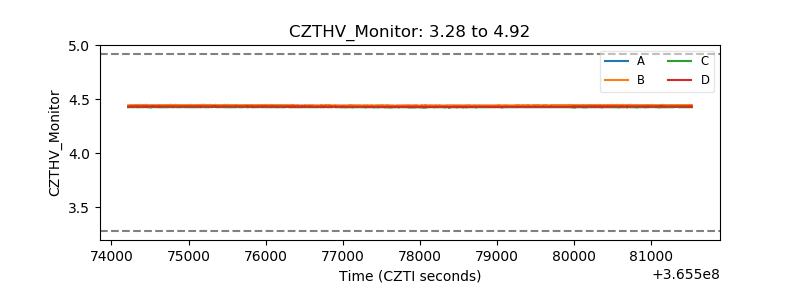 |
| D_VDD | 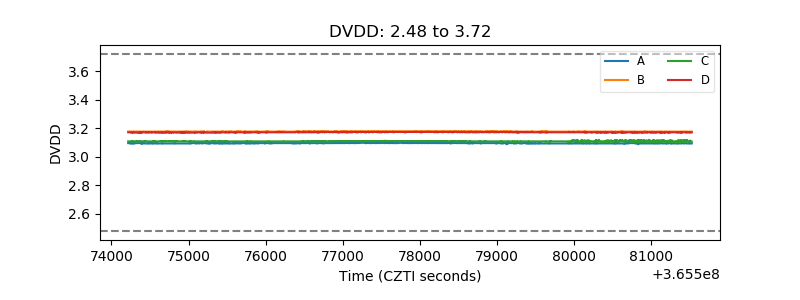 |
| Temperature 1 | 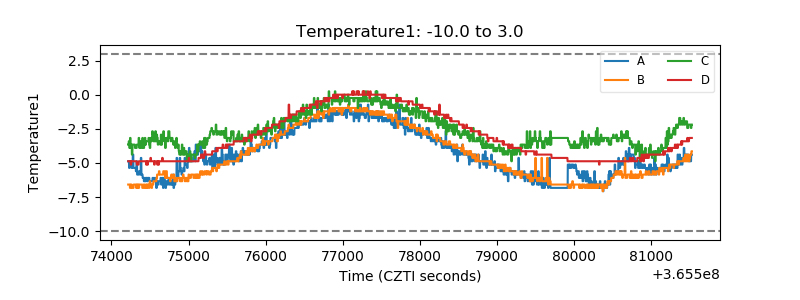 |
| Veto HV Monitor | 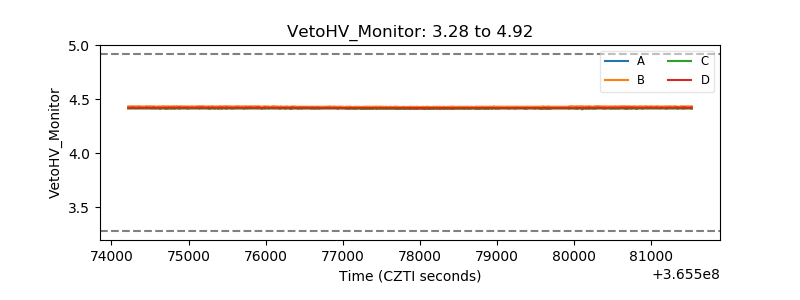 |
| Veto LLD |  |
| Alpha Counter | 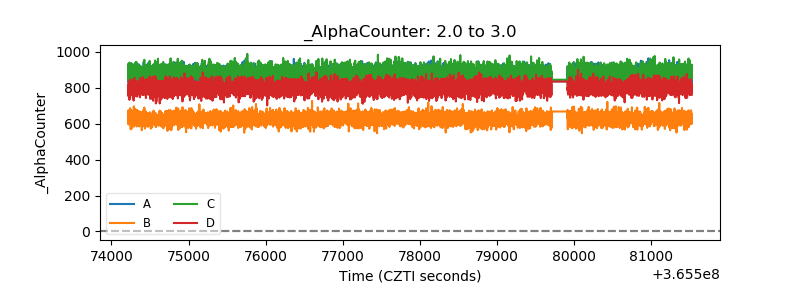 |
| _CPM_Rate | 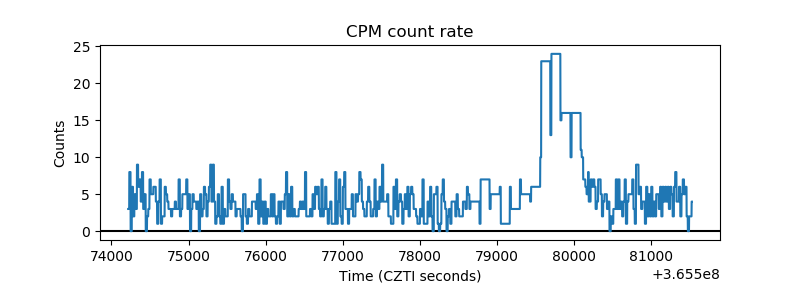 |
| CZT Counter | 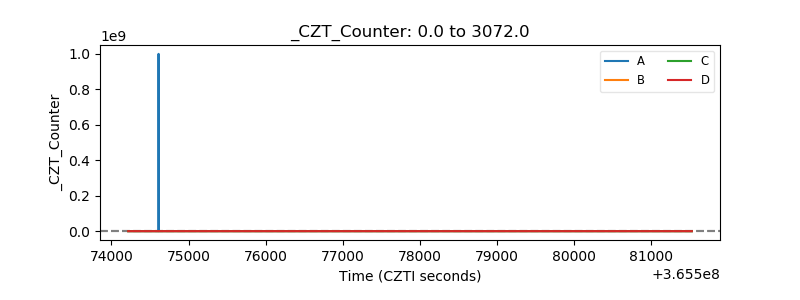 |
| +2.5 Volts monitor |  |
| +5 Volts monitor | 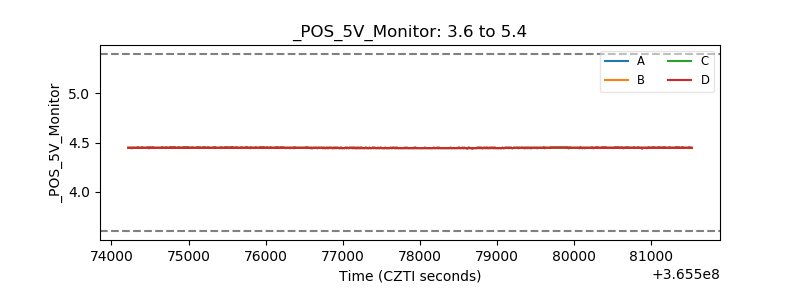 |
| _ROLL_ROT | 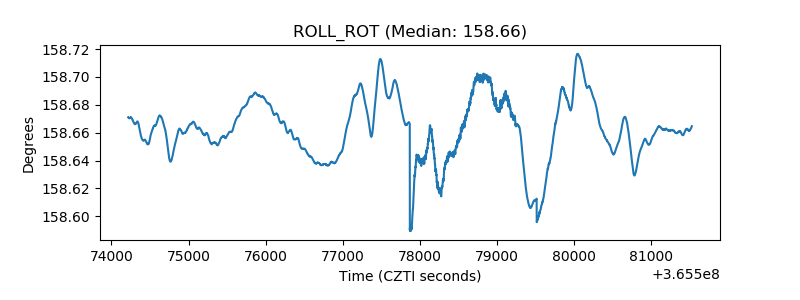 |
| _Roll_DEC | 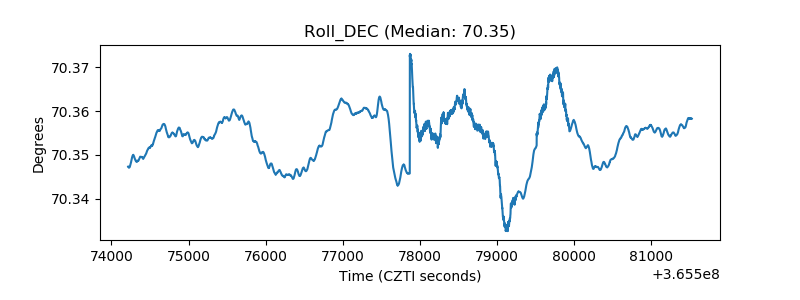 |
| _Roll_RA | 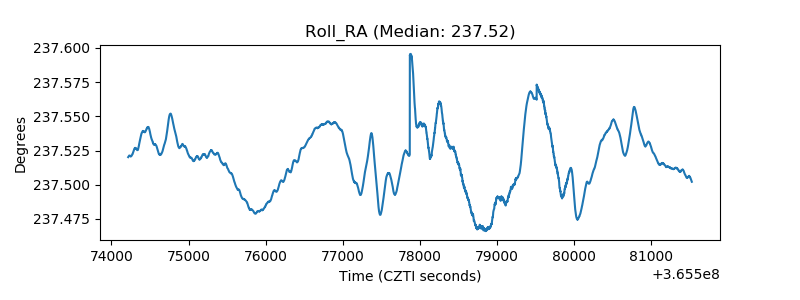 |
| Veto Counter | 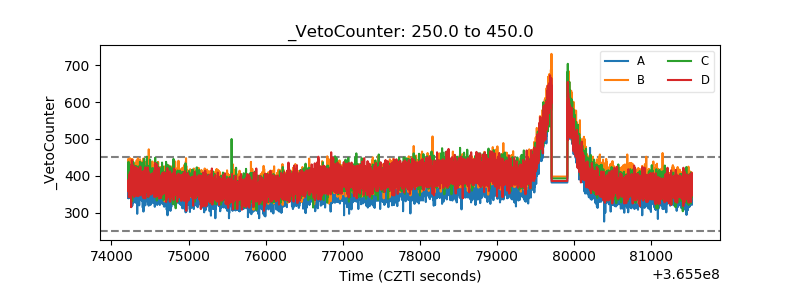 |