| Param | Original file | Final file |
|---|---|---|
| Filename | modeM0/AS1C06_002T03_9000004610_31604cztM0_level2.evt | modeM0/AS1C06_002T03_9000004610_31604cztM0_level2_quad_clean.evt |
| Size (bytes) | 1,607,592,960 | 249,770,880 |
| Size | 1.5 GB | 238.2 MB |
| Events in quadrant A | 12,487,306 | 1,563,351 |
| Events in quadrant B | 11,395,017 | 1,764,642 |
| Events in quadrant C | 7,439,978 | 1,749,767 |
| Events in quadrant D | 16,412,582 | 1,508,056 |
| Mode M0 | |||
|---|---|---|---|
| Quadrant | BADHDUFLAG | Total packets | Discarded packets |
| A | 0 | 54445 | 7719 |
| B | 0 | 49850 | 5547 |
| C | 0 | 34941 | 3684 |
| D | 0 | 67803 | 9164 |
| Mode SS | |||
|---|---|---|---|
| Quadrant | BADHDUFLAG | Total packets | Discarded packets |
| A | 0 | 320 | 28 |
| B | 0 | 324 | 34 |
| C | 0 | 322 | 32 |
| D | 0 | 324 | 30 |
| Mode M9 | |||
|---|---|---|---|
| Quadrant | BADHDUFLAG | Total packets | Discarded packets |
| A | 0 | 9 | 0 |
| B | 0 | 10 | 1 |
| C | 0 | 9 | 0 |
| D | 0 | 9 | 0 |
| Quadrant | Total seconds | Saturated seconds | Saturation percentage |
|---|---|---|---|
| A | 14064 | 3044 | 21.643914% |
| B | 14126 | 560 | 3.964321% |
| C | 14285 | 375 | 2.625131% |
| D | 14046 | 2218 | 15.790973% |
Noise dominated data is calculated using 1-second bins in cleaned event files. If a bin has >2000 counts, and if more than 50% of those come from <1% of pixels, then it is considered to be noise-dominated and hence unusable.
| Quadrant | # 1 sec bins | Bins with >0 counts | Bins with >2000 counts | High rate bins dominated by noise | Noise dominated (total time) | Noise dominated (detector-on time) | Marked lightcurve |
|---|---|---|---|---|---|---|---|
| A | 18827 | 14309 | 2274 | 2274 | 12.08% | 15.89% | 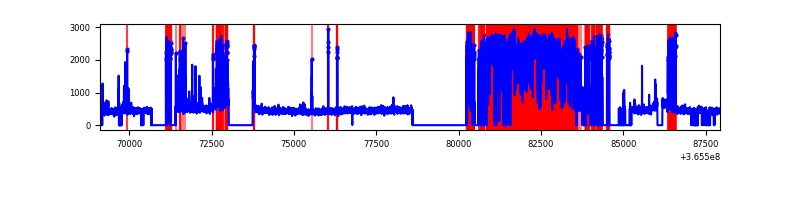 |
| B | 18823 | 14376 | 147 | 147 | 0.78% | 1.02% | 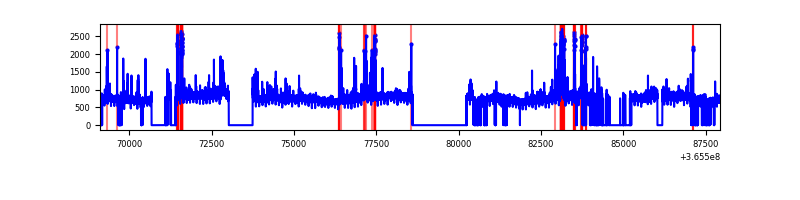 |
| C | 18816 | 14491 | 42 | 42 | 0.22% | 0.29% | 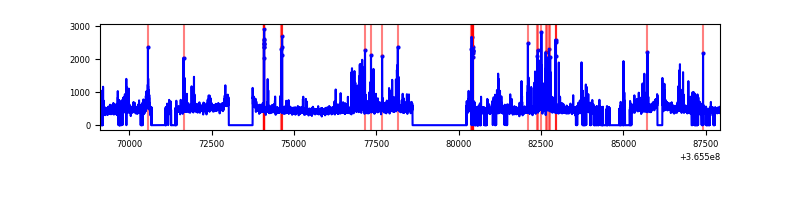 |
| D | 18815 | 14284 | 1749 | 1749 | 9.30% | 12.24% |  |
Top three noisy pixels from each quadrant. If the there are fewer than three noisy pixels in the level2.evt file, extra rows are filled as -1
| Pixel properties | Quadrant properties | ||||||
|---|---|---|---|---|---|---|---|
| Quadrant | DetID | PixID | Counts | Sigma | Mean | Median | Sigma |
| A | 0 | 13 | 6768574 | 23124.01 | 1471 | 1437 | 292.6 |
| A | 15 | 174 | 40665 | 134.05 | 1471 | 1437 | 292.6 |
| A | 13 | 254 | 24367 | 78.35 | 1471 | 1437 | 292.6 |
| B | 6 | 159 | 4049475 | 13266.84 | 1621 | 1577 | 305.1 |
| B | 5 | 172 | 495323 | 1618.23 | 1621 | 1577 | 305.1 |
| B | 4 | 80 | 237226 | 772.33 | 1621 | 1577 | 305.1 |
| C | 3 | 233 | 710215 | 1904.03 | 1594 | 1602 | 372.2 |
| C | 14 | 238 | 275406 | 735.71 | 1594 | 1602 | 372.2 |
| C | 14 | 225 | 111542 | 295.41 | 1594 | 1602 | 372.2 |
| D | 8 | 195 | 6829699 | 19651.12 | 1462 | 1420 | 347.5 |
| D | 12 | 2 | 3222920 | 9271.16 | 1462 | 1420 | 347.5 |
| D | 12 | 218 | 318097 | 911.37 | 1462 | 1420 | 347.5 |
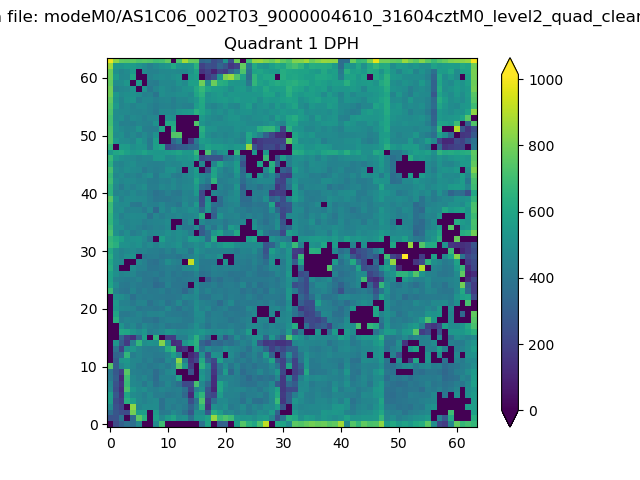
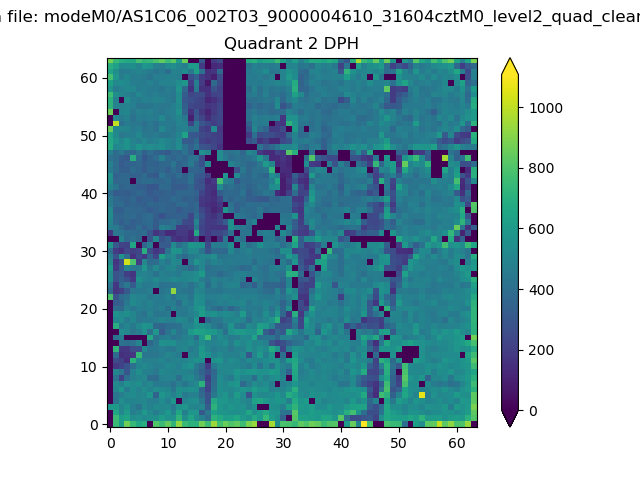
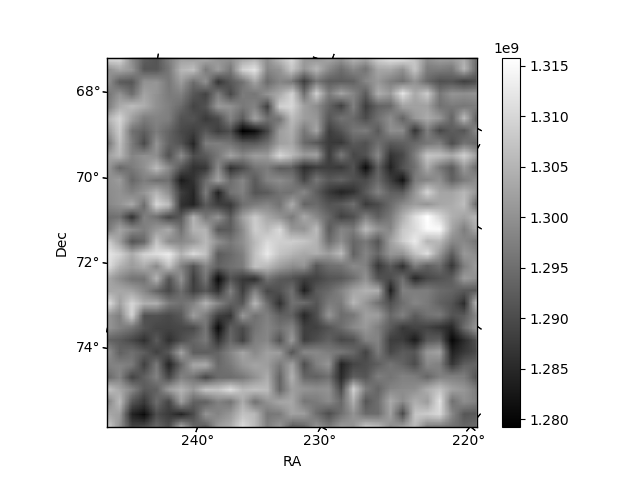
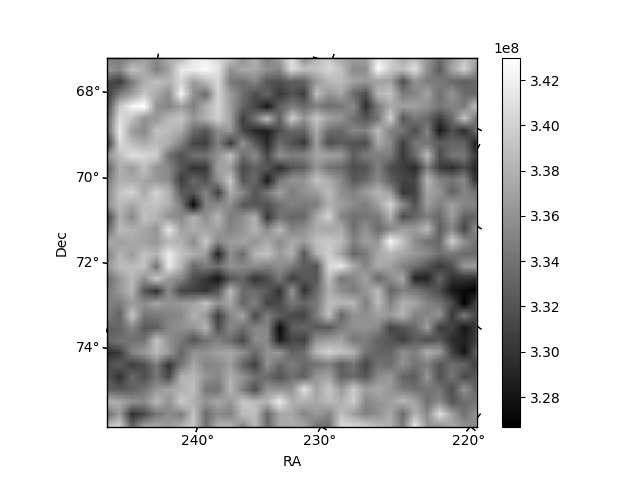
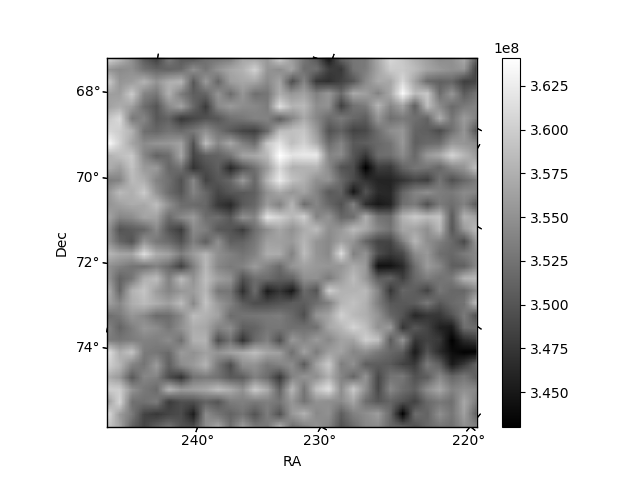
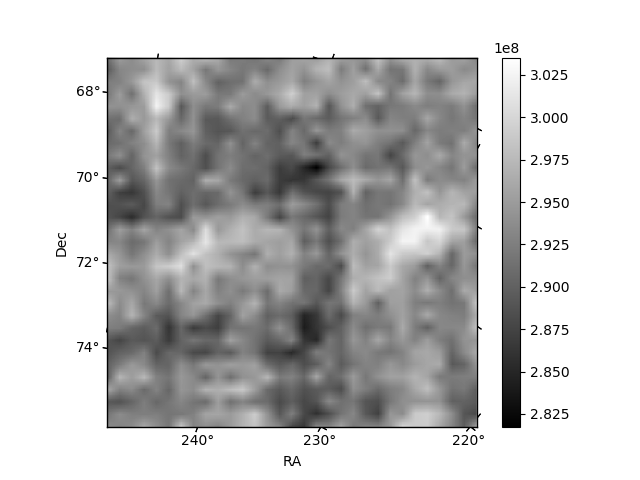
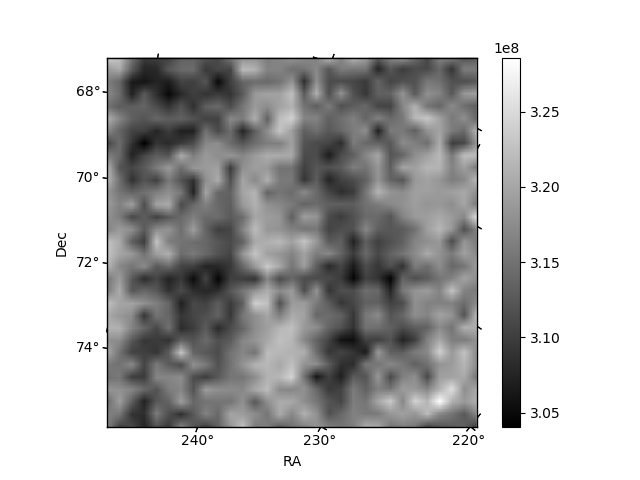
Histogram calculated using DETX and DETY for each event in the final _common_clean file
| Quadrant A | 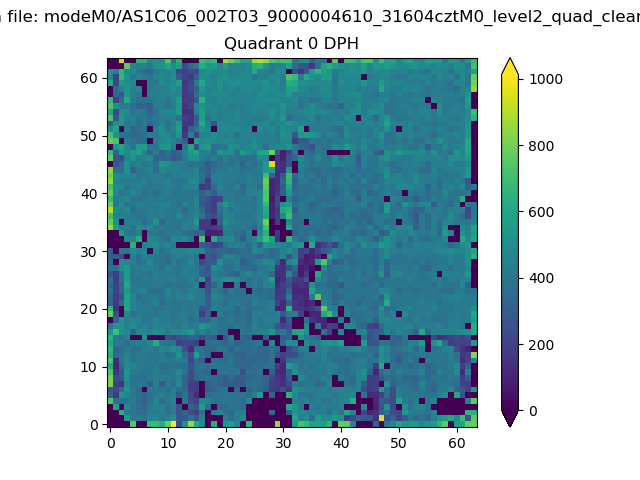 |
 |
Quadrant B |
|---|---|---|---|
| Quadrant D | 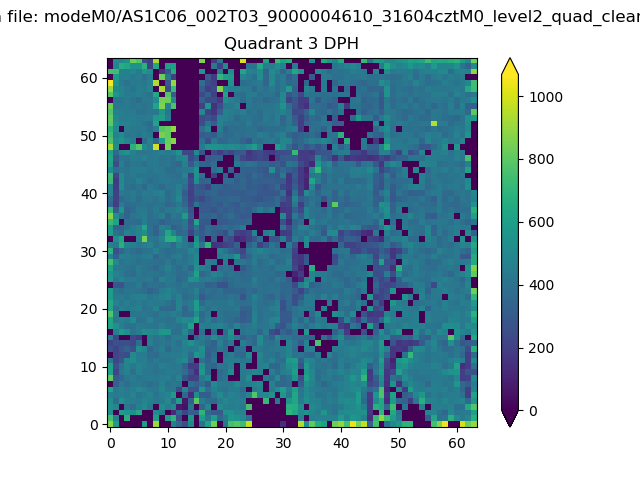 |
 |
Quadrant C |
| Plot type | Count rate plots | Images |
|---|---|---|
| Comparison with Poisson distribution Blue bars denote a histogram of data divided into 1 sec bins. Red curve is a Poisson curve with rate = median count rate of data. |
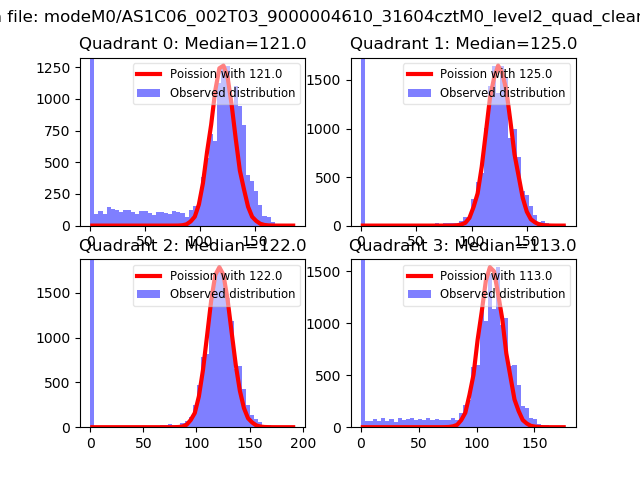 |
 |
| Quadrant-wise count rates Data is divided into 100 sec bins |
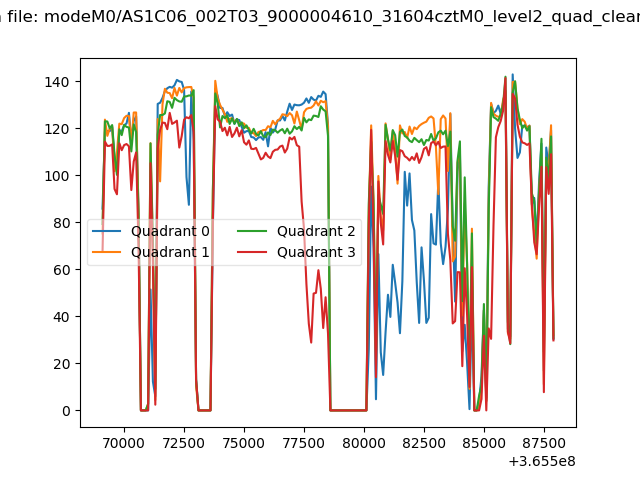 |
|
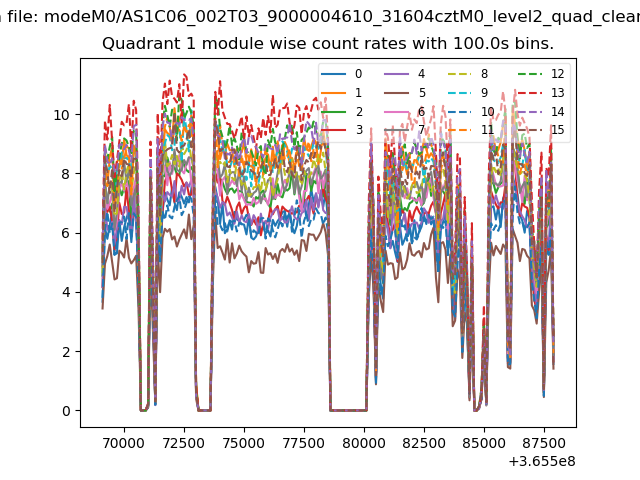
| Module-wise count rates for Quadrant A Data is divided into 100 sec bins |
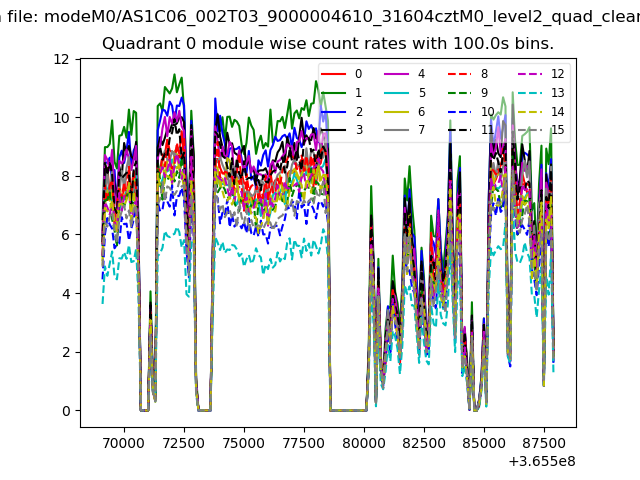 |
 |
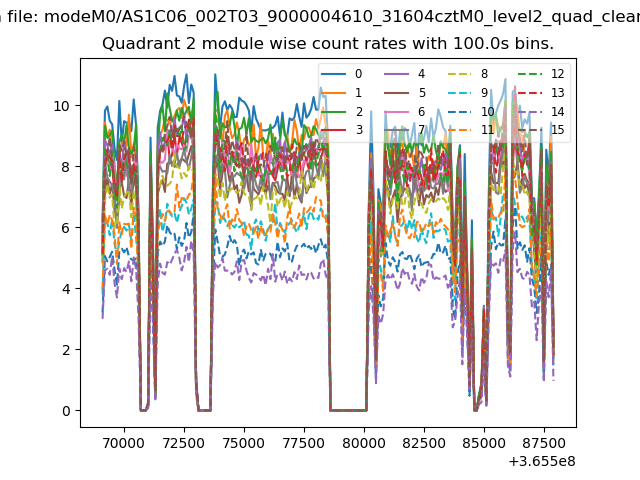
| Module-wise count rates for Quadrant B Data is divided into 100 sec bins |
 |
 |
| Module-wise count rates for Quadrant C Data is divided into 100 sec bins |
 |
 |
| Module-wise count rates for Quadrant D Data is divided into 100 sec bins |
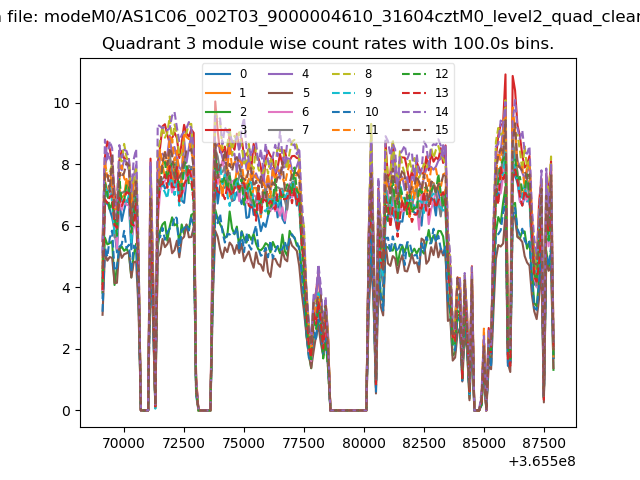 |
 |
| Parameter | Plot |
|---|---|
| CZT HV Monitor | 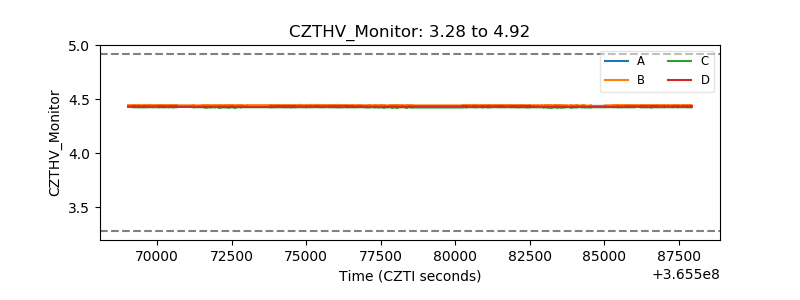 |
| D_VDD | 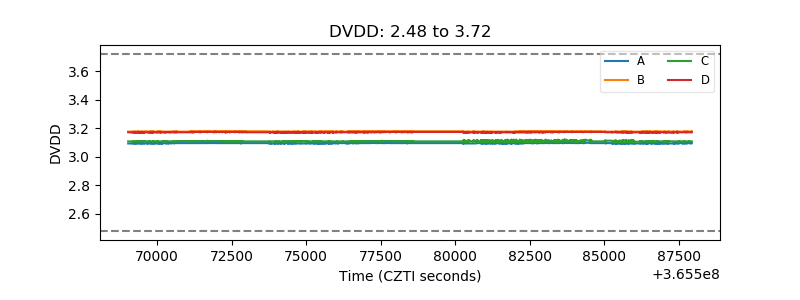 |
| Temperature 1 |  |
| Veto HV Monitor | 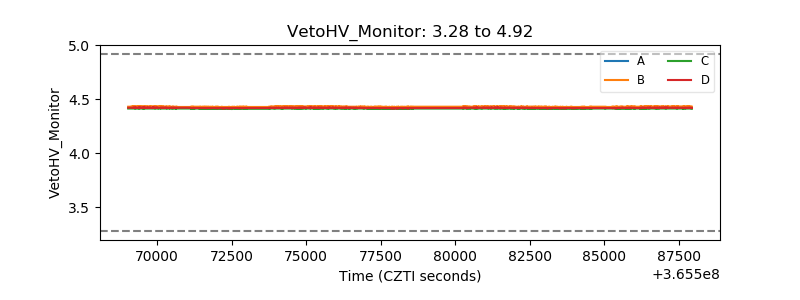 |
| Veto LLD | 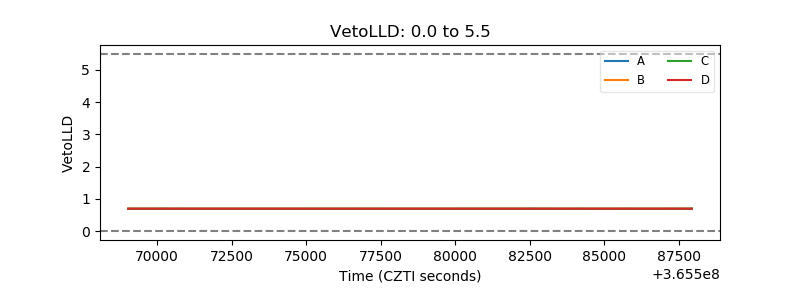 |
| Alpha Counter | 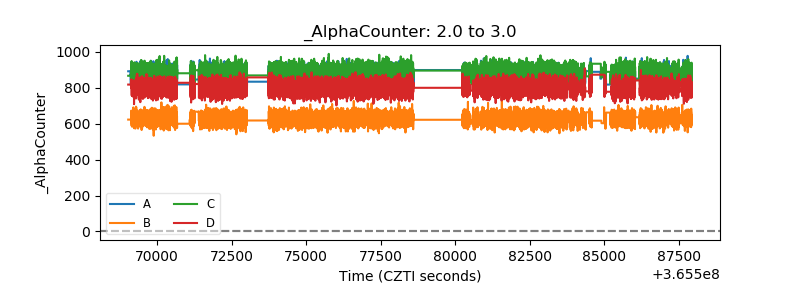 |
| _CPM_Rate | 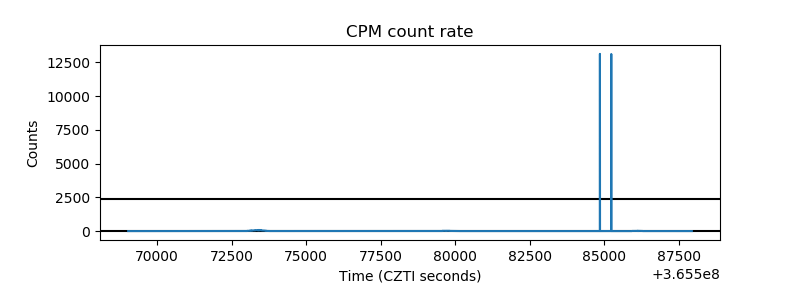 |
| CZT Counter | 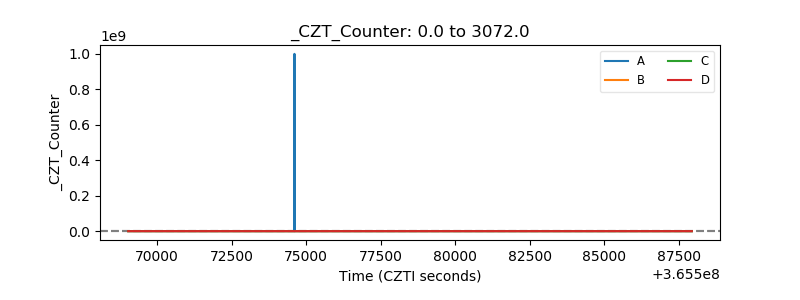 |
| +2.5 Volts monitor |  |
| +5 Volts monitor |  |
| _ROLL_ROT | 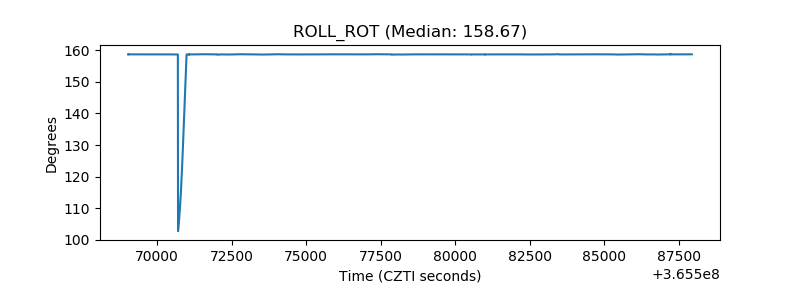 |
| _Roll_DEC | 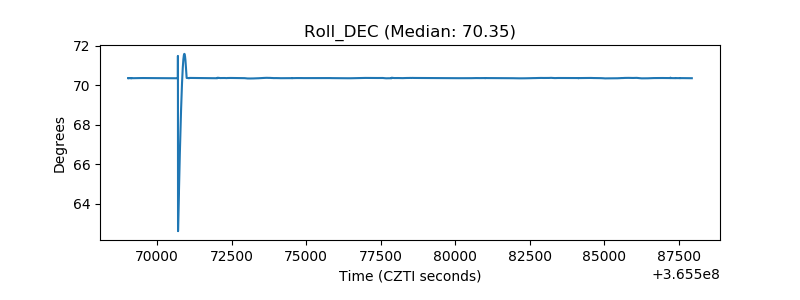 |
| _Roll_RA | 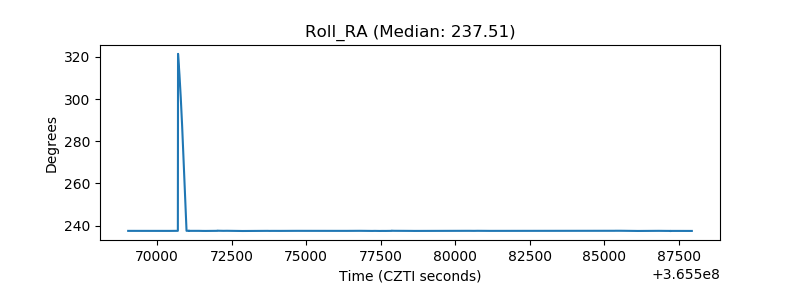 |
| Veto Counter |  |