| Param | Original file | Final file |
|---|---|---|
| Filename | modeM0/AS1C06_002T03_9000004610_31607cztM0_level2.evt | modeM0/AS1C06_002T03_9000004610_31607cztM0_level2_quad_clean.evt |
| Size (bytes) | 509,063,040 | 89,487,360 |
| Size | 485.5 MB | 85.3 MB |
| Events in quadrant A | 4,454,529 | 558,767 |
| Events in quadrant B | 4,063,372 | 615,158 |
| Events in quadrant C | 2,440,934 | 603,687 |
| Events in quadrant D | 4,117,674 | 579,649 |
| Mode M0 | |||
|---|---|---|---|
| Quadrant | BADHDUFLAG | Total packets | Discarded packets |
| A | 0 | 16618 | 0 |
| B | 0 | 15895 | 0 |
| C | 0 | 10463 | 0 |
| D | 0 | 15847 | 0 |
| Mode SS | |||
|---|---|---|---|
| Quadrant | BADHDUFLAG | Total packets | Discarded packets |
| A | 0 | 100 | 0 |
| B | 0 | 100 | 0 |
| C | 0 | 100 | 0 |
| D | 0 | 100 | 0 |
| Quadrant | Total seconds | Saturated seconds | Saturation percentage |
|---|---|---|---|
| A | 5027 | 920 | 18.301174% |
| B | 5027 | 112 | 2.227969% |
| C | 5027 | 37 | 0.736025% |
| D | 5028 | 141 | 2.804296% |
Noise dominated data is calculated using 1-second bins in cleaned event files. If a bin has >2000 counts, and if more than 50% of those come from <1% of pixels, then it is considered to be noise-dominated and hence unusable.
| Quadrant | # 1 sec bins | Bins with >0 counts | Bins with >2000 counts | High rate bins dominated by noise | Noise dominated (total time) | Noise dominated (detector-on time) | Marked lightcurve |
|---|---|---|---|---|---|---|---|
| A | 5027 | 5027 | 681 | 681 | 13.55% | 13.55% | 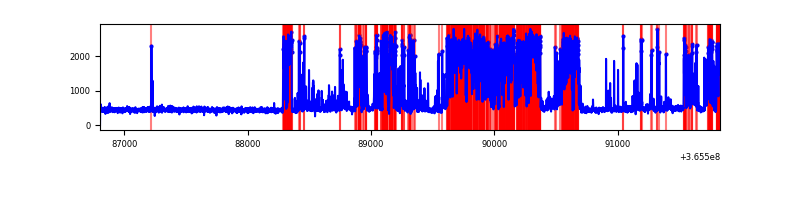 |
| B | 5027 | 5027 | 81 | 81 | 1.61% | 1.61% | 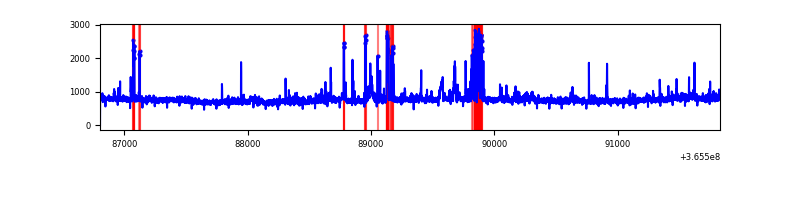 |
| C | 5027 | 5027 | 3 | 3 | 0.06% | 0.06% | 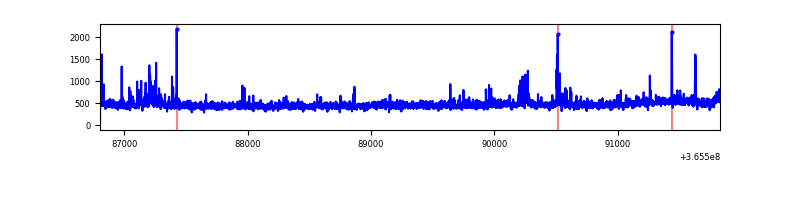 |
| D | 5028 | 5028 | 131 | 131 | 2.61% | 2.61% | 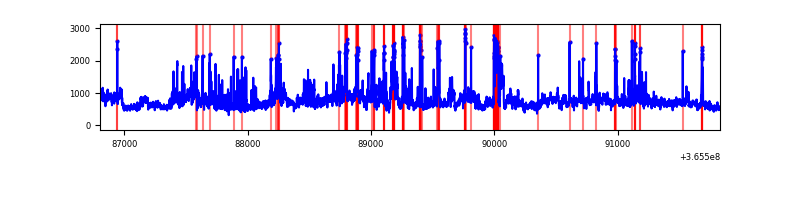 |
Top three noisy pixels from each quadrant. If the there are fewer than three noisy pixels in the level2.evt file, extra rows are filled as -1
| Pixel properties | Quadrant properties | ||||||
|---|---|---|---|---|---|---|---|
| Quadrant | DetID | PixID | Counts | Sigma | Mean | Median | Sigma |
| A | 0 | 13 | 2438096 | 23024.23 | 520 | 507 | 105.9 |
| A | 13 | 254 | 9123 | 81.38 | 520 | 507 | 105.9 |
| A | 3 | 137 | 5154 | 43.89 | 520 | 507 | 105.9 |
| B | 6 | 159 | 1411628 | 13096.12 | 564 | 551 | 107.7 |
| B | 5 | 172 | 254662 | 2358.39 | 564 | 551 | 107.7 |
| B | 4 | 80 | 103697 | 957.29 | 564 | 551 | 107.7 |
| C | 3 | 233 | 124931 | 960.08 | 551 | 553 | 129.6 |
| C | 14 | 238 | 93087 | 714.27 | 551 | 553 | 129.6 |
| C | 10 | 22 | 38563 | 293.4 | 551 | 553 | 129.6 |
| D | 8 | 195 | 1325301 | 9930.84 | 550 | 534 | 133.4 |
| D | 12 | 218 | 295431 | 2210.63 | 550 | 534 | 133.4 |
| D | 12 | 2 | 120680 | 900.65 | 550 | 534 | 133.4 |
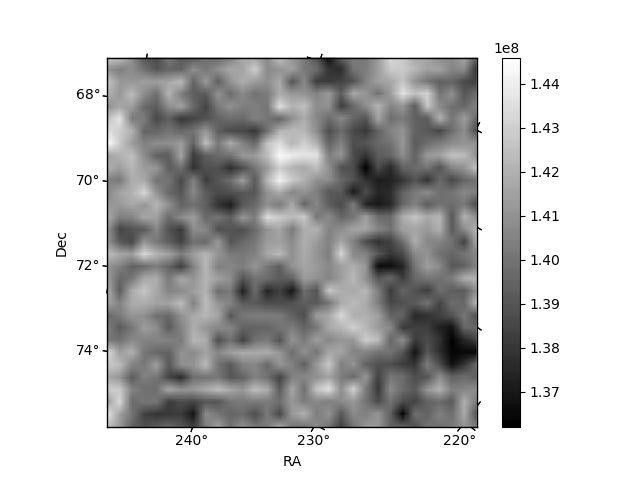
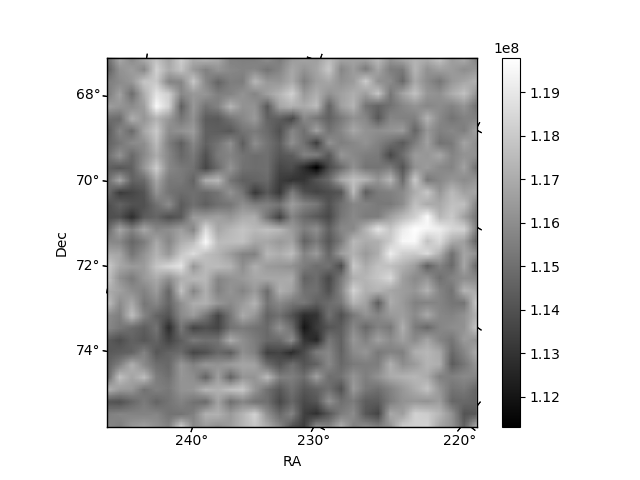
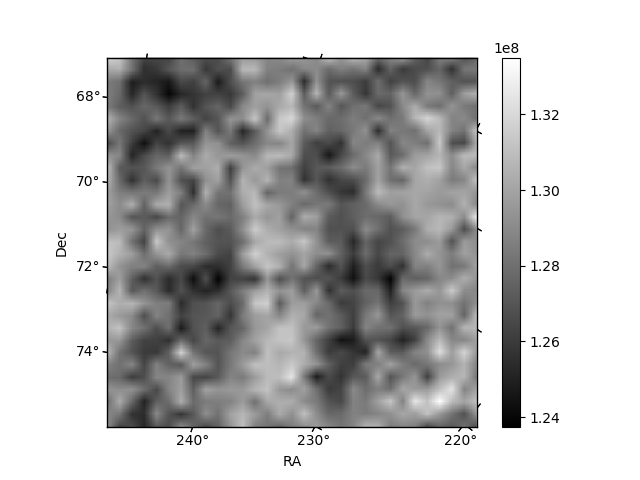
Histogram calculated using DETX and DETY for each event in the final _common_clean file
| Quadrant A | 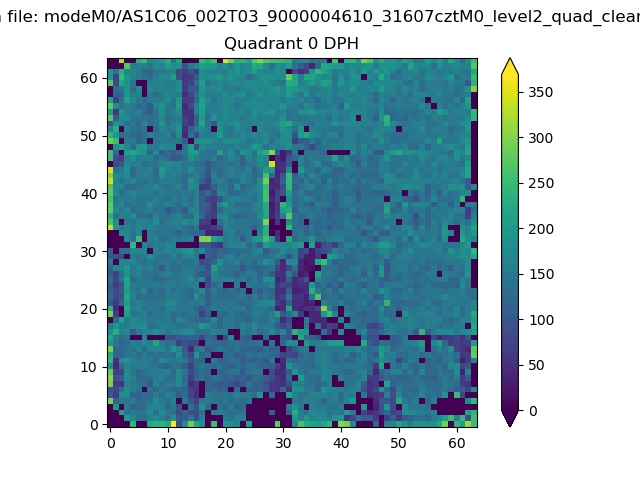 |
 |
Quadrant B |
|---|---|---|---|
| Quadrant D | 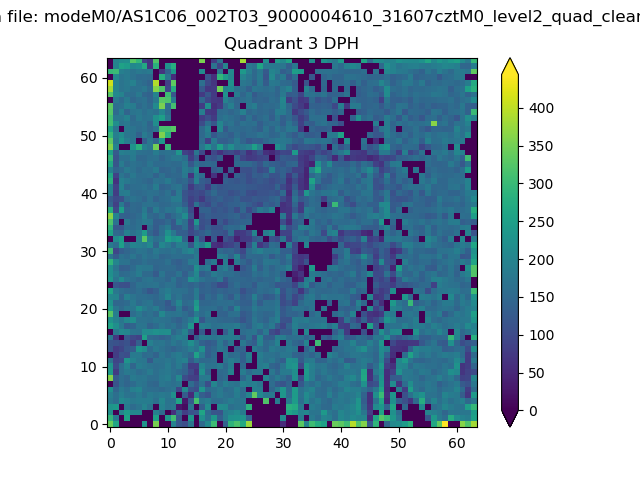 |
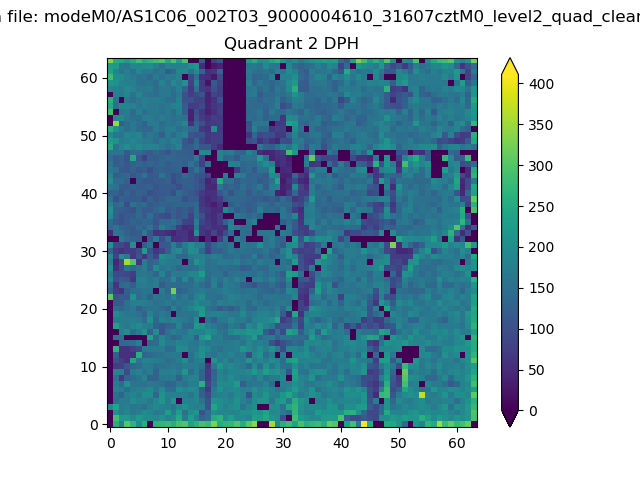 |
Quadrant C |
| Plot type | Count rate plots | Images |
|---|---|---|
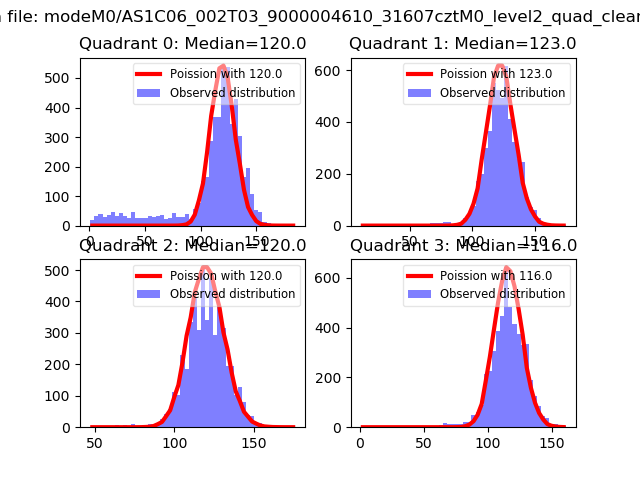
| Comparison with Poisson distribution Blue bars denote a histogram of data divided into 1 sec bins. Red curve is a Poisson curve with rate = median count rate of data. |
 |
 |
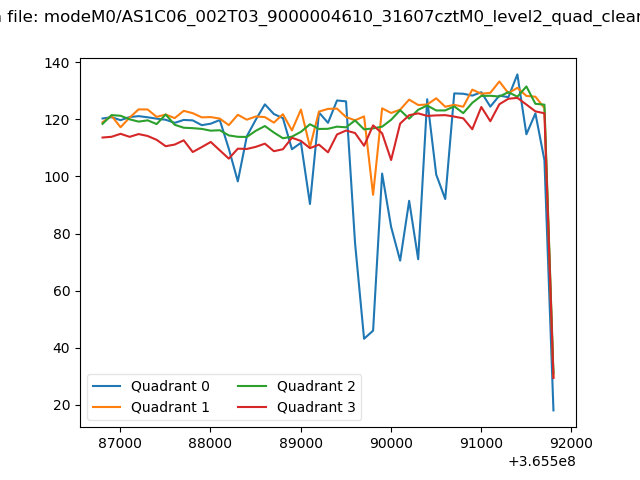
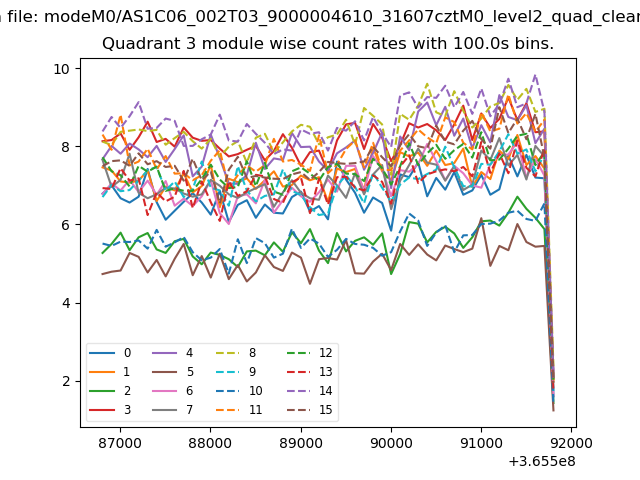
| Quadrant-wise count rates Data is divided into 100 sec bins |
 |
|
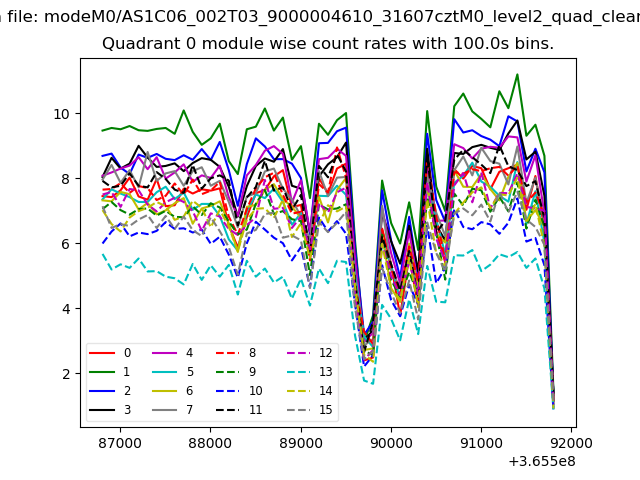
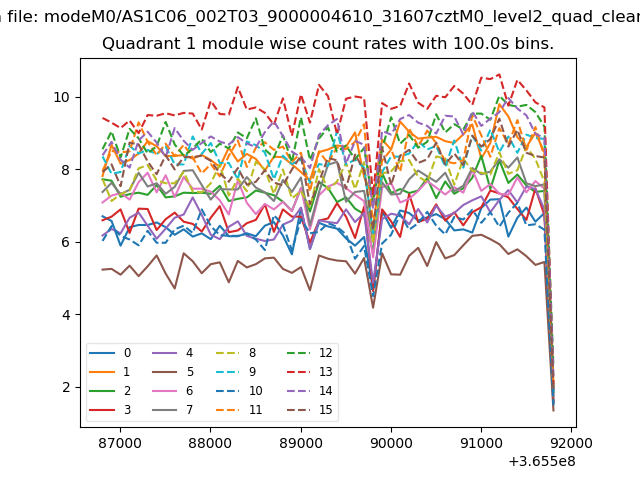
| Module-wise count rates for Quadrant A Data is divided into 100 sec bins |
 |
 |
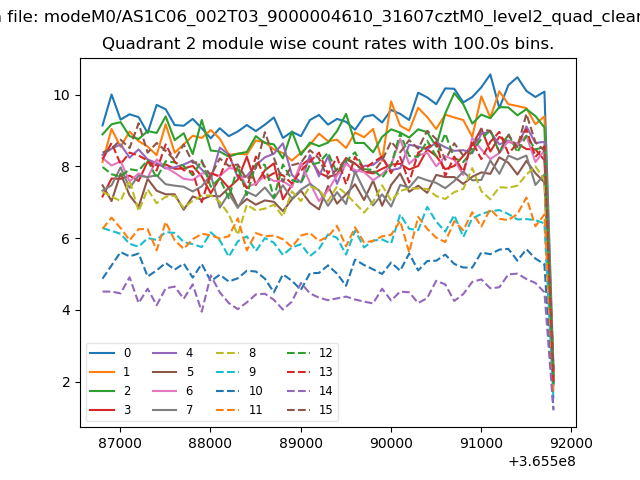
| Module-wise count rates for Quadrant B Data is divided into 100 sec bins |
 |
 |
| Module-wise count rates for Quadrant C Data is divided into 100 sec bins |
 |
 |
| Module-wise count rates for Quadrant D Data is divided into 100 sec bins |
 |
 |
| Parameter | Plot |
|---|---|
| CZT HV Monitor | 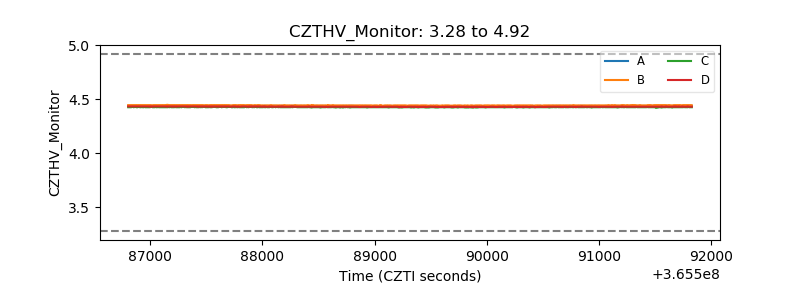 |
| D_VDD | 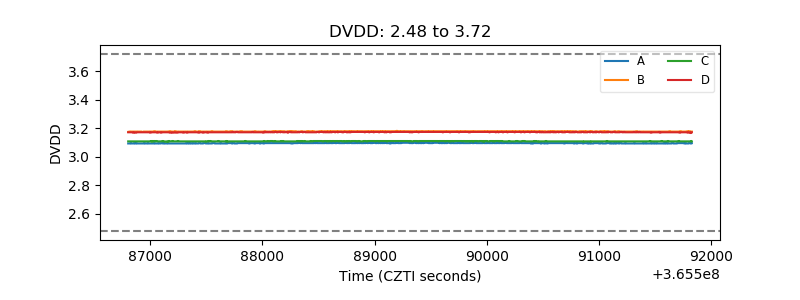 |
| Temperature 1 | 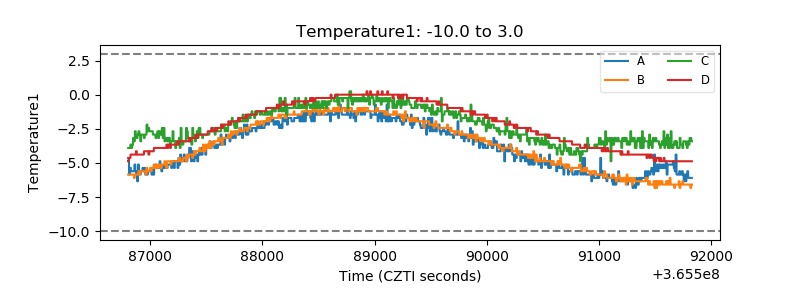 |
| Veto HV Monitor | 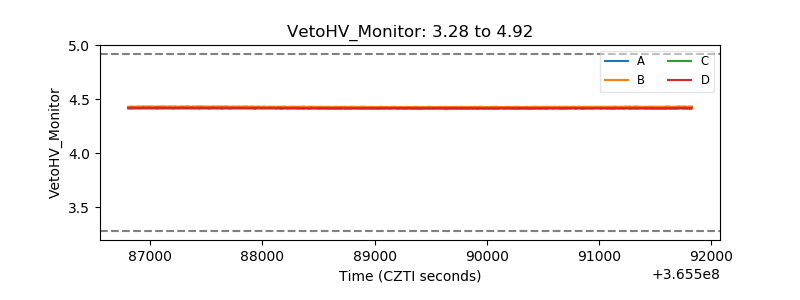 |
| Veto LLD | 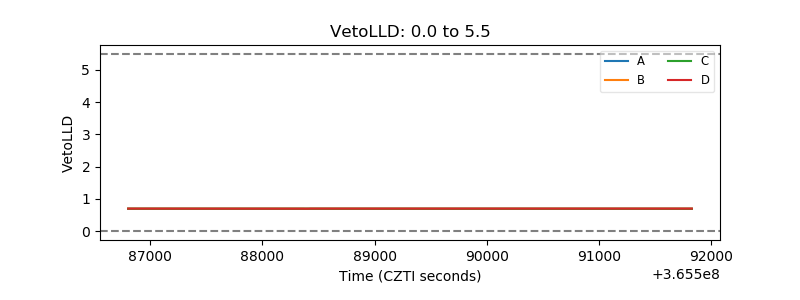 |
| Alpha Counter | 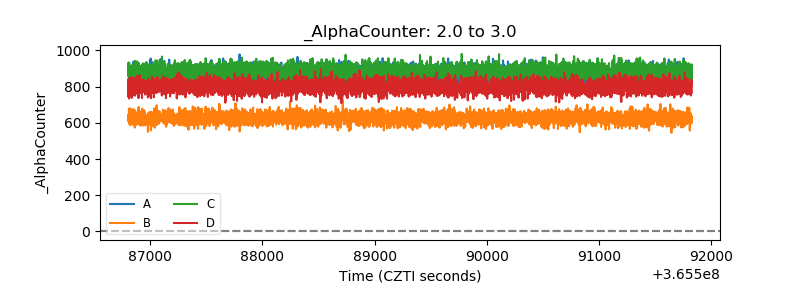 |
| _CPM_Rate | 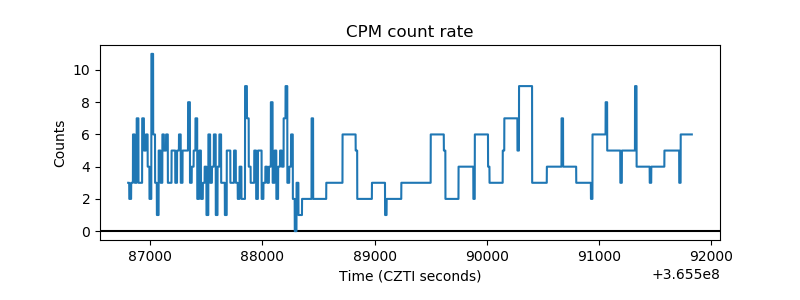 |
| CZT Counter | 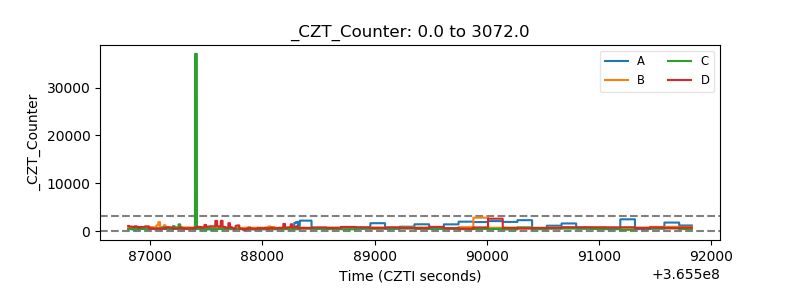 |
| +2.5 Volts monitor |  |
| +5 Volts monitor | 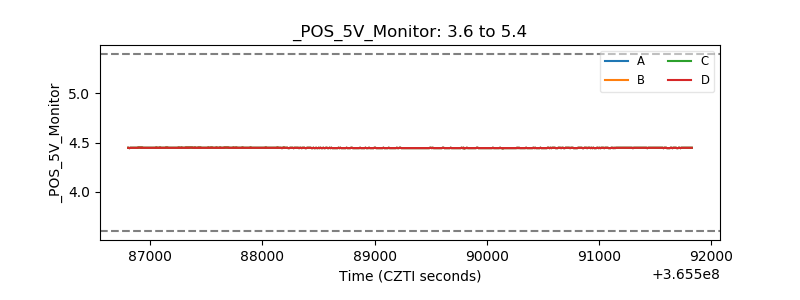 |
| _ROLL_ROT | 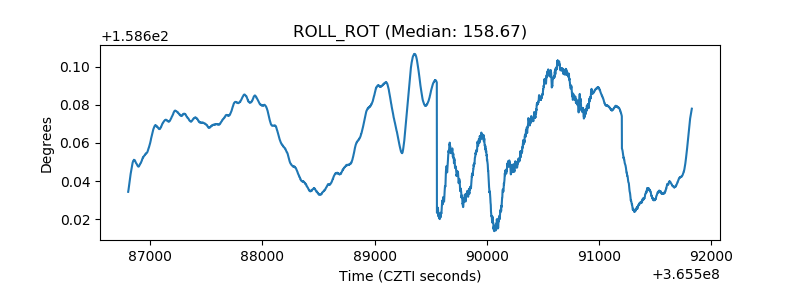 |
| _Roll_DEC | 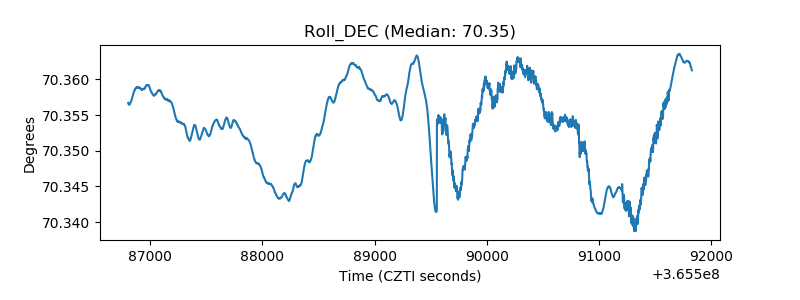 |
| _Roll_RA | 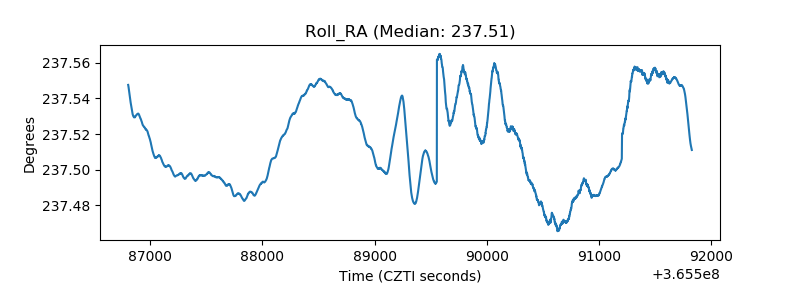 |
| Veto Counter | 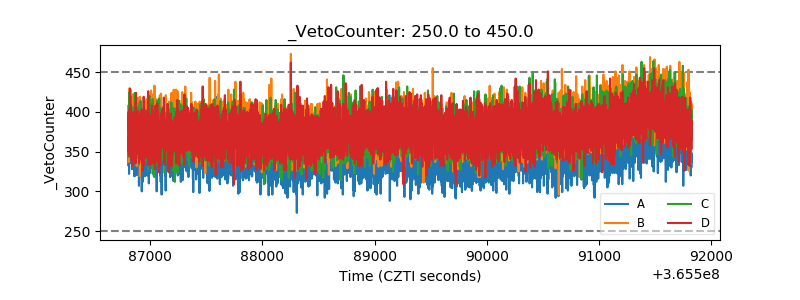 |