| Param | Original file | Final file |
|---|---|---|
| Filename | modeM0/AS1C06_002T03_9000004610_31609cztM0_level2.evt | modeM0/AS1C06_002T03_9000004610_31609cztM0_level2_quad_clean.evt |
| Size (bytes) | 1,271,992,320 | 183,614,400 |
| Size | 1.2 GB | 175.1 MB |
| Events in quadrant A | 12,422,507 | 1,085,774 |
| Events in quadrant B | 8,576,203 | 1,303,294 |
| Events in quadrant C | 5,410,839 | 1,277,273 |
| Events in quadrant D | 11,403,236 | 1,162,143 |
| Mode M0 | |||
|---|---|---|---|
| Quadrant | BADHDUFLAG | Total packets | Discarded packets |
| A | 0 | 44016 | 1 |
| B | 0 | 33382 | 1 |
| C | 0 | 22775 | 1 |
| D | 0 | 41315 | 1 |
| Mode SS | |||
|---|---|---|---|
| Quadrant | BADHDUFLAG | Total packets | Discarded packets |
| A | 0 | 212 | 0 |
| B | 0 | 212 | 0 |
| C | 0 | 212 | 0 |
| D | 0 | 212 | 0 |
| Mode M9 | |||
|---|---|---|---|
| Quadrant | BADHDUFLAG | Total packets | Discarded packets |
| A | 0 | 2 | 0 |
| B | 0 | 2 | 0 |
| C | 0 | 2 | 0 |
| D | 0 | 2 | 0 |
| Quadrant | Total seconds | Saturated seconds | Saturation percentage |
|---|---|---|---|
| A | 10554 | 3476 | 32.935380% |
| B | 10554 | 431 | 4.083760% |
| C | 10555 | 232 | 2.198010% |
| D | 10555 | 1454 | 13.775462% |
Noise dominated data is calculated using 1-second bins in cleaned event files. If a bin has >2000 counts, and if more than 50% of those come from <1% of pixels, then it is considered to be noise-dominated and hence unusable.
| Quadrant | # 1 sec bins | Bins with >0 counts | Bins with >2000 counts | High rate bins dominated by noise | Noise dominated (total time) | Noise dominated (detector-on time) | Marked lightcurve |
|---|---|---|---|---|---|---|---|
| A | 10704 | 10554 | 2726 | 2726 | 25.47% | 25.83% | 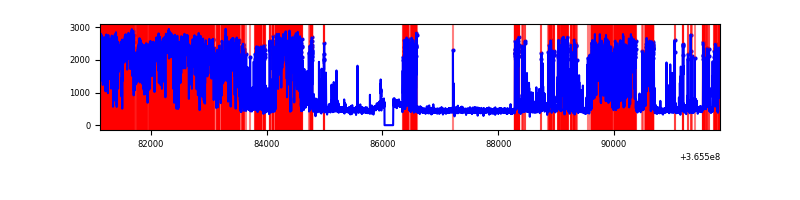 |
| B | 10704 | 10554 | 164 | 164 | 1.53% | 1.55% |  |
| C | 10705 | 10555 | 19 | 19 | 0.18% | 0.18% | 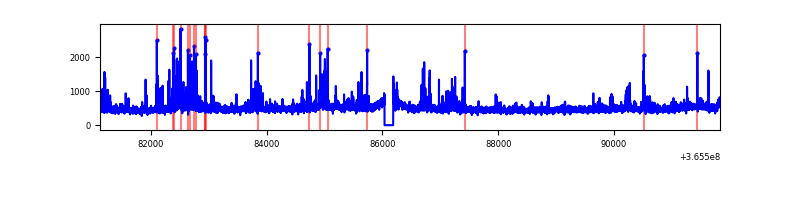 |
| D | 10705 | 10555 | 1333 | 1333 | 12.45% | 12.63% |  |
Top three noisy pixels from each quadrant. If the there are fewer than three noisy pixels in the level2.evt file, extra rows are filled as -1
| Pixel properties | Quadrant properties | ||||||
|---|---|---|---|---|---|---|---|
| Quadrant | DetID | PixID | Counts | Sigma | Mean | Median | Sigma |
| A | 0 | 13 | 8399728 | 39933.86 | 1040 | 1016 | 210.3 |
| A | 13 | 254 | 17942 | 80.48 | 1040 | 1016 | 210.3 |
| A | 3 | 137 | 10387 | 44.56 | 1040 | 1016 | 210.3 |
| B | 6 | 159 | 2942697 | 12929.51 | 1206 | 1174 | 227.5 |
| B | 5 | 172 | 542800 | 2380.73 | 1206 | 1174 | 227.5 |
| B | 4 | 80 | 173590 | 757.86 | 1206 | 1174 | 227.5 |
| C | 3 | 233 | 438731 | 1583.03 | 1179 | 1184 | 276.4 |
| C | 14 | 238 | 200569 | 721.37 | 1179 | 1184 | 276.4 |
| C | 14 | 225 | 59954 | 212.63 | 1179 | 1184 | 276.4 |
| D | 8 | 195 | 4081192 | 14973.9 | 1130 | 1096 | 272.5 |
| D | 12 | 2 | 1844826 | 6766.47 | 1130 | 1096 | 272.5 |
| D | 12 | 218 | 632854 | 2318.54 | 1130 | 1096 | 272.5 |
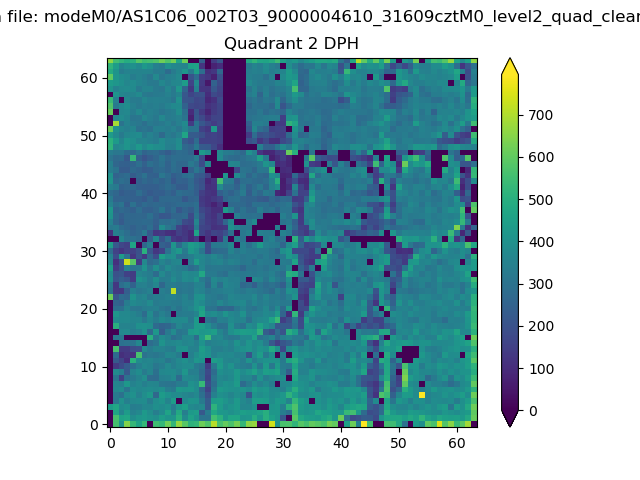
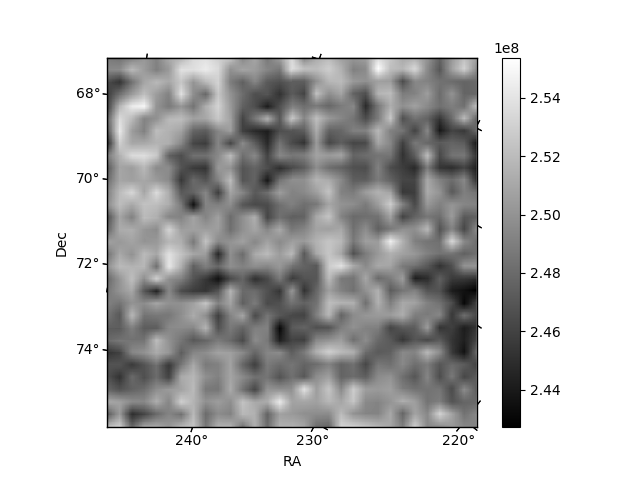
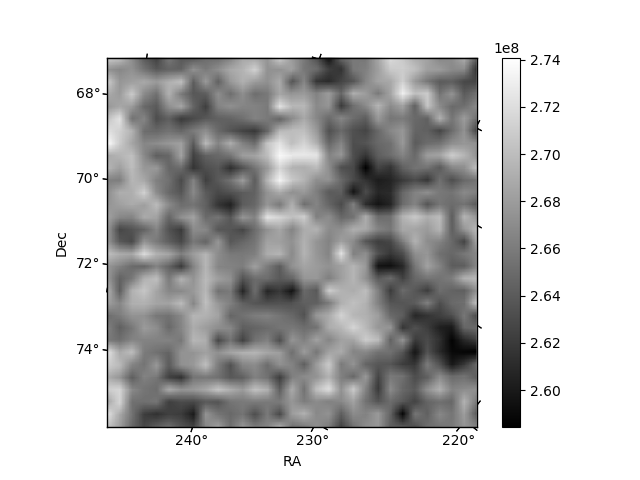
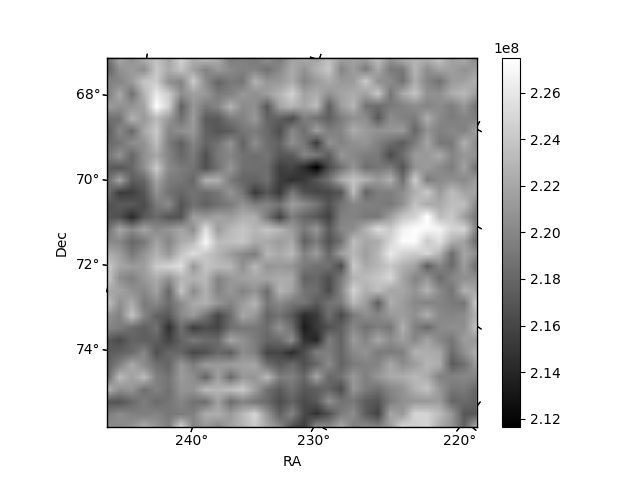
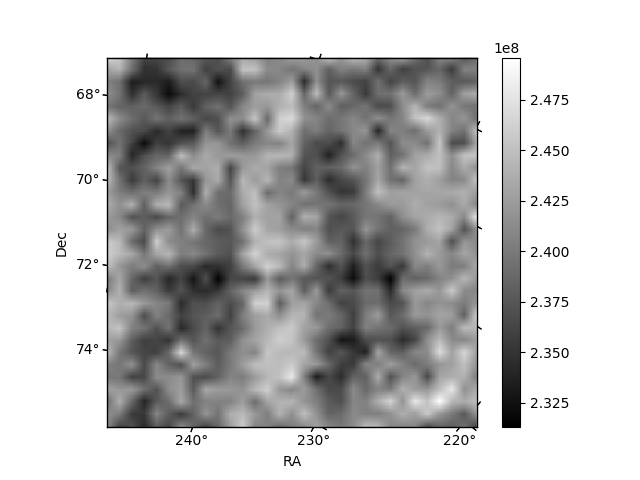
Histogram calculated using DETX and DETY for each event in the final _common_clean file
| Quadrant A | 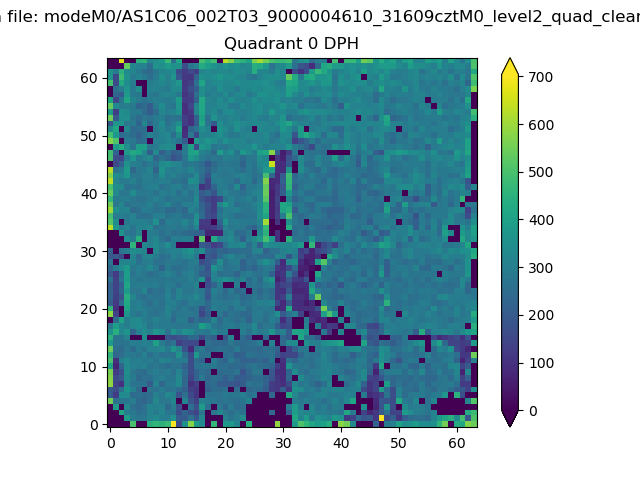 |
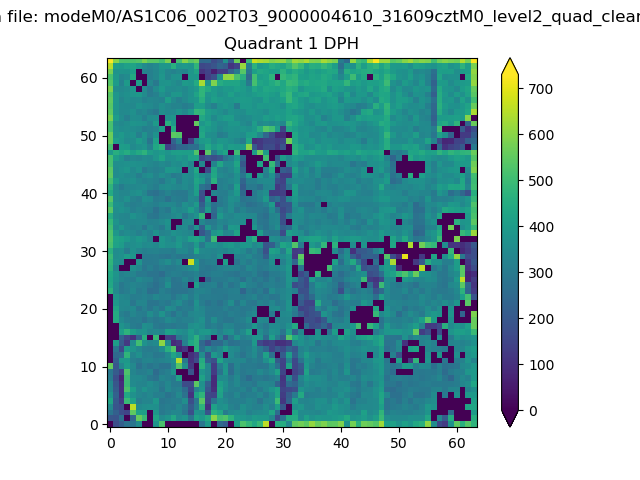 |
Quadrant B |
|---|---|---|---|
| Quadrant D | 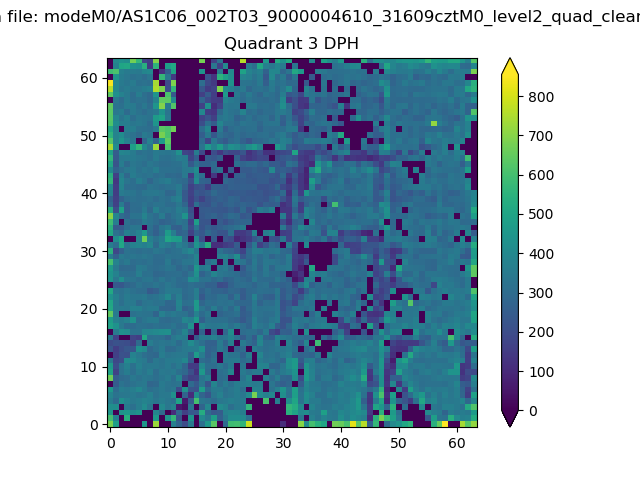 |
 |
Quadrant C |
| Plot type | Count rate plots | Images |
|---|---|---|
| Comparison with Poisson distribution Blue bars denote a histogram of data divided into 1 sec bins. Red curve is a Poisson curve with rate = median count rate of data. |
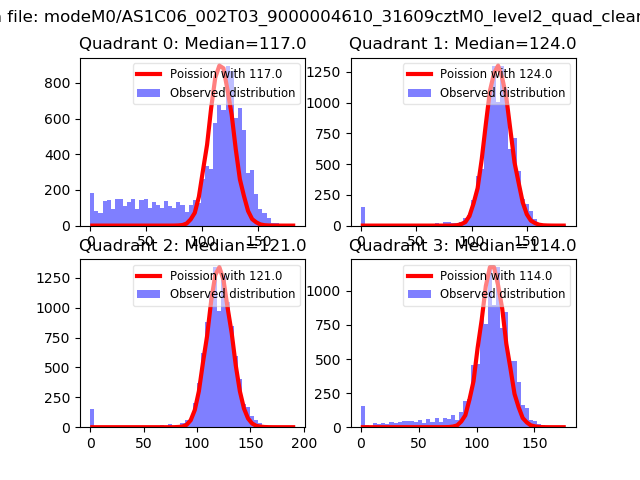 |
 |
| Quadrant-wise count rates Data is divided into 100 sec bins |
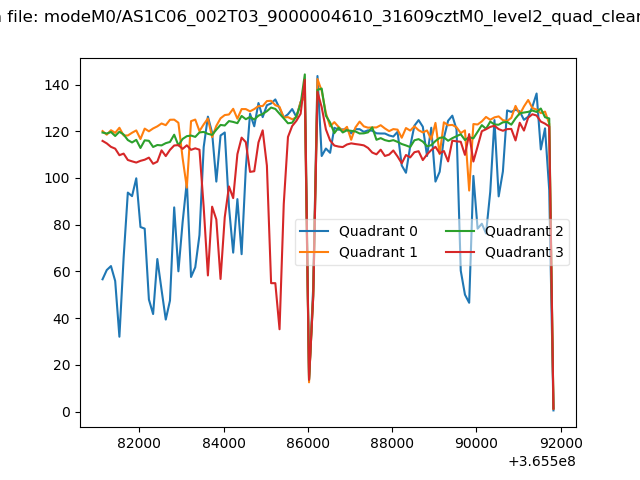 |
|
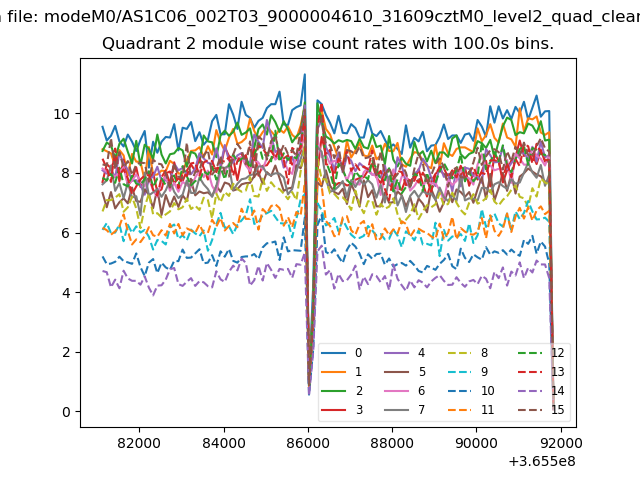
| Module-wise count rates for Quadrant A Data is divided into 100 sec bins |
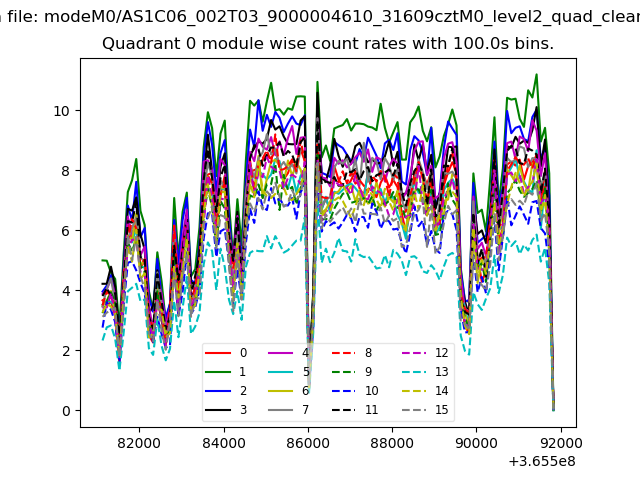 |
 |
| Module-wise count rates for Quadrant B Data is divided into 100 sec bins |
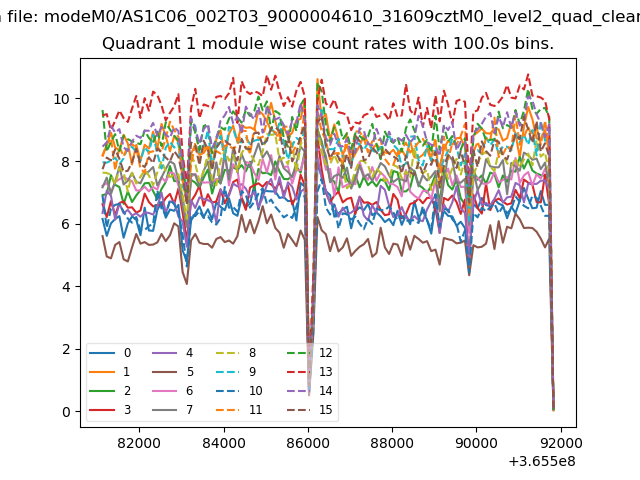 |
 |
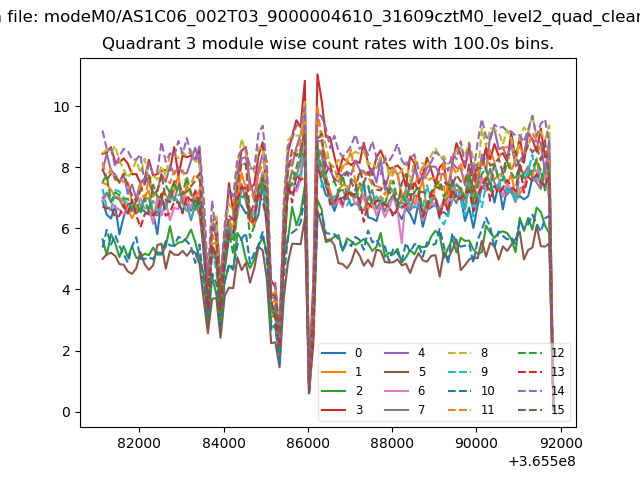
| Module-wise count rates for Quadrant C Data is divided into 100 sec bins |
 |
 |
| Module-wise count rates for Quadrant D Data is divided into 100 sec bins |
 |
 |
| Parameter | Plot |
|---|---|
| CZT HV Monitor | 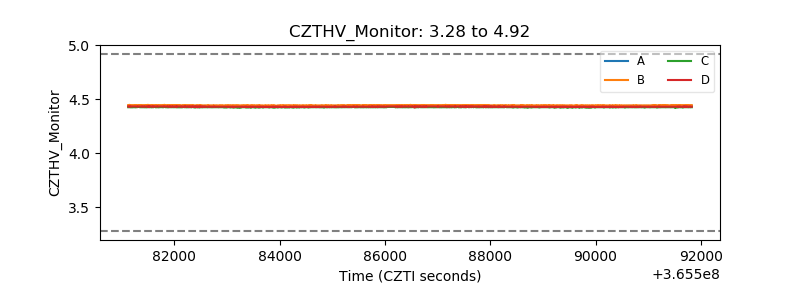 |
| D_VDD | 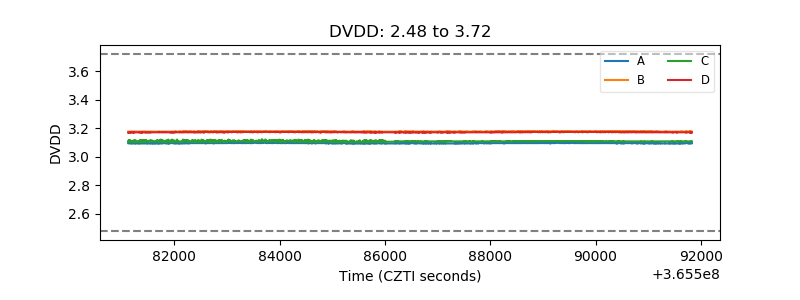 |
| Temperature 1 | 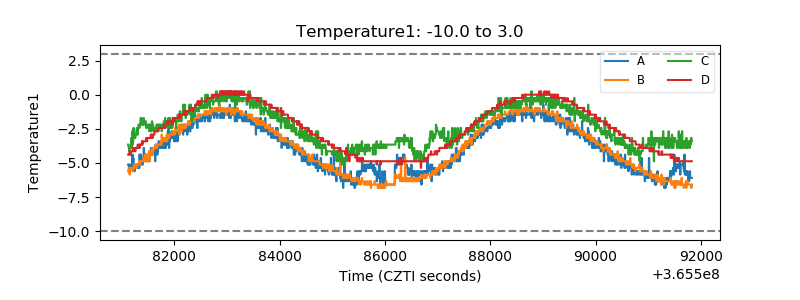 |
| Veto HV Monitor |  |
| Veto LLD | 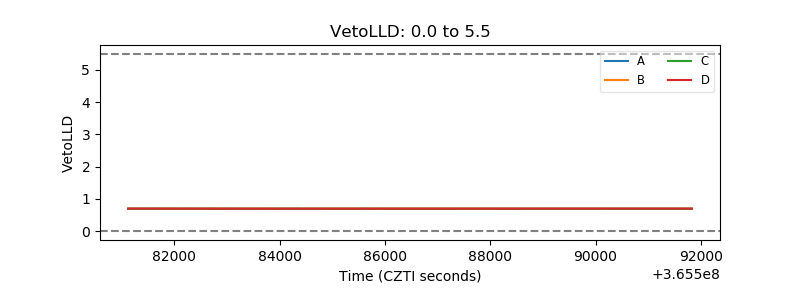 |
| Alpha Counter | 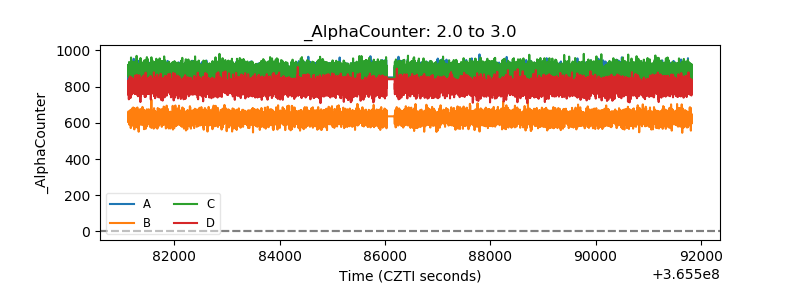 |
| _CPM_Rate | 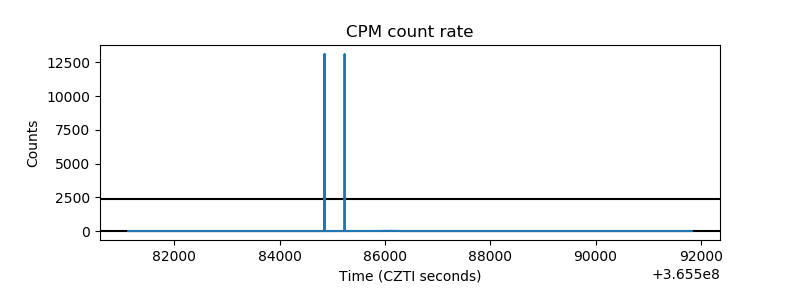 |
| CZT Counter | 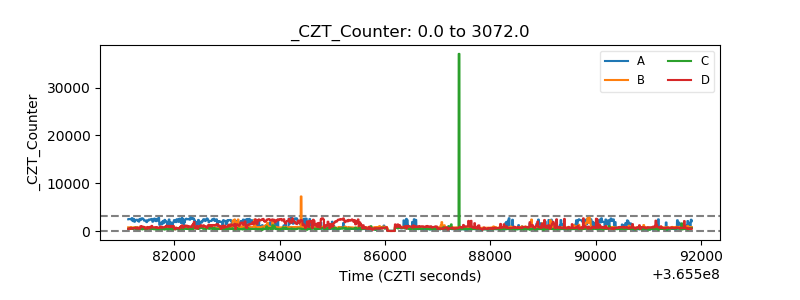 |
| +2.5 Volts monitor | 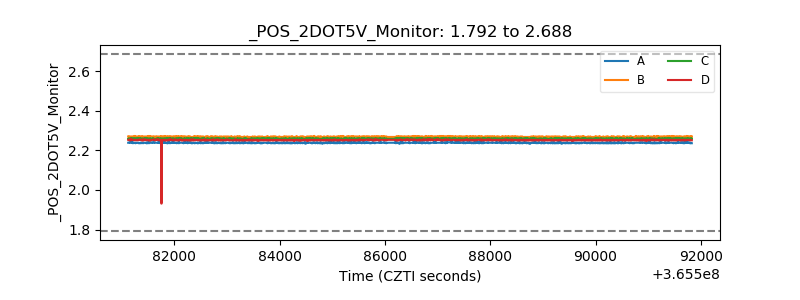 |
| +5 Volts monitor | 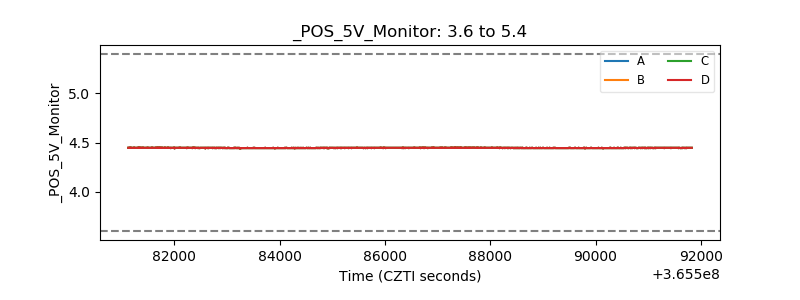 |
| _ROLL_ROT | 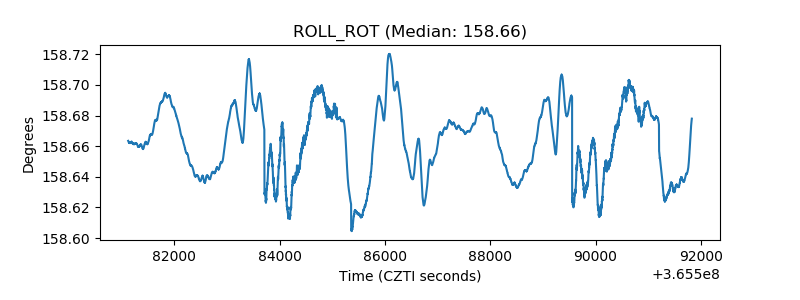 |
| _Roll_DEC | 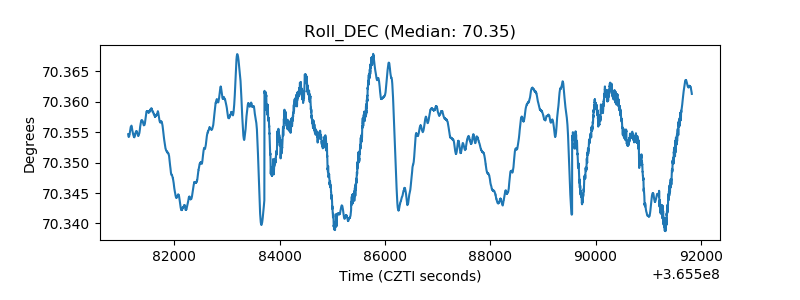 |
| _Roll_RA | 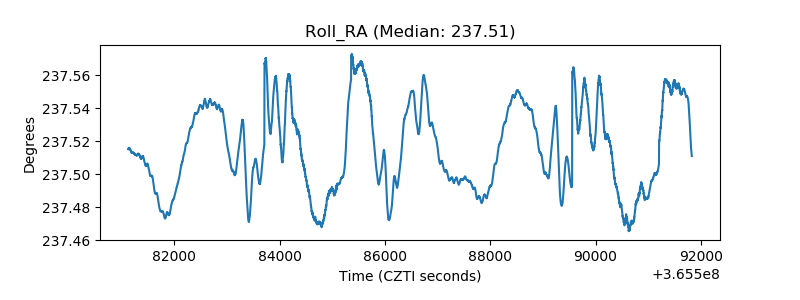 |
| Veto Counter | 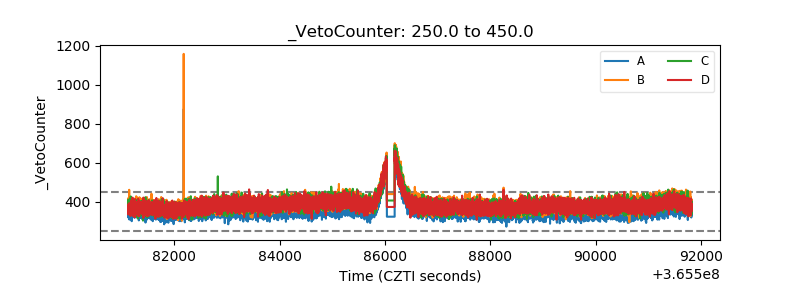 |