| Param | Original file | Final file |
|---|---|---|
| Filename | modeM0/AS1A10_094T74_9000004612cztM0_level2.fits | modeM0/AS1A10_094T74_9000004612cztM0_level2_quad_clean.evt |
| Size (bytes) | 80,352,000 | 111,971,520 |
| Size | 76.6 MB | 106.8 MB |
| Events in quadrant A | 459,866 | 680,700 |
| Events in quadrant B | 463,370 | 744,288 |
| Events in quadrant C | 471,160 | 696,348 |
| Events in quadrant D | 412,304 | 643,264 |
| Mode M9 | |||
|---|---|---|---|
| Quadrant | BADHDUFLAG | Total packets | Discarded packets |
| A | 0 | 5 | 0 |
| B | 0 | 5 | 0 |
| C | 0 | 5 | 0 |
| D | 0 | 5 | 0 |
| Mode M0 | |||
|---|---|---|---|
| Quadrant | BADHDUFLAG | Total packets | Discarded packets |
| A | 0 | 28467 | 0 |
| B | 0 | 27526 | 0 |
| C | 0 | 21333 | 0 |
| D | 0 | 27908 | 0 |
| Mode SS | |||
|---|---|---|---|
| Quadrant | BADHDUFLAG | Total packets | Discarded packets |
| A | 0 | 182 | 0 |
| B | 0 | 182 | 0 |
| C | 0 | 182 | 0 |
| D | 0 | 182 | 0 |
| Quadrant | Total seconds | Saturated seconds | Saturation percentage |
|---|---|---|---|
| A | 9014 | 1198 | 13.290437% |
| B | 9014 | 163 | 1.808298% |
| C | 9014 | 479 | 5.313956% |
| D | 9014 | 500 | 5.546927% |
Noise dominated data is calculated using 1-second bins in cleaned event files. If a bin has >2000 counts, and if more than 50% of those come from <1% of pixels, then it is considered to be noise-dominated and hence unusable.
| Quadrant | # 1 sec bins | Bins with >0 counts | Bins with >2000 counts | High rate bins dominated by noise | Noise dominated (total time) | Noise dominated (detector-on time) | Marked lightcurve |
|---|---|---|---|---|---|---|---|
| A | 9594 | 8983 | 0 | 0 | 0.00% | 0.00% |  |
| B | 9593 | 9010 | 0 | 0 | 0.00% | 0.00% | 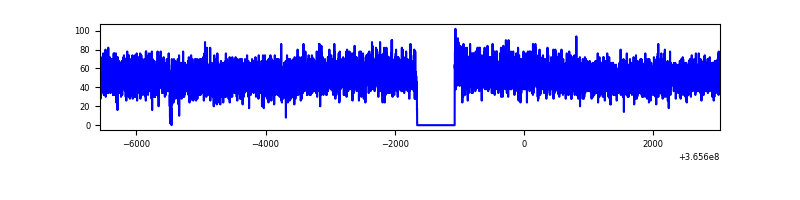 |
| C | 9593 | 9009 | 0 | 0 | 0.00% | 0.00% | 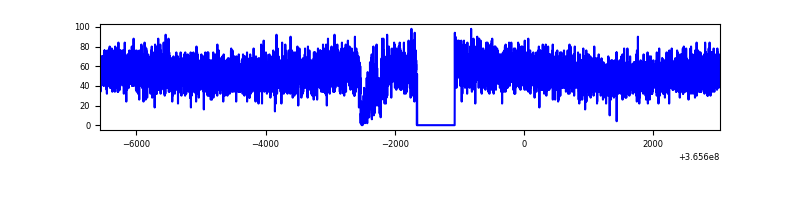 |
| D | 9594 | 8988 | 0 | 0 | 0.00% | 0.00% | 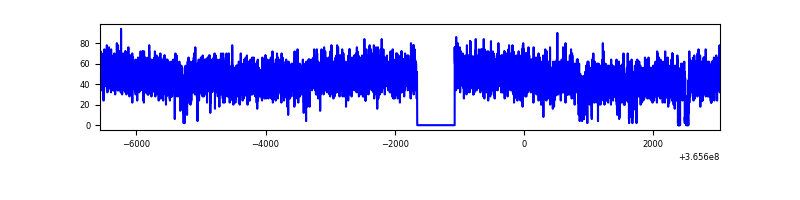 |
Top three noisy pixels from each quadrant. If the there are fewer than three noisy pixels in the level2.evt file, extra rows are filled as -1
| Pixel properties | Quadrant properties | ||||||
|---|---|---|---|---|---|---|---|
| Quadrant | DetID | PixID | Counts | Sigma | Mean | Median | Sigma |
| A | 0 | 29 | 375 | 8.21 | 120 | 113 | 31.9 |
| A | 7 | 110 | 374 | 8.17 | 120 | 113 | 31.9 |
| A | 0 | 30 | 333 | 6.89 | 120 | 113 | 31.9 |
| B | 2 | 9 | 390 | 10.08 | 122 | 116 | 27.2 |
| B | 2 | 8 | 337 | 8.13 | 122 | 116 | 27.2 |
| B | 5 | 128 | 324 | 7.65 | 122 | 116 | 27.2 |
| C | 3 | 202 | 359 | 7.24 | 124 | 117 | 33.4 |
| C | 3 | 203 | 343 | 6.76 | 124 | 117 | 33.4 |
| C | 3 | 187 | 340 | 6.68 | 124 | 117 | 33.4 |
| D | 15 | 47 | 329 | 6.66 | 117 | 107 | 33.3 |
| D | 3 | 14 | 321 | 6.42 | 117 | 107 | 33.3 |
| D | 15 | 63 | 319 | 6.36 | 117 | 107 | 33.3 |
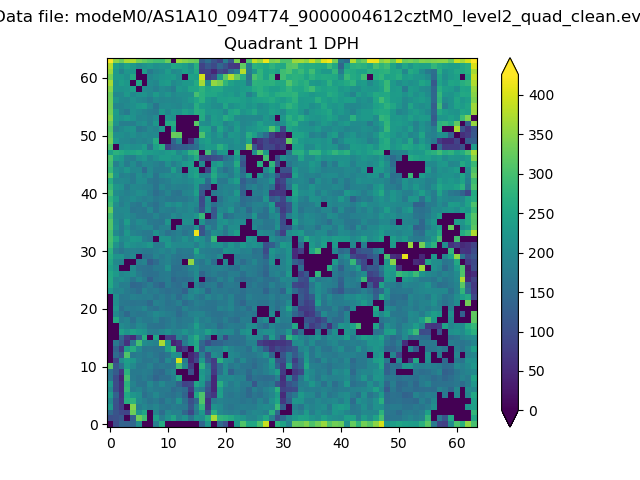
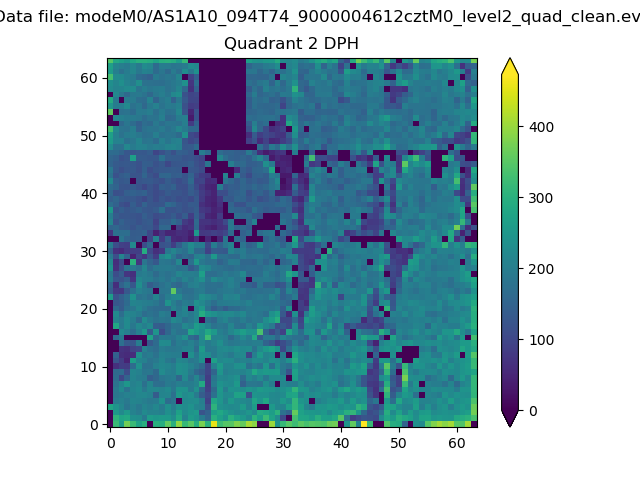
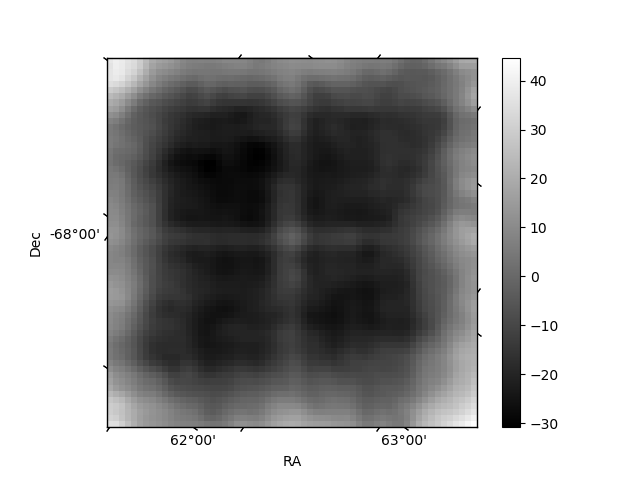
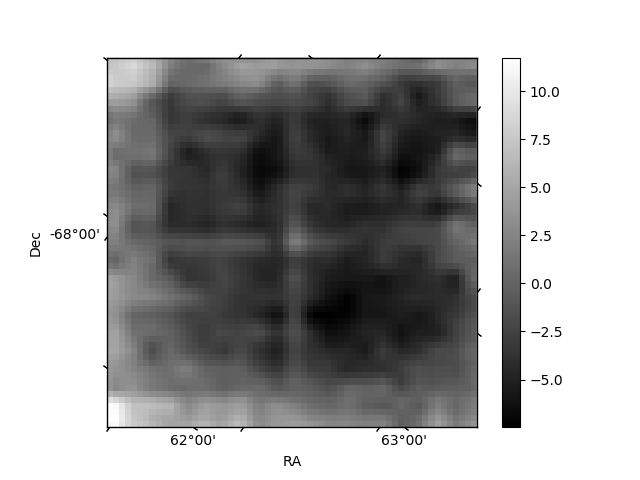
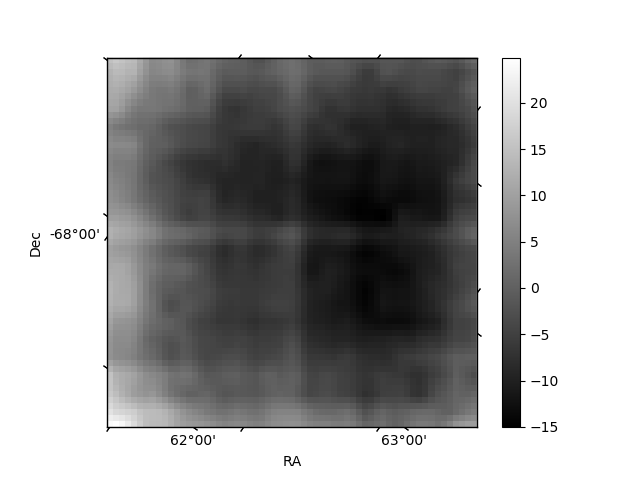
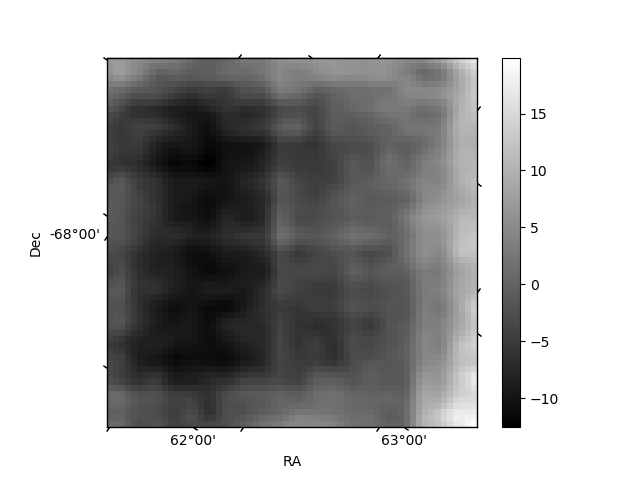
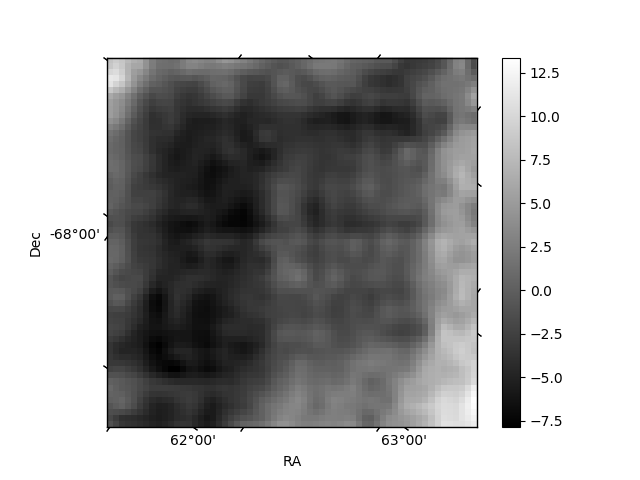
Histogram calculated using DETX and DETY for each event in the final _common_clean file
| Quadrant A | 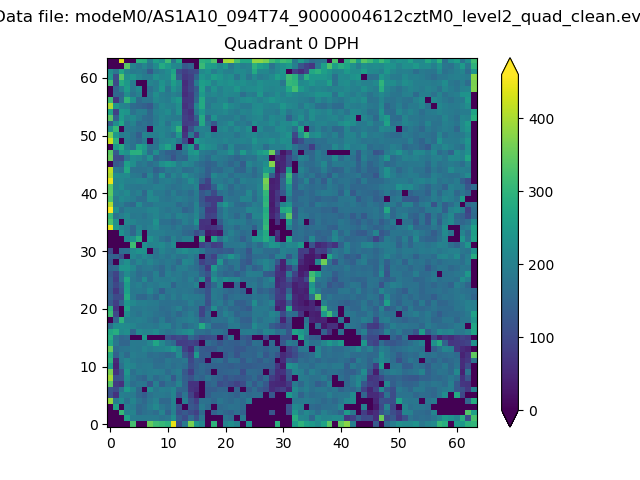 |
 |
Quadrant B |
|---|---|---|---|
| Quadrant D | 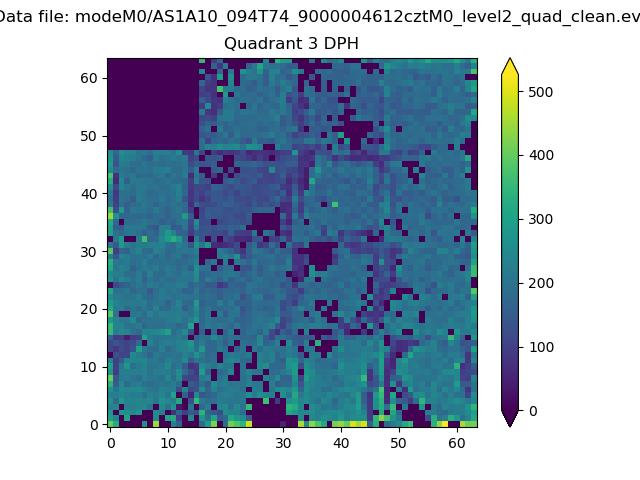 |
 |
Quadrant C |
| Plot type | Count rate plots | Images |
|---|---|---|
| Comparison with Poisson distribution Blue bars denote a histogram of data divided into 1 sec bins. Red curve is a Poisson curve with rate = median count rate of data. |
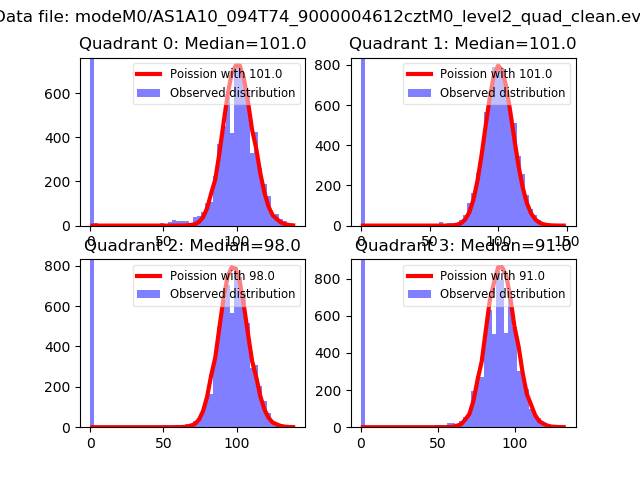 |
 |
| Quadrant-wise count rates Data is divided into 100 sec bins |
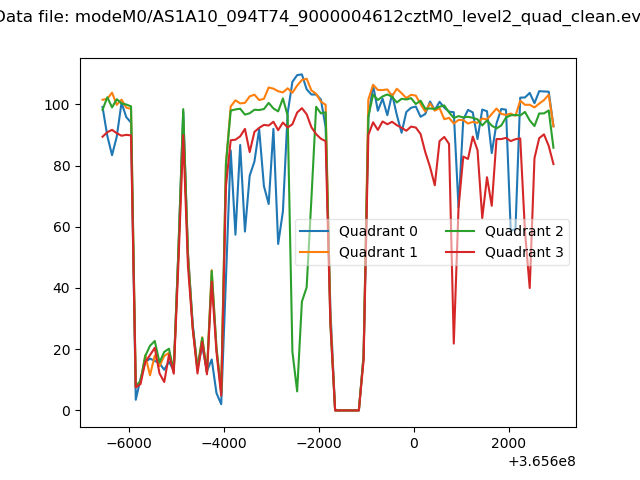 |
|
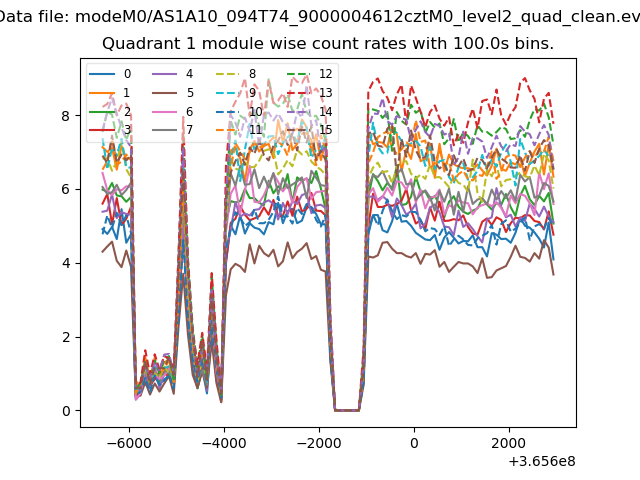
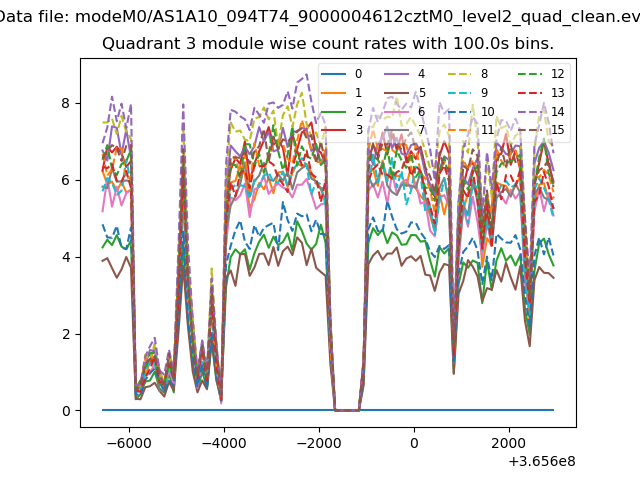
| Module-wise count rates for Quadrant A Data is divided into 100 sec bins |
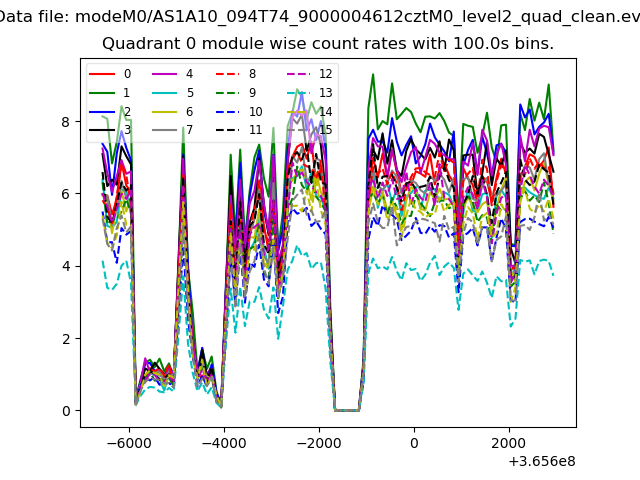 |
 |
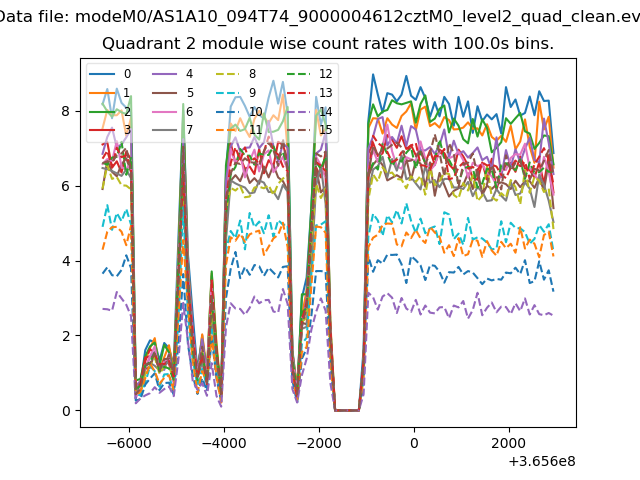
| Module-wise count rates for Quadrant B Data is divided into 100 sec bins |
 |
 |
| Module-wise count rates for Quadrant C Data is divided into 100 sec bins |
 |
 |
| Module-wise count rates for Quadrant D Data is divided into 100 sec bins |
 |
 |
| Parameter | Plot |
|---|---|
| CZT HV Monitor | 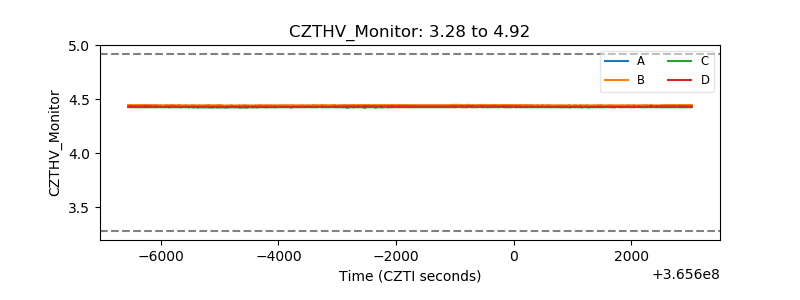 |
| D_VDD | 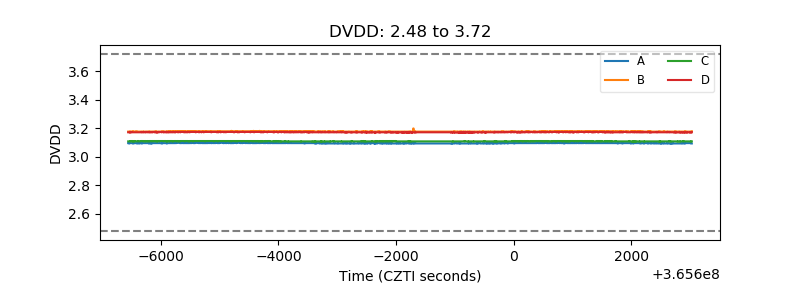 |
| Temperature 1 | 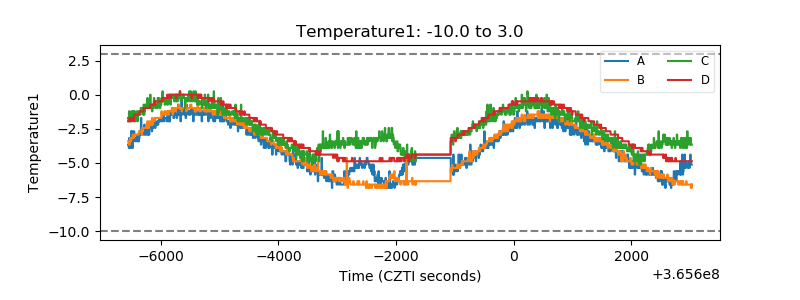 |
| Veto HV Monitor | 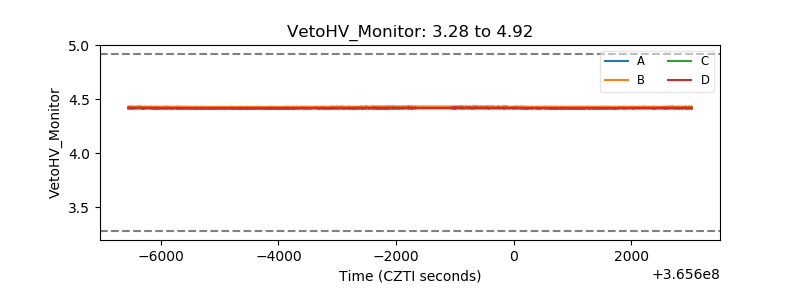 |
| Veto LLD | 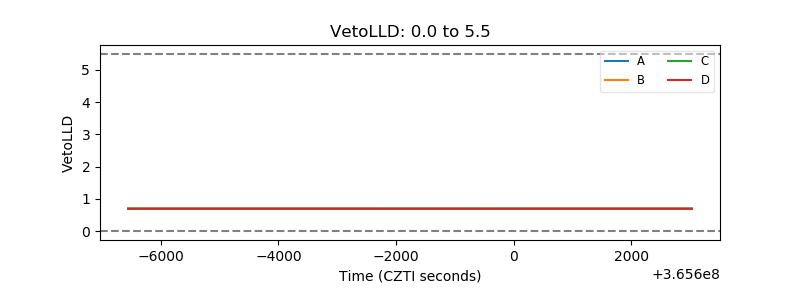 |
| Alpha Counter | 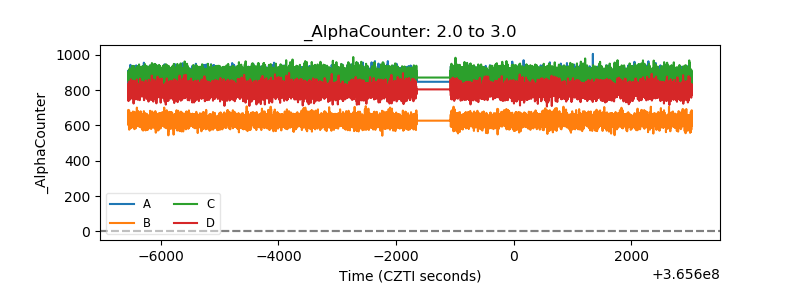 |
| _CPM_Rate | 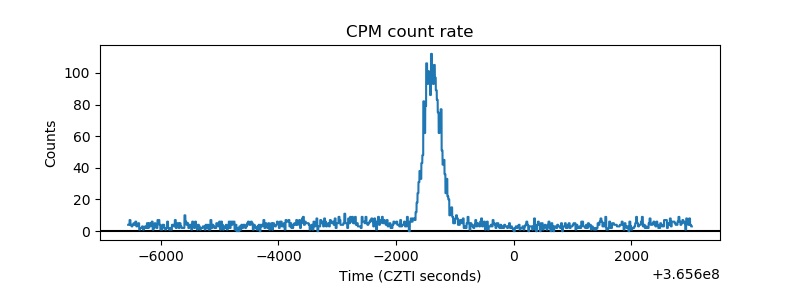 |
| CZT Counter | 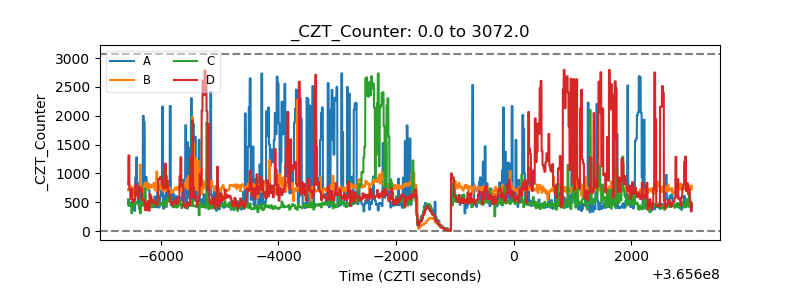 |
| +2.5 Volts monitor | 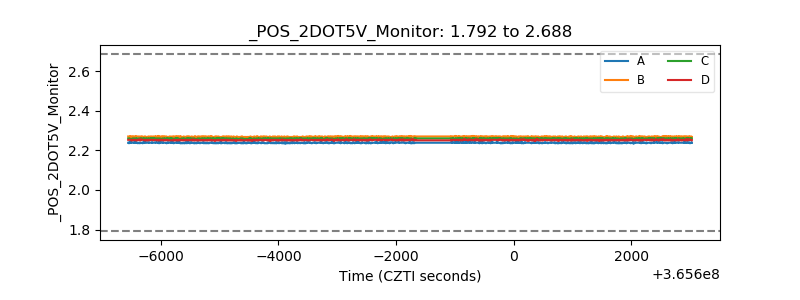 |
| +5 Volts monitor | 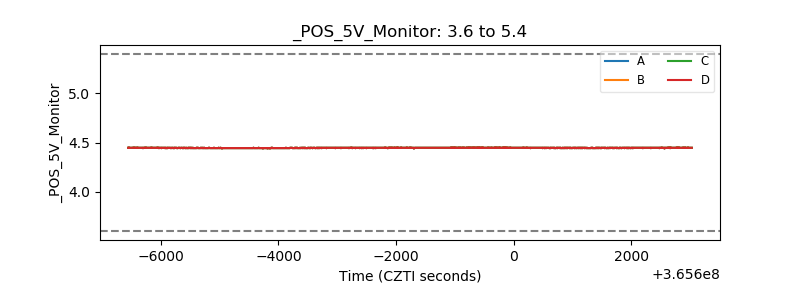 |
| _ROLL_ROT | 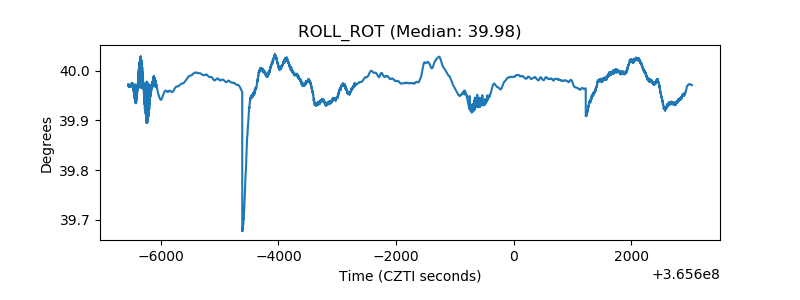 |
| _Roll_DEC | 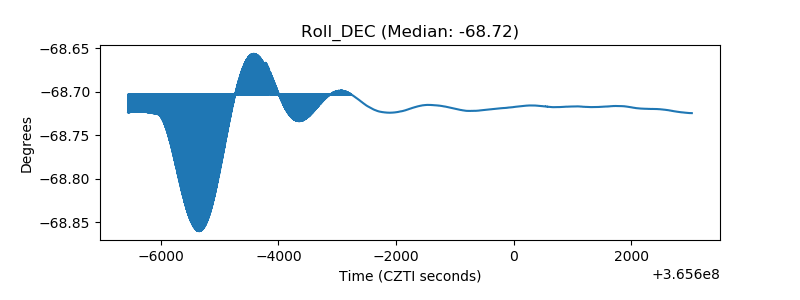 |
| _Roll_RA | 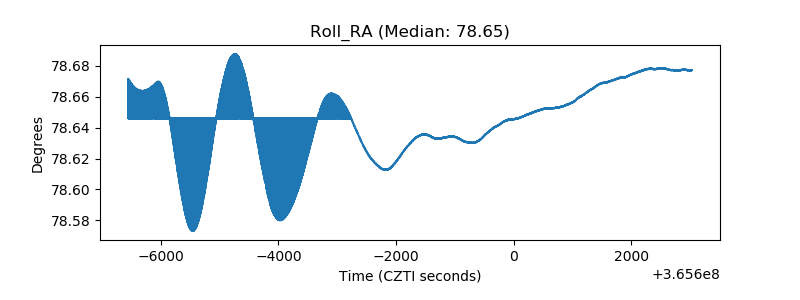 |
| Veto Counter | 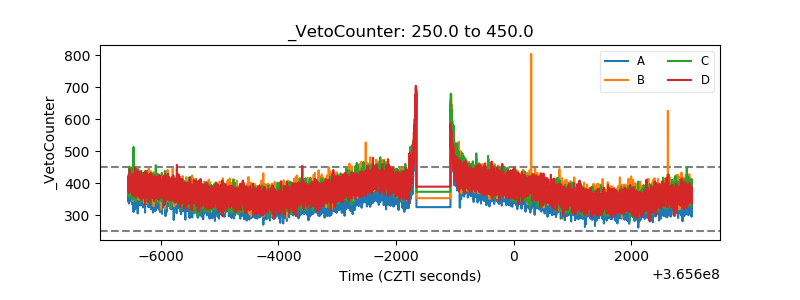 |