| Param | Original file | Final file |
|---|---|---|
| Filename | modeM0/AS1A10_094T74_9000004612_31609cztM0_level2.evt | modeM0/AS1A10_094T74_9000004612_31609cztM0_level2_quad_clean.evt |
| Size (bytes) | 908,403,840 | 160,525,440 |
| Size | 866.3 MB | 153.1 MB |
| Events in quadrant A | 7,529,880 | 1,026,916 |
| Events in quadrant B | 6,888,624 | 1,100,428 |
| Events in quadrant C | 5,173,585 | 1,069,069 |
| Events in quadrant D | 7,310,503 | 1,038,863 |
| Mode M9 | |||
|---|---|---|---|
| Quadrant | BADHDUFLAG | Total packets | Discarded packets |
| A | 0 | 5 | 0 |
| B | 0 | 5 | 0 |
| C | 0 | 5 | 0 |
| D | 0 | 5 | 0 |
| Mode M0 | |||
|---|---|---|---|
| Quadrant | BADHDUFLAG | Total packets | Discarded packets |
| A | 0 | 28468 | 1 |
| B | 0 | 27527 | 1 |
| C | 0 | 21334 | 1 |
| D | 0 | 27909 | 1 |
| Mode SS | |||
|---|---|---|---|
| Quadrant | BADHDUFLAG | Total packets | Discarded packets |
| A | 0 | 182 | 0 |
| B | 0 | 182 | 0 |
| C | 0 | 182 | 0 |
| D | 0 | 182 | 0 |
| Quadrant | Total seconds | Saturated seconds | Saturation percentage |
|---|---|---|---|
| A | 9014 | 1198 | 13.290437% |
| B | 9014 | 163 | 1.808298% |
| C | 9014 | 479 | 5.313956% |
| D | 9014 | 500 | 5.546927% |
Noise dominated data is calculated using 1-second bins in cleaned event files. If a bin has >2000 counts, and if more than 50% of those come from <1% of pixels, then it is considered to be noise-dominated and hence unusable.
| Quadrant | # 1 sec bins | Bins with >0 counts | Bins with >2000 counts | High rate bins dominated by noise | Noise dominated (total time) | Noise dominated (detector-on time) | Marked lightcurve |
|---|---|---|---|---|---|---|---|
| A | 9594 | 9014 | 890 | 890 | 9.28% | 9.87% | 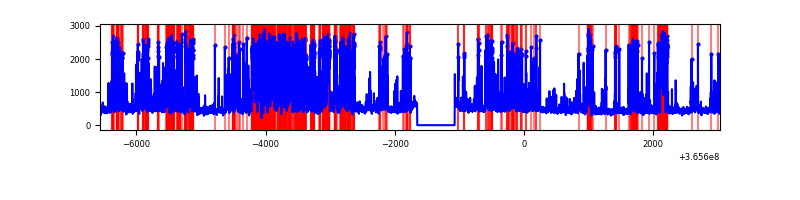 |
| B | 9594 | 9015 | 38 | 38 | 0.40% | 0.42% | 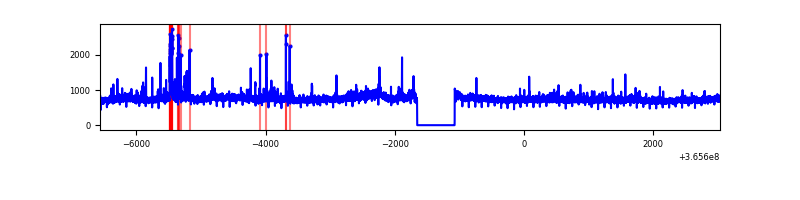 |
| C | 9594 | 9015 | 286 | 286 | 2.98% | 3.17% | 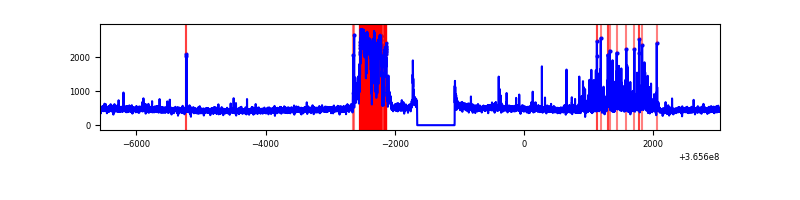 |
| D | 9594 | 9015 | 501 | 501 | 5.22% | 5.56% | 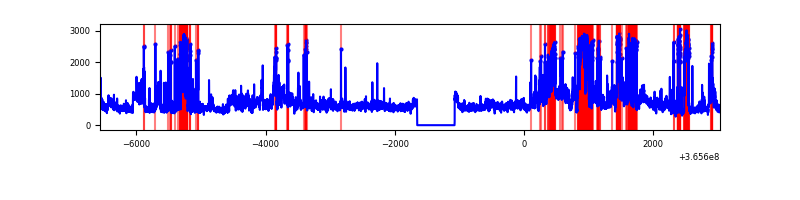 |
Top three noisy pixels from each quadrant. If the there are fewer than three noisy pixels in the level2.evt file, extra rows are filled as -1
| Pixel properties | Quadrant properties | ||||||
|---|---|---|---|---|---|---|---|
| Quadrant | DetID | PixID | Counts | Sigma | Mean | Median | Sigma |
| A | 0 | 13 | 3745231 | 18972.65 | 975 | 952 | 197.4 |
| A | 15 | 174 | 17749 | 85.11 | 975 | 952 | 197.4 |
| A | 13 | 254 | 16068 | 76.59 | 975 | 952 | 197.4 |
| B | 6 | 159 | 2506296 | 12901.79 | 1020 | 991 | 194.2 |
| B | 5 | 172 | 127852 | 653.31 | 1020 | 991 | 194.2 |
| B | 4 | 80 | 99976 | 509.75 | 1020 | 991 | 194.2 |
| C | 3 | 233 | 1145469 | 5028.95 | 972 | 978 | 227.6 |
| C | 14 | 238 | 163939 | 716.06 | 972 | 978 | 227.6 |
| C | 2 | 114 | 20547 | 85.98 | 972 | 978 | 227.6 |
| D | 8 | 195 | 1928726 | 8181.68 | 985 | 957 | 235.6 |
| D | 12 | 218 | 685579 | 2905.62 | 985 | 957 | 235.6 |
| D | 12 | 233 | 290633 | 1229.42 | 985 | 957 | 235.6 |
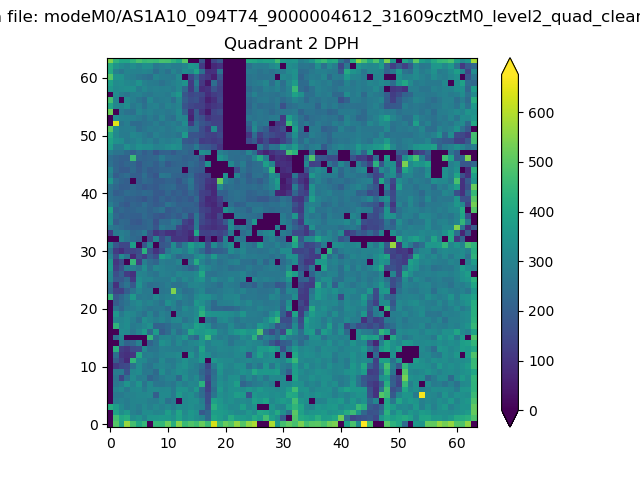
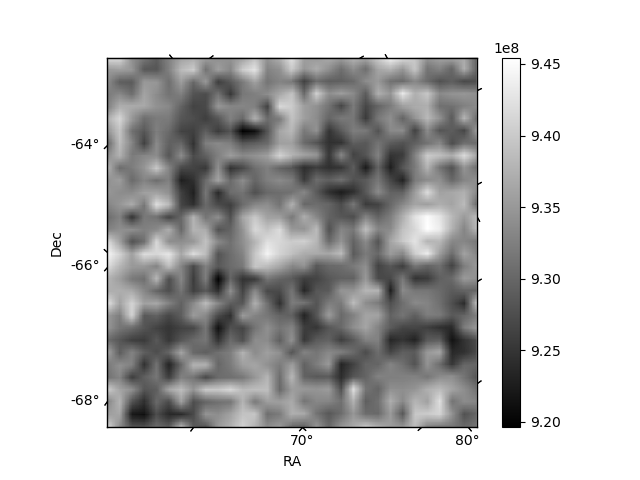
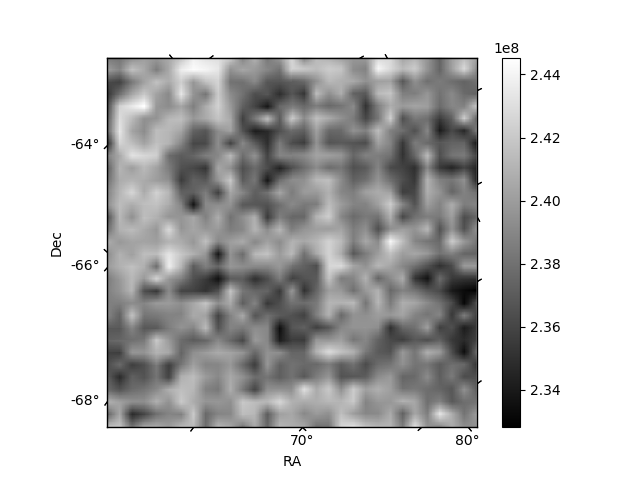
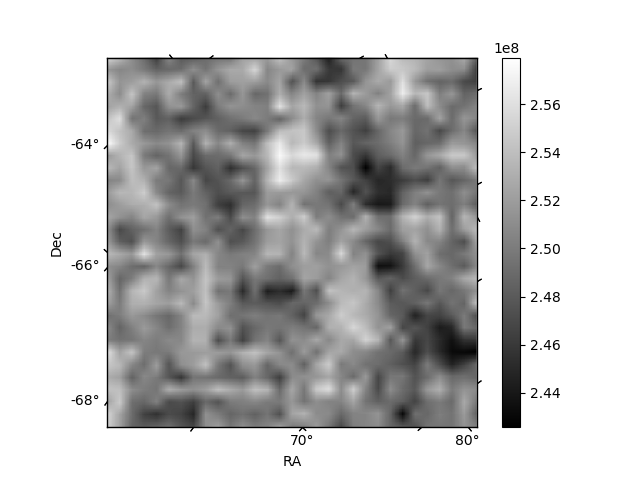
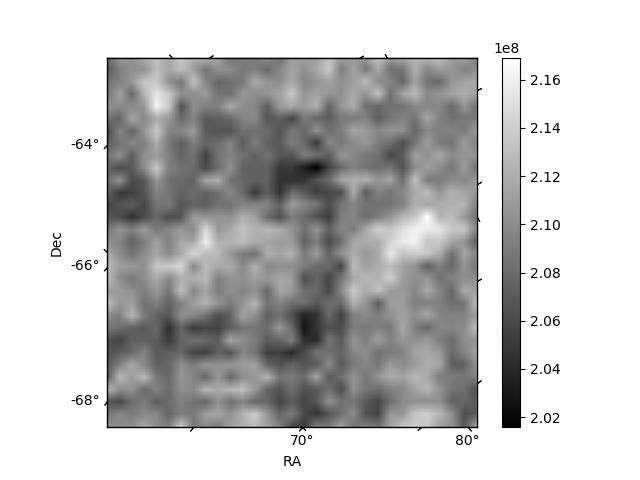
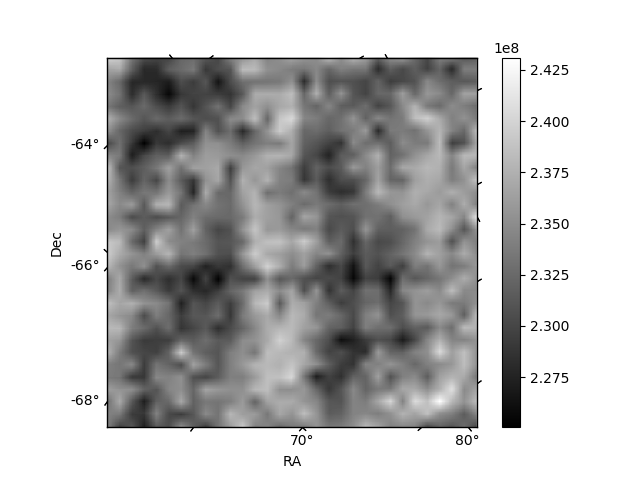
Histogram calculated using DETX and DETY for each event in the final _common_clean file
| Quadrant A | 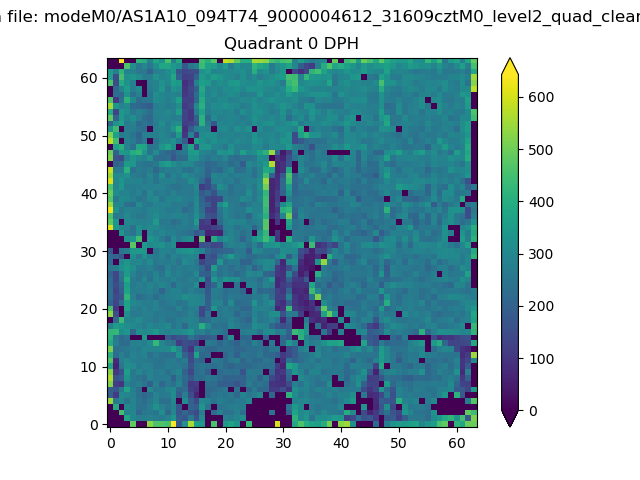 |
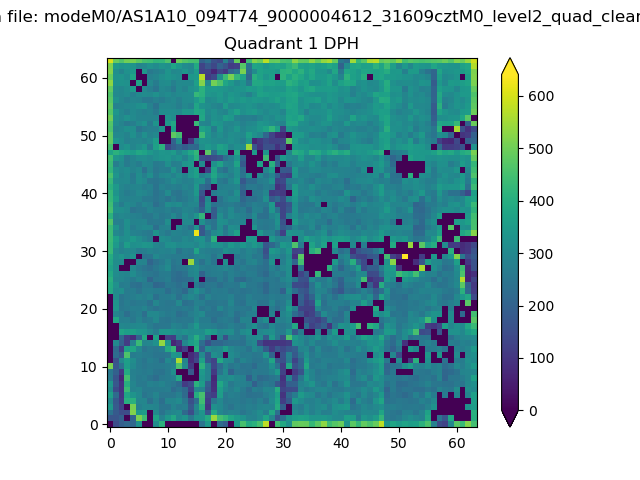 |
Quadrant B |
|---|---|---|---|
| Quadrant D | 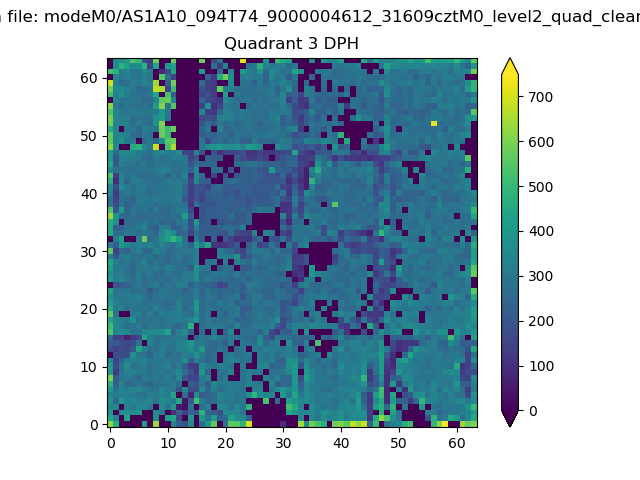 |
 |
Quadrant C |
| Plot type | Count rate plots | Images |
|---|---|---|
| Comparison with Poisson distribution Blue bars denote a histogram of data divided into 1 sec bins. Red curve is a Poisson curve with rate = median count rate of data. |
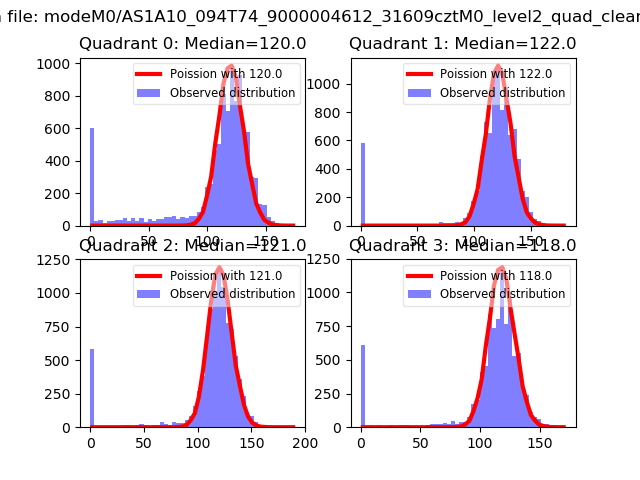 |
 |
| Quadrant-wise count rates Data is divided into 100 sec bins |
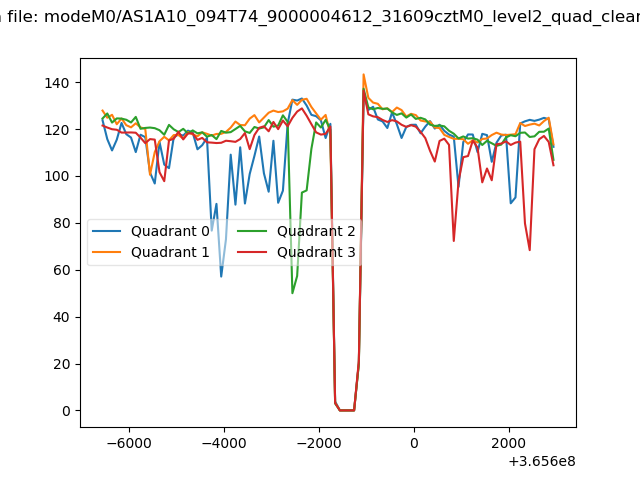 |
|
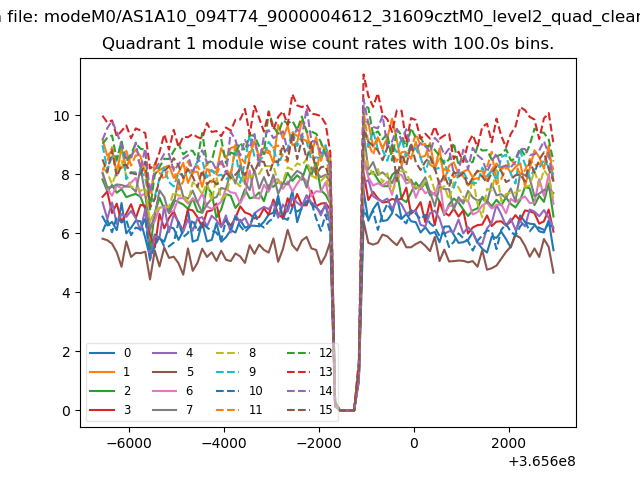
| Module-wise count rates for Quadrant A Data is divided into 100 sec bins |
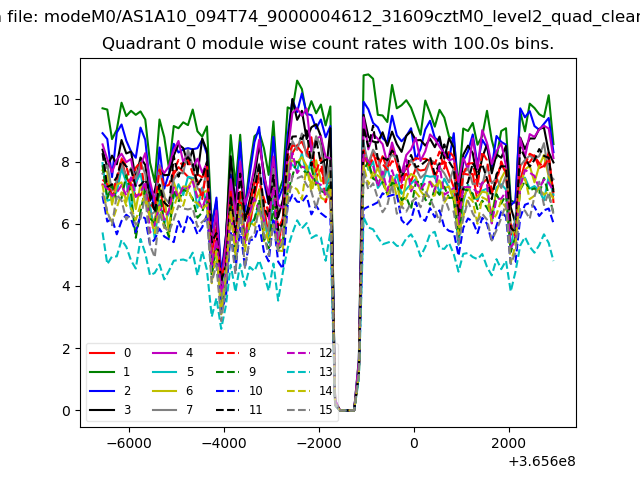 |
 |
| Module-wise count rates for Quadrant B Data is divided into 100 sec bins |
 |
 |
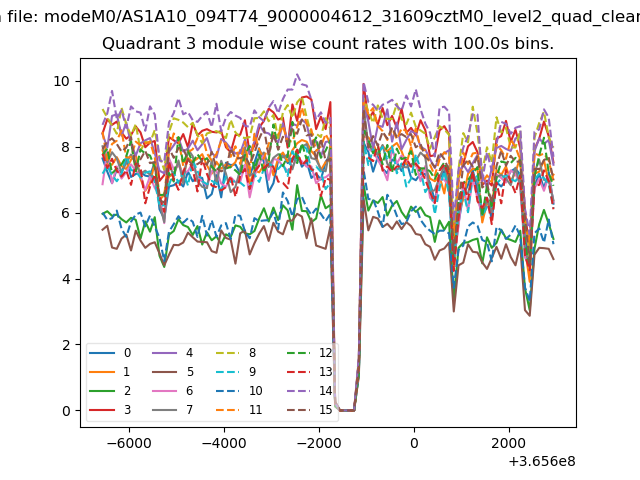
| Module-wise count rates for Quadrant C Data is divided into 100 sec bins |
 |
 |
| Module-wise count rates for Quadrant D Data is divided into 100 sec bins |
 |
 |
| Parameter | Plot |
|---|---|
| CZT HV Monitor | 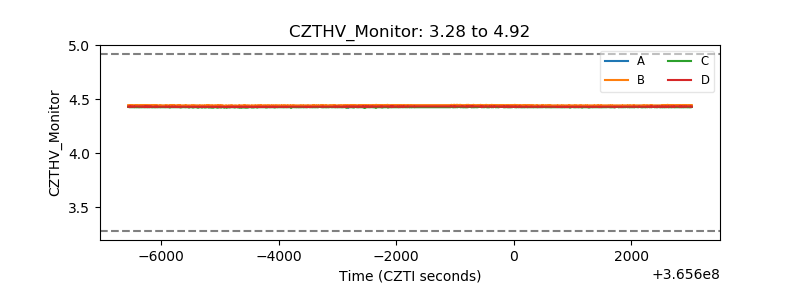 |
| D_VDD | 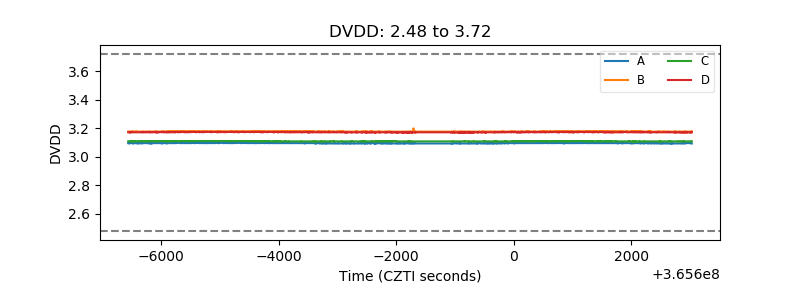 |
| Temperature 1 | 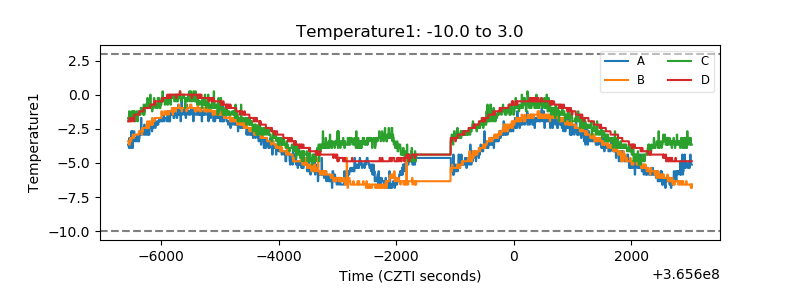 |
| Veto HV Monitor | 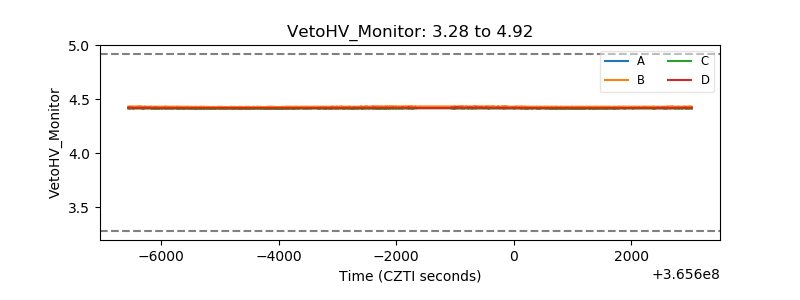 |
| Veto LLD | 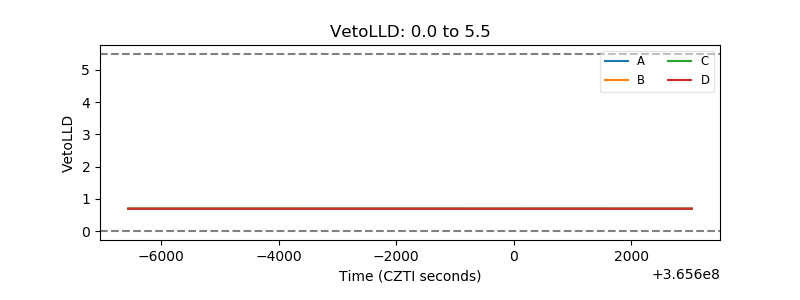 |
| Alpha Counter | 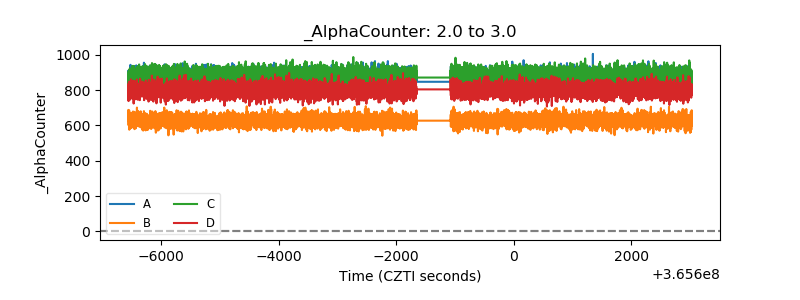 |
| _CPM_Rate | 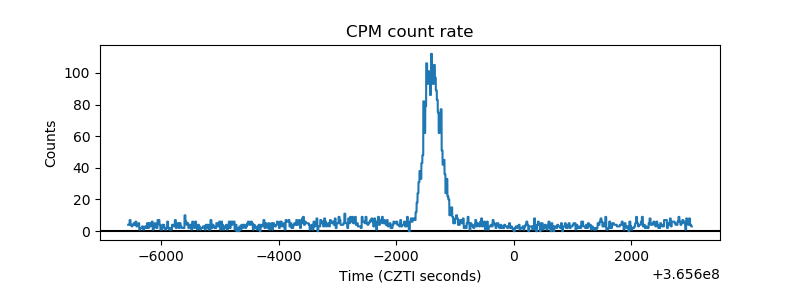 |
| CZT Counter | 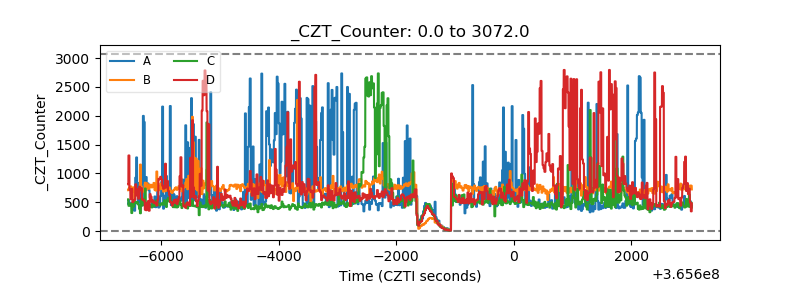 |
| +2.5 Volts monitor |  |
| +5 Volts monitor | 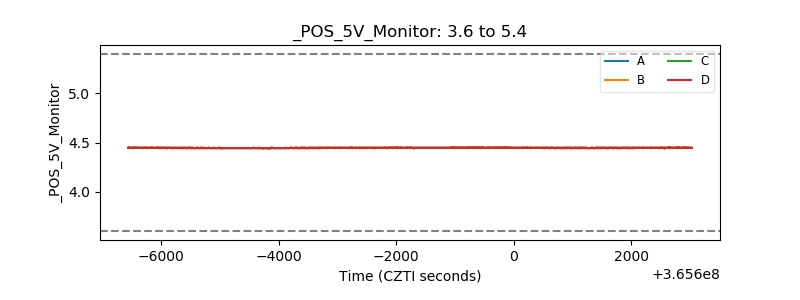 |
| _ROLL_ROT | 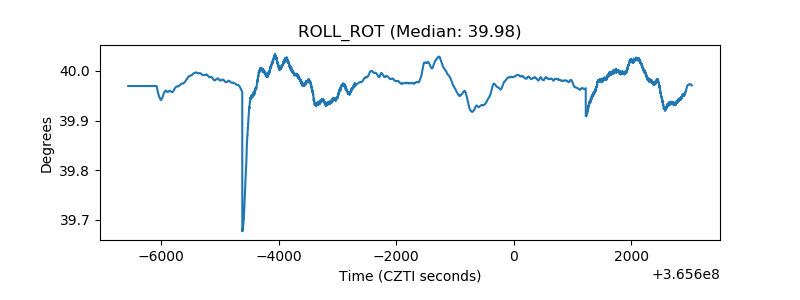 |
| _Roll_DEC | 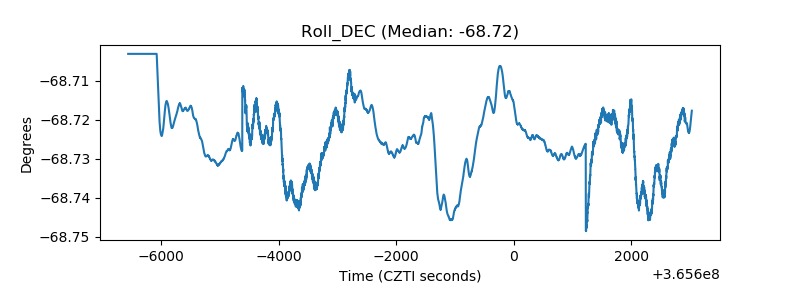 |
| _Roll_RA | 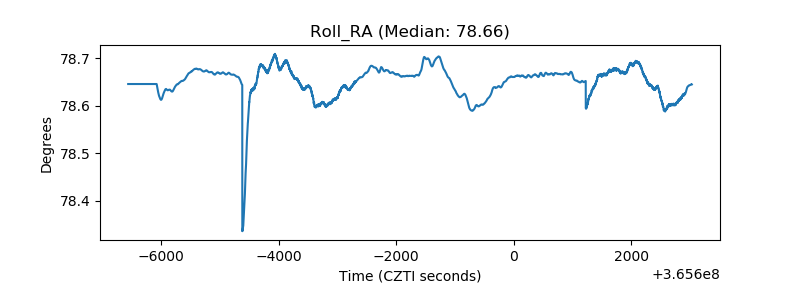 |
| Veto Counter | 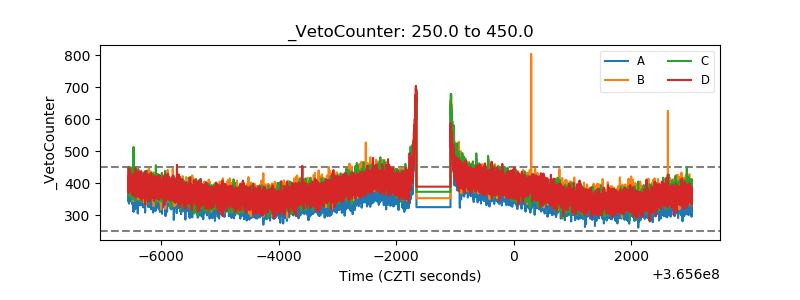 |