| Param | Original file | Final file |
|---|---|---|
| Filename | modeM0/AS1A10_094T75_9000004614_31607cztM0_level2.evt | modeM0/AS1A10_094T75_9000004614_31607cztM0_level2_quad_clean.evt |
| Size (bytes) | 85,639,680 | 18,774,720 |
| Size | 81.7 MB | 17.9 MB |
| Events in quadrant A | 682,599 | 117,373 |
| Events in quadrant B | 787,751 | 128,133 |
| Events in quadrant C | 572,518 | 122,845 |
| Events in quadrant D | 480,846 | 123,791 |
| Mode M0 | |||
|---|---|---|---|
| Quadrant | BADHDUFLAG | Total packets | Discarded packets |
| A | 0 | 2618 | 0 |
| B | 0 | 2987 | 0 |
| C | 0 | 2247 | 0 |
| D | 0 | 2004 | 0 |
| Mode SS | |||
|---|---|---|---|
| Quadrant | BADHDUFLAG | Total packets | Discarded packets |
| A | 0 | 18 | 0 |
| B | 0 | 18 | 0 |
| C | 0 | 18 | 0 |
| D | 0 | 18 | 0 |
| Quadrant | Total seconds | Saturated seconds | Saturation percentage |
|---|---|---|---|
| A | 989 | 110 | 11.122346% |
| B | 989 | 2 | 0.202224% |
| C | 989 | 34 | 3.437816% |
| D | 989 | 0 | 0.000000% |
Noise dominated data is calculated using 1-second bins in cleaned event files. If a bin has >2000 counts, and if more than 50% of those come from <1% of pixels, then it is considered to be noise-dominated and hence unusable.
| Quadrant | # 1 sec bins | Bins with >0 counts | Bins with >2000 counts | High rate bins dominated by noise | Noise dominated (total time) | Noise dominated (detector-on time) | Marked lightcurve |
|---|---|---|---|---|---|---|---|
| A | 989 | 989 | 99 | 99 | 10.01% | 10.01% | 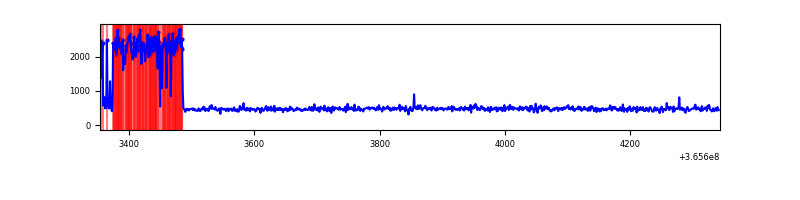 |
| B | 989 | 989 | 0 | 0 | 0.00% | 0.00% | 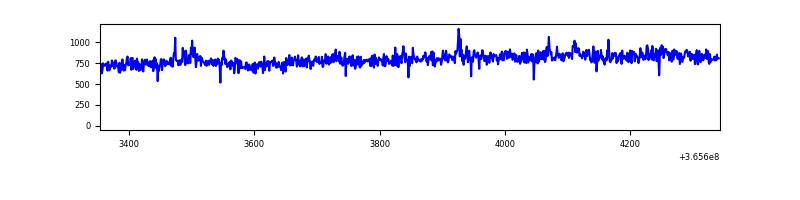 |
| C | 989 | 989 | 21 | 21 | 2.12% | 2.12% |  |
| D | 989 | 989 | 0 | 0 | 0.00% | 0.00% | 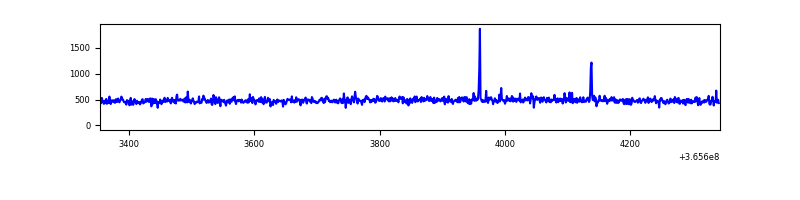 |
Top three noisy pixels from each quadrant. If the there are fewer than three noisy pixels in the level2.evt file, extra rows are filled as -1
| Pixel properties | Quadrant properties | ||||||
|---|---|---|---|---|---|---|---|
| Quadrant | DetID | PixID | Counts | Sigma | Mean | Median | Sigma |
| A | 0 | 13 | 247095 | 9841.67 | 111 | 109 | 25.1 |
| A | 15 | 174 | 3251 | 125.2 | 111 | 109 | 25.1 |
| A | 13 | 254 | 1720 | 64.19 | 111 | 109 | 25.1 |
| B | 6 | 159 | 292448 | 11425.73 | 121 | 118 | 25.6 |
| B | 4 | 80 | 7186 | 276.25 | 121 | 118 | 25.6 |
| B | 0 | 229 | 4668 | 177.84 | 121 | 118 | 25.6 |
| C | 12 | 175 | 74436 | 2426.3 | 120 | 120 | 30.6 |
| C | 14 | 238 | 19413 | 629.89 | 120 | 120 | 30.6 |
| C | 3 | 233 | 5665 | 181.04 | 120 | 120 | 30.6 |
| D | 8 | 195 | 20274 | 651.74 | 119 | 116 | 30.9 |
| D | 2 | 234 | 4283 | 134.73 | 119 | 116 | 30.9 |
| D | 2 | 120 | 3234 | 100.81 | 119 | 116 | 30.9 |
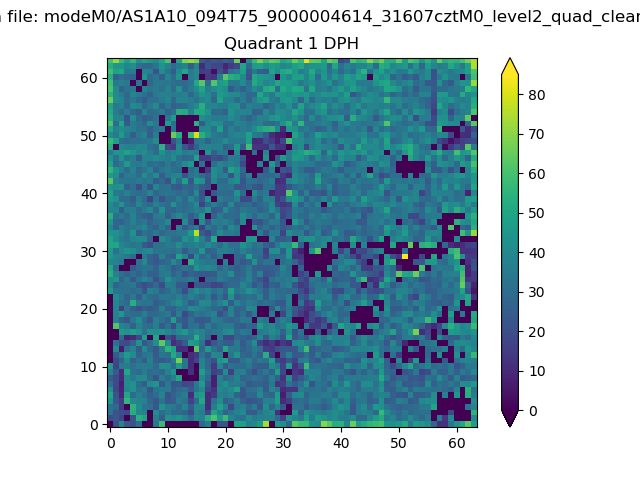
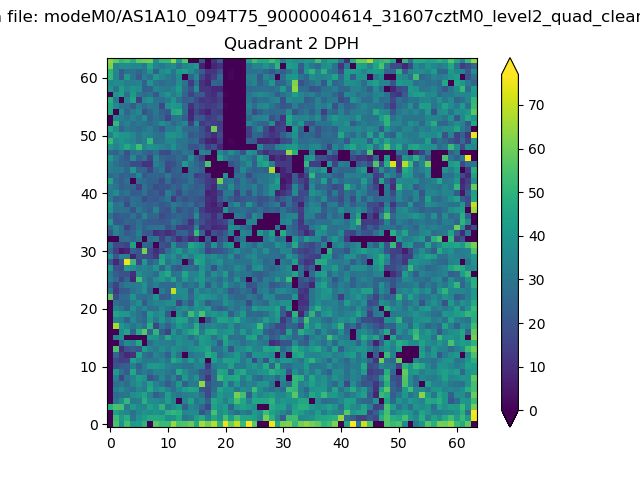
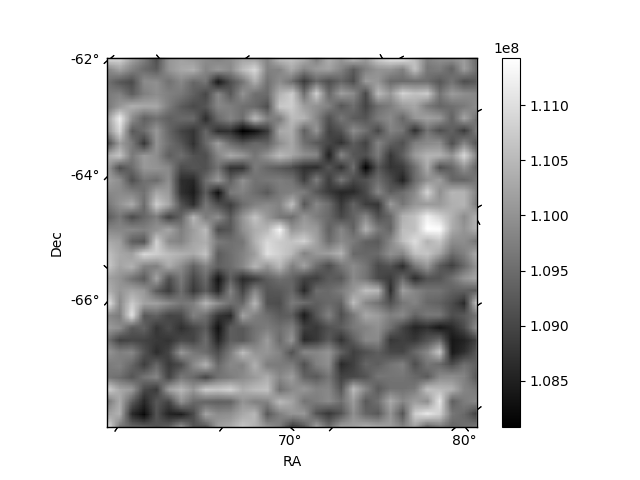
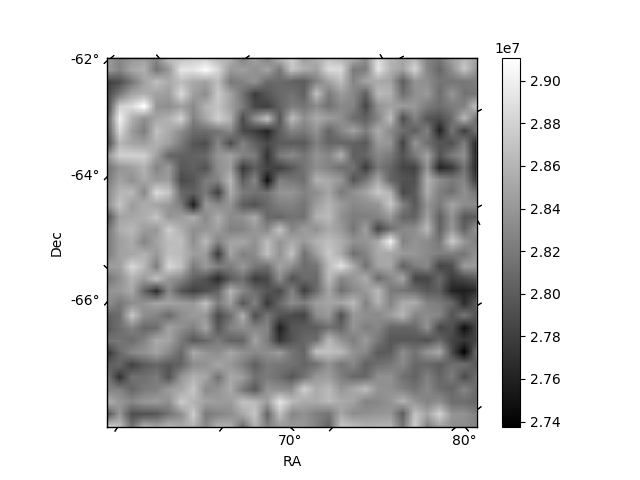
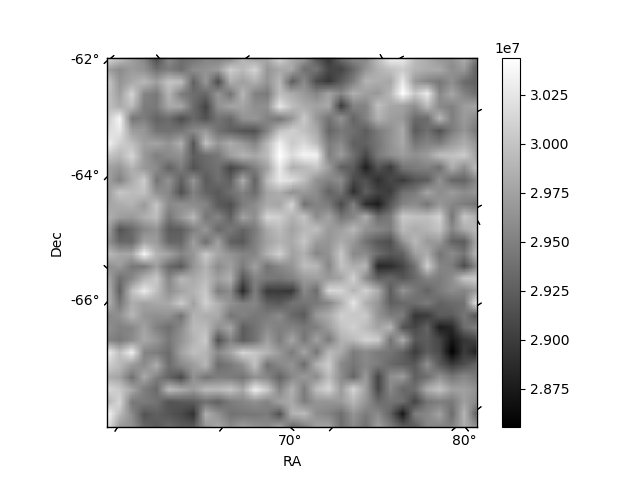
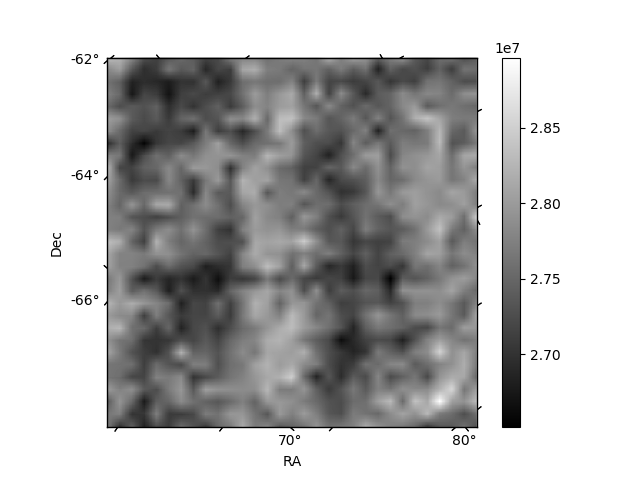
Histogram calculated using DETX and DETY for each event in the final _common_clean file
| Quadrant A | 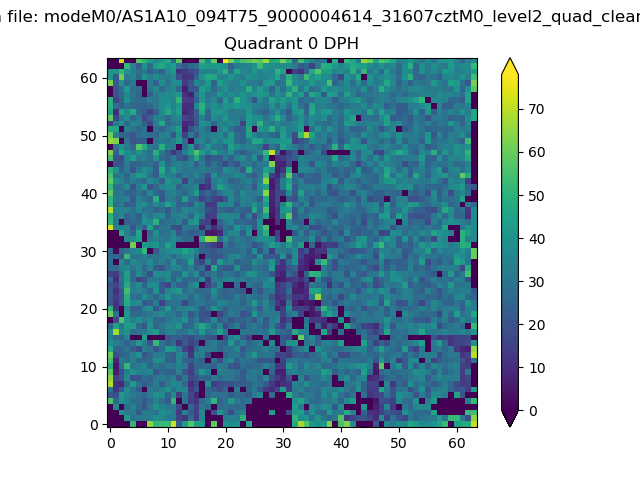 |
 |
Quadrant B |
|---|---|---|---|
| Quadrant D | 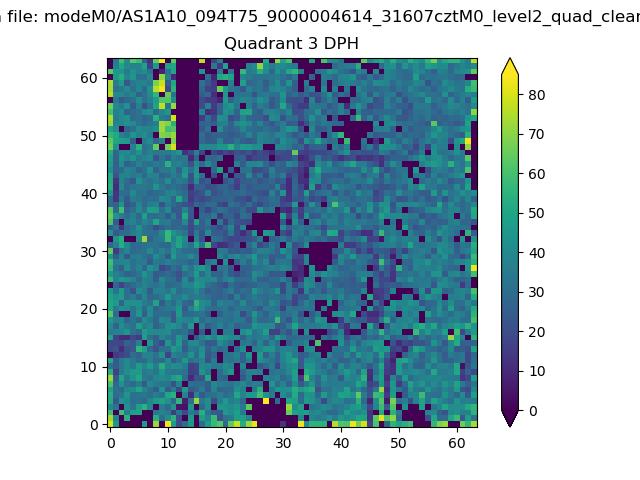 |
 |
Quadrant C |
| Plot type | Count rate plots | Images |
|---|---|---|
| Comparison with Poisson distribution Blue bars denote a histogram of data divided into 1 sec bins. Red curve is a Poisson curve with rate = median count rate of data. |
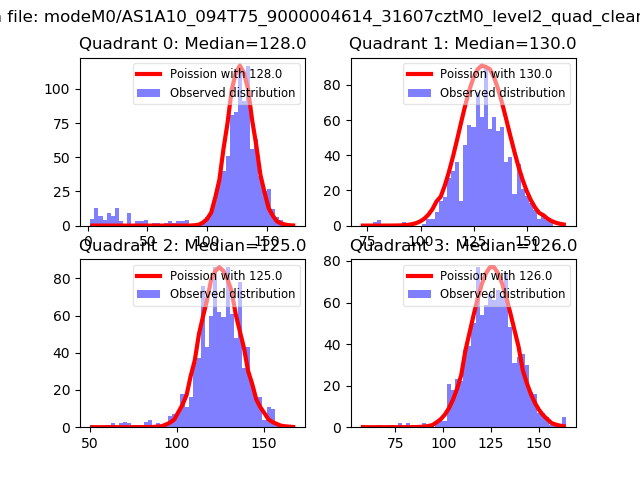 |
 |
| Quadrant-wise count rates Data is divided into 100 sec bins |
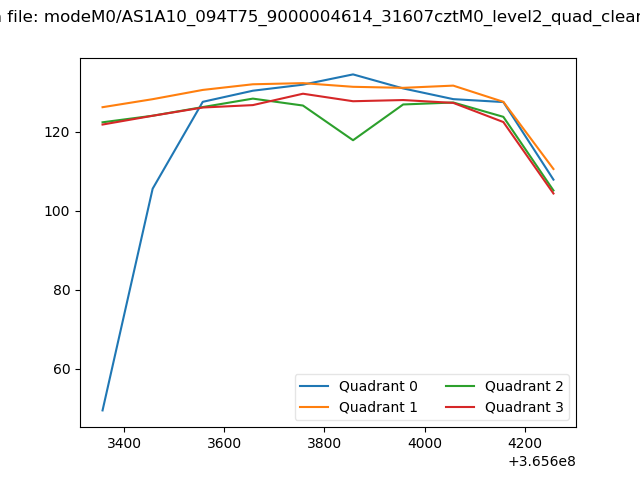 |
|
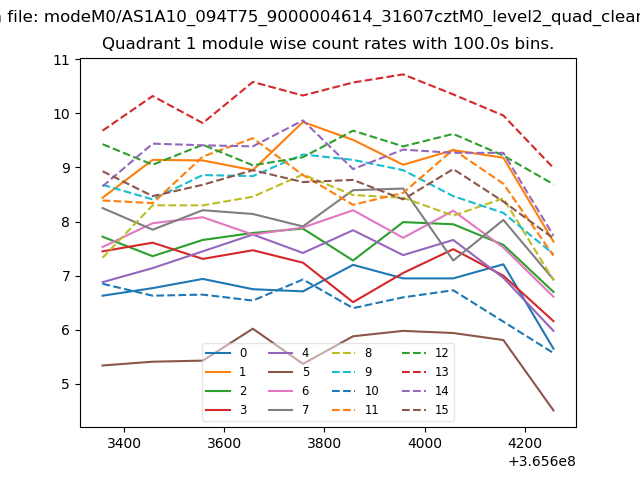
| Module-wise count rates for Quadrant A Data is divided into 100 sec bins |
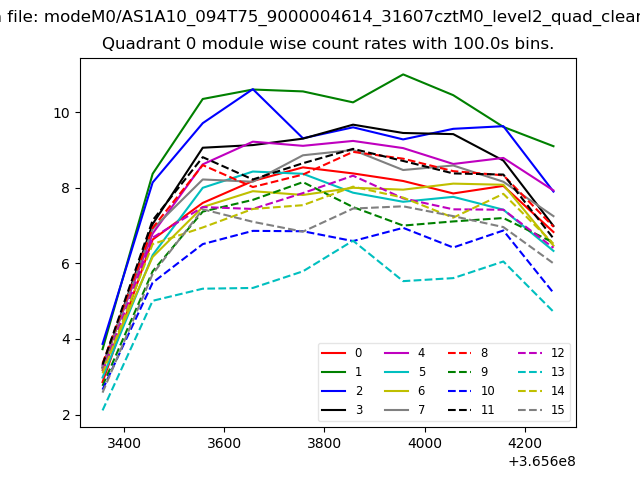 |
 |
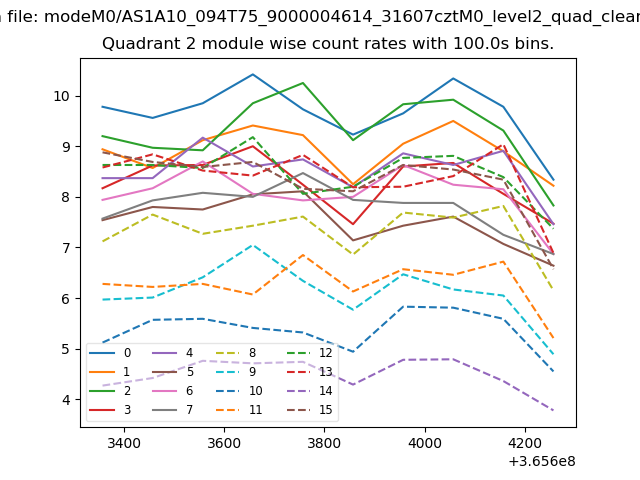
| Module-wise count rates for Quadrant B Data is divided into 100 sec bins |
 |
 |
| Module-wise count rates for Quadrant C Data is divided into 100 sec bins |
 |
 |
| Module-wise count rates for Quadrant D Data is divided into 100 sec bins |
 |
 |
| Parameter | Plot |
|---|---|
| CZT HV Monitor | 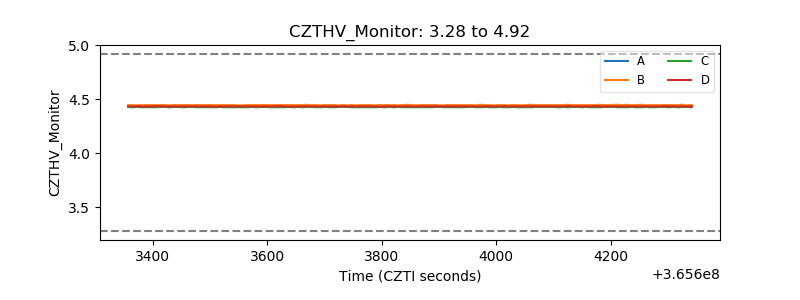 |
| D_VDD | 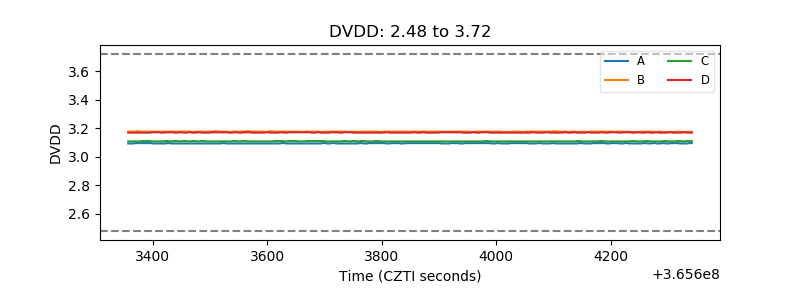 |
| Temperature 1 | 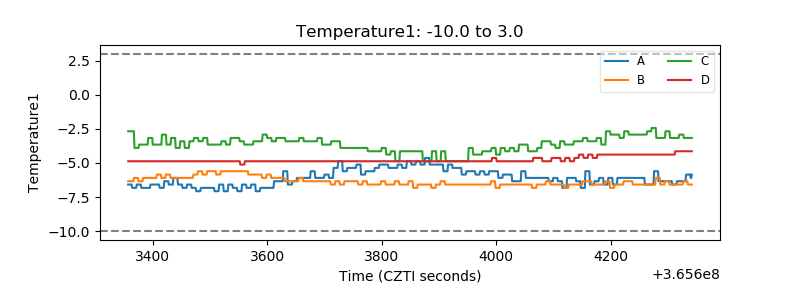 |
| Veto HV Monitor | 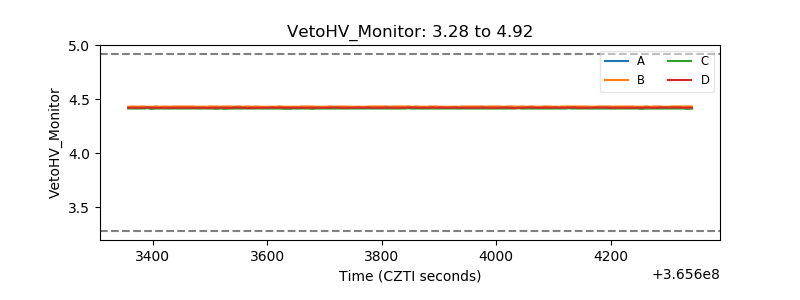 |
| Veto LLD |  |
| Alpha Counter | 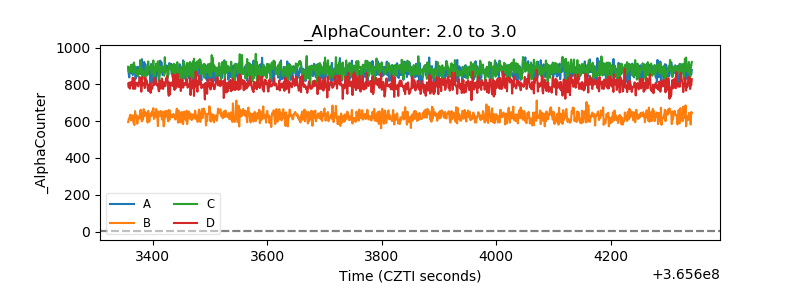 |
| _CPM_Rate | 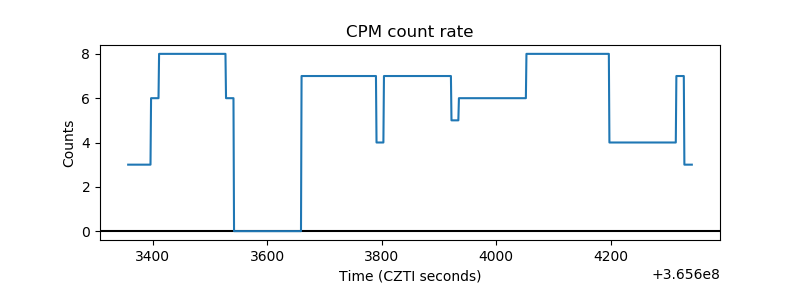 |
| CZT Counter | 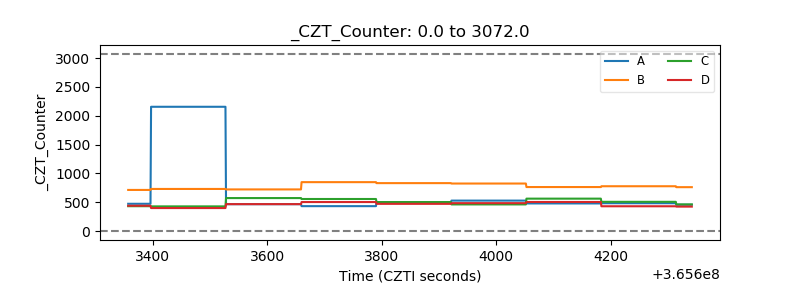 |
| +2.5 Volts monitor |  |
| +5 Volts monitor |  |
| _ROLL_ROT |  |
| _Roll_DEC |  |
| _Roll_RA | 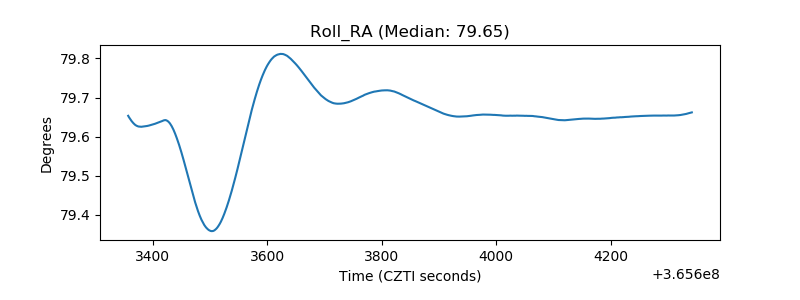 |
| Veto Counter | 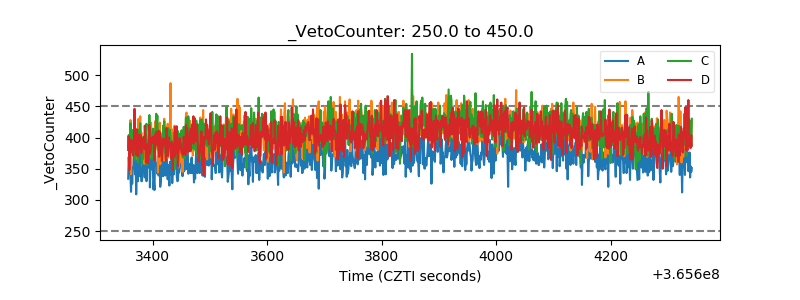 |