| Param | Original file | Final file |
|---|---|---|
| Filename | modeM0/AS1A10_094T75_9000004614_31609cztM0_level2.evt | modeM0/AS1A10_094T75_9000004614_31609cztM0_level2_quad_clean.evt |
| Size (bytes) | 682,505,280 | 131,316,480 |
| Size | 650.9 MB | 125.2 MB |
| Events in quadrant A | 5,241,181 | 835,147 |
| Events in quadrant B | 5,551,867 | 912,233 |
| Events in quadrant C | 3,524,127 | 900,432 |
| Events in quadrant D | 5,867,400 | 829,508 |
| Mode M9 | |||
|---|---|---|---|
| Quadrant | BADHDUFLAG | Total packets | Discarded packets |
| A | 0 | 7 | 0 |
| B | 0 | 7 | 0 |
| C | 0 | 7 | 0 |
| D | 0 | 7 | 0 |
| Mode M0 | |||
|---|---|---|---|
| Quadrant | BADHDUFLAG | Total packets | Discarded packets |
| A | 0 | 20485 | 1 |
| B | 0 | 22064 | 2 |
| C | 0 | 15182 | 1 |
| D | 0 | 21935 | 1 |
| Mode SS | |||
|---|---|---|---|
| Quadrant | BADHDUFLAG | Total packets | Discarded packets |
| A | 0 | 146 | 0 |
| B | 0 | 146 | 0 |
| C | 0 | 146 | 0 |
| D | 0 | 146 | 0 |
| Quadrant | Total seconds | Saturated seconds | Saturation percentage |
|---|---|---|---|
| A | 7169 | 1013 | 14.130283% |
| B | 7168 | 142 | 1.981027% |
| C | 7168 | 99 | 1.381138% |
| D | 7168 | 825 | 11.509487% |
Noise dominated data is calculated using 1-second bins in cleaned event files. If a bin has >2000 counts, and if more than 50% of those come from <1% of pixels, then it is considered to be noise-dominated and hence unusable.
| Quadrant | # 1 sec bins | Bins with >0 counts | Bins with >2000 counts | High rate bins dominated by noise | Noise dominated (total time) | Noise dominated (detector-on time) | Marked lightcurve |
|---|---|---|---|---|---|---|---|
| A | 11454 | 7171 | 629 | 629 | 5.49% | 8.77% | 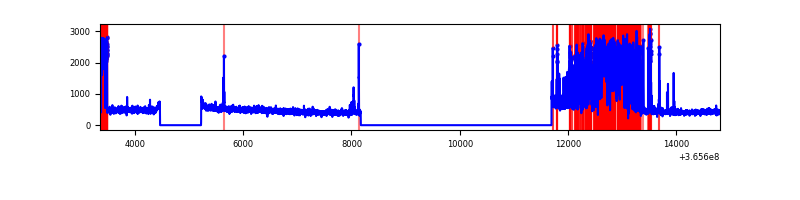 |
| B | 11454 | 7170 | 52 | 52 | 0.45% | 0.73% | 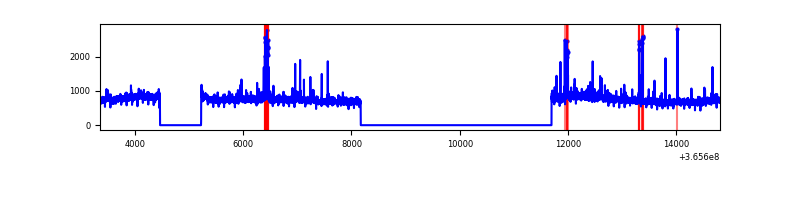 |
| C | 11454 | 7170 | 22 | 22 | 0.19% | 0.31% | 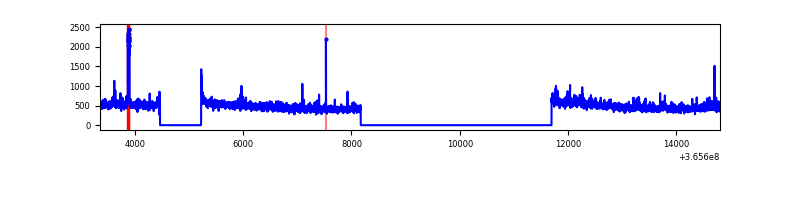 |
| D | 11454 | 7170 | 694 | 694 | 6.06% | 9.68% | 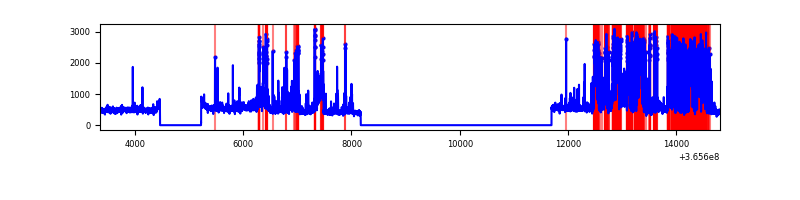 |
Top three noisy pixels from each quadrant. If the there are fewer than three noisy pixels in the level2.evt file, extra rows are filled as -1
| Pixel properties | Quadrant properties | ||||||
|---|---|---|---|---|---|---|---|
| Quadrant | DetID | PixID | Counts | Sigma | Mean | Median | Sigma |
| A | 0 | 13 | 2216473 | 14255.86 | 777 | 761 | 155.4 |
| A | 15 | 174 | 13820 | 84.02 | 777 | 761 | 155.4 |
| A | 13 | 254 | 13427 | 81.49 | 777 | 761 | 155.4 |
| B | 6 | 159 | 1933786 | 12182.34 | 833 | 811 | 158.7 |
| B | 0 | 229 | 129450 | 810.73 | 833 | 811 | 158.7 |
| B | 4 | 80 | 66682 | 415.14 | 833 | 811 | 158.7 |
| C | 3 | 233 | 135938 | 721.23 | 804 | 807 | 187.4 |
| C | 14 | 238 | 134857 | 715.46 | 804 | 807 | 187.4 |
| C | 12 | 175 | 75274 | 397.45 | 804 | 807 | 187.4 |
| D | 12 | 218 | 1992474 | 10674.14 | 773 | 749 | 186.6 |
| D | 8 | 195 | 293082 | 1566.68 | 773 | 749 | 186.6 |
| D | 12 | 233 | 222889 | 1190.5 | 773 | 749 | 186.6 |
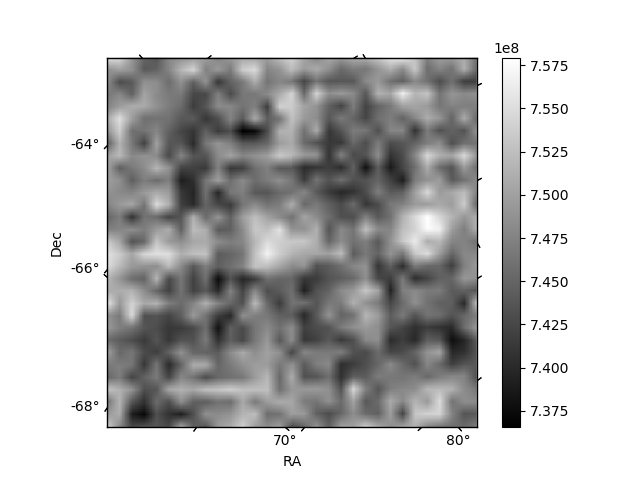
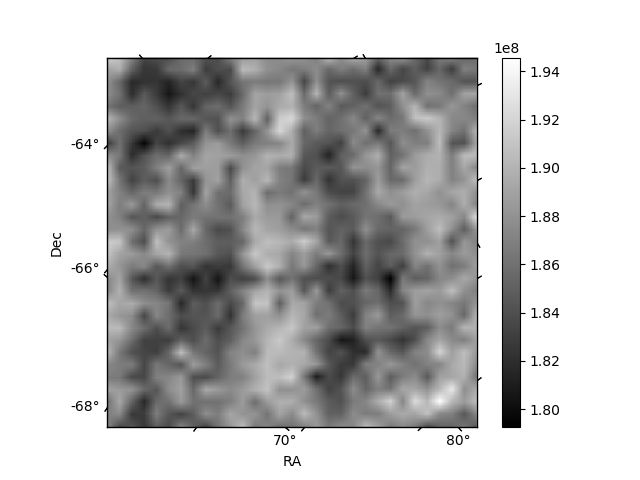
Histogram calculated using DETX and DETY for each event in the final _common_clean file
| Quadrant A | 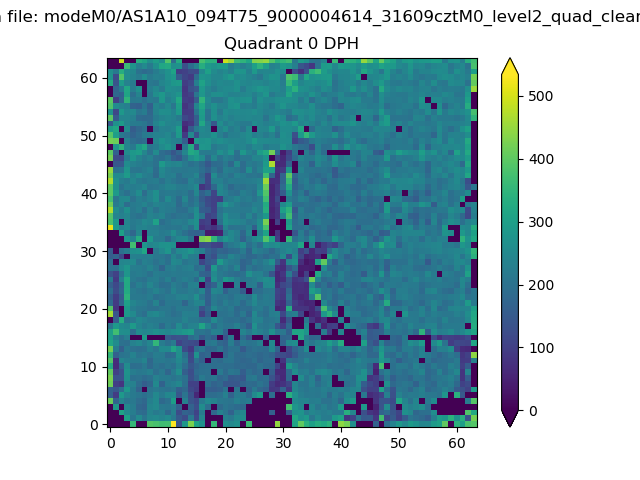 |
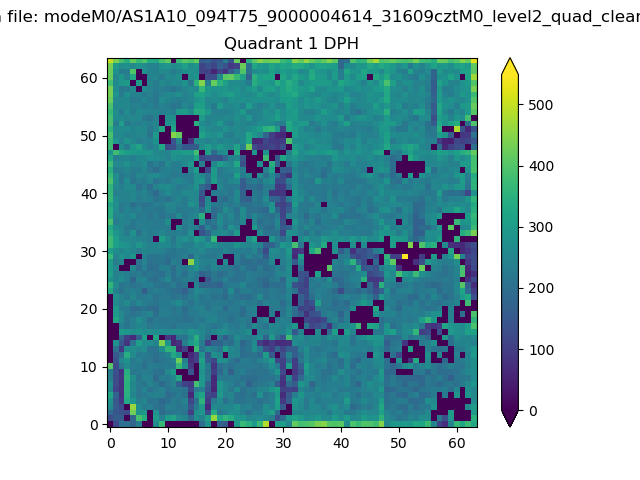 |
Quadrant B |
|---|---|---|---|
| Quadrant D | 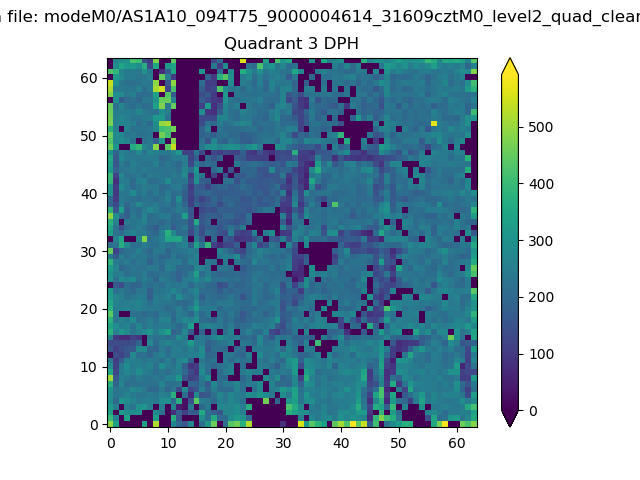 |
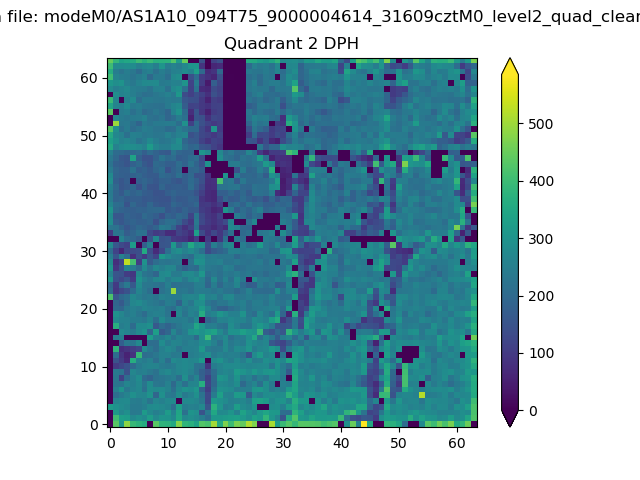 |
Quadrant C |
| Plot type | Count rate plots | Images |
|---|---|---|
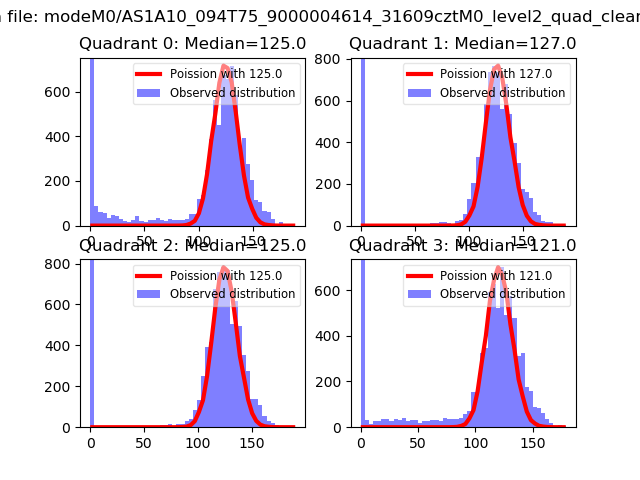
| Comparison with Poisson distribution Blue bars denote a histogram of data divided into 1 sec bins. Red curve is a Poisson curve with rate = median count rate of data. |
 |
 |
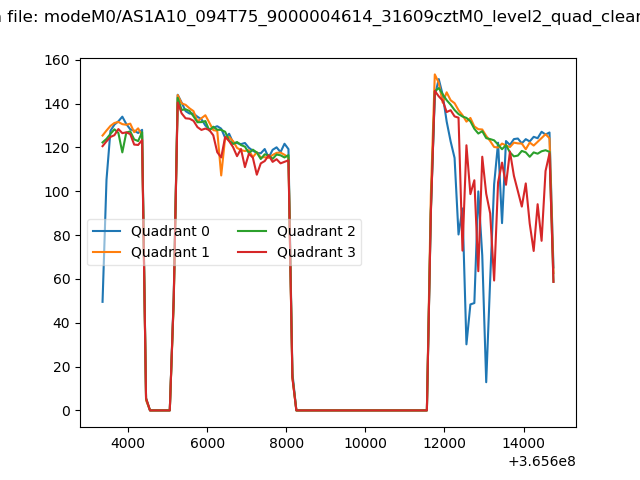
| Quadrant-wise count rates Data is divided into 100 sec bins |
 |
|
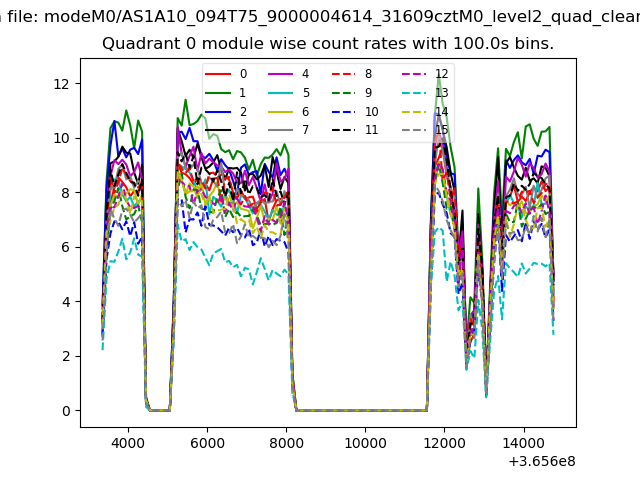
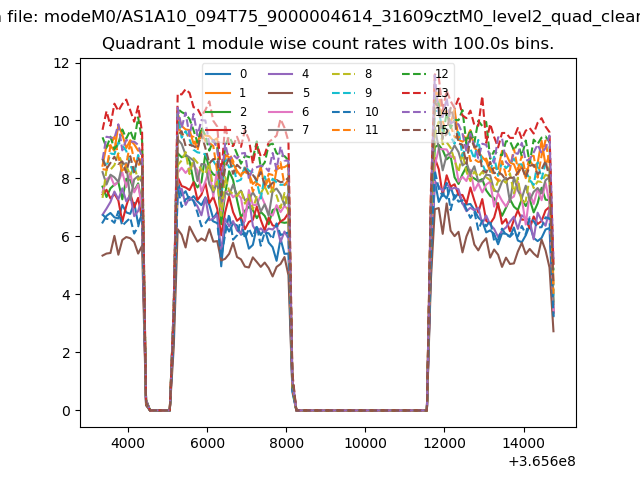
| Module-wise count rates for Quadrant A Data is divided into 100 sec bins |
 |
 |
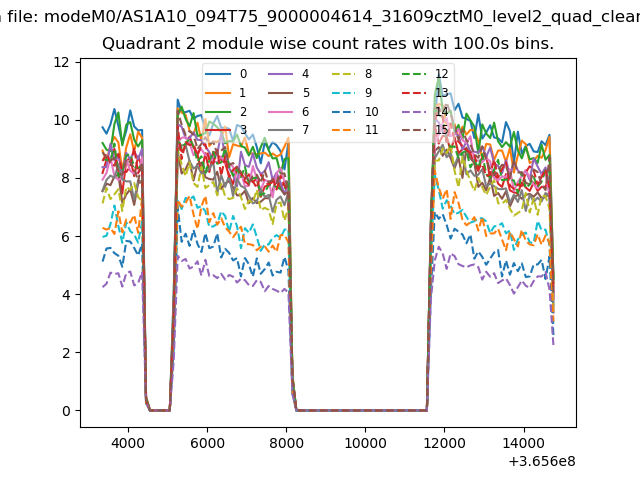
| Module-wise count rates for Quadrant B Data is divided into 100 sec bins |
 |
 |
| Module-wise count rates for Quadrant C Data is divided into 100 sec bins |
 |
 |
| Module-wise count rates for Quadrant D Data is divided into 100 sec bins |
 |
 |
| Parameter | Plot |
|---|---|
| CZT HV Monitor |  |
| D_VDD | 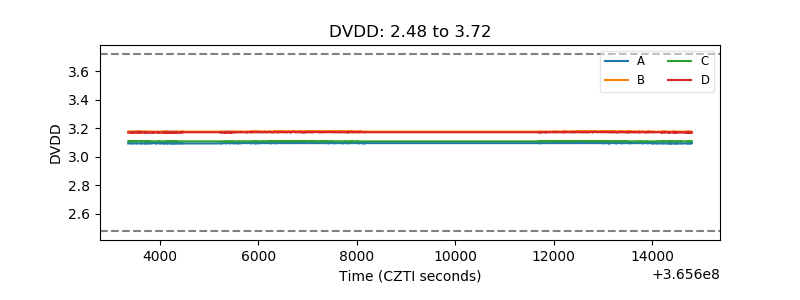 |
| Temperature 1 |  |
| Veto HV Monitor | 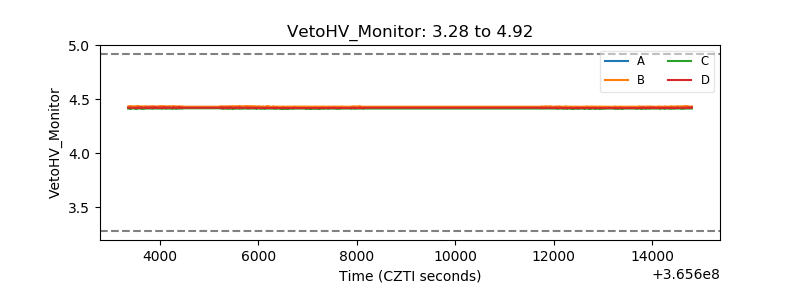 |
| Veto LLD | 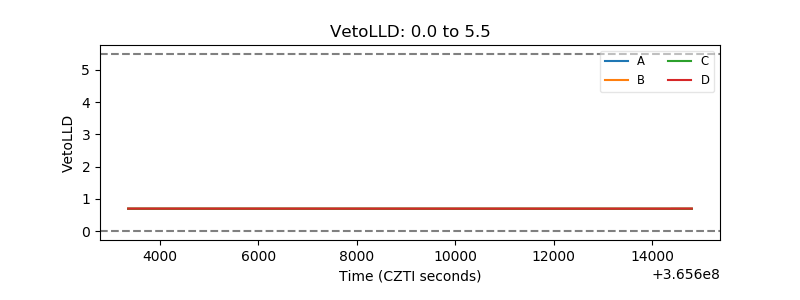 |
| Alpha Counter | 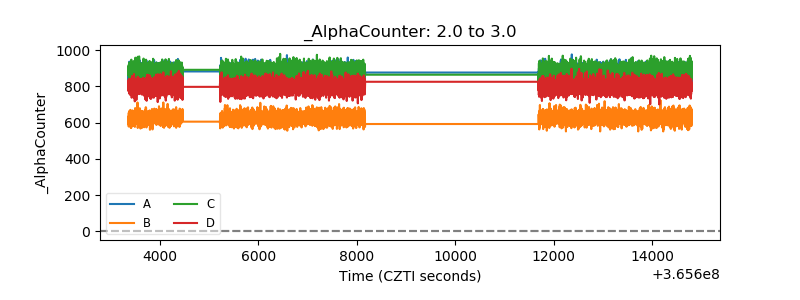 |
| _CPM_Rate | 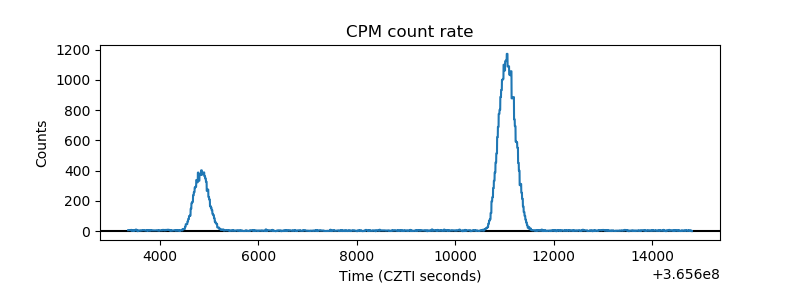 |
| CZT Counter | 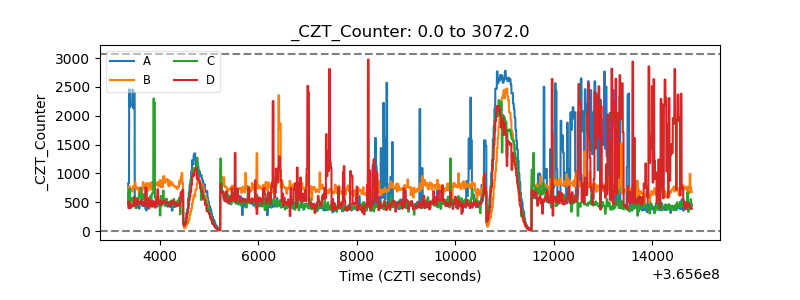 |
| +2.5 Volts monitor |  |
| +5 Volts monitor | 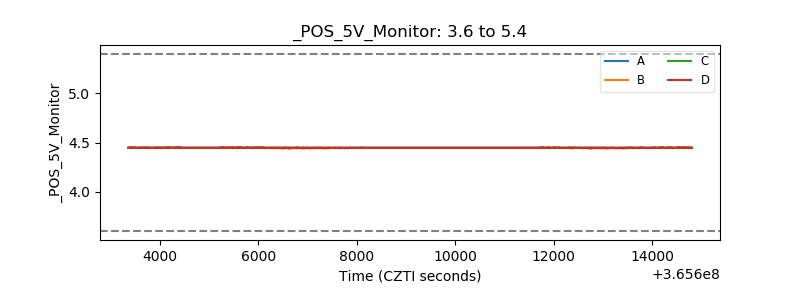 |
| _ROLL_ROT | 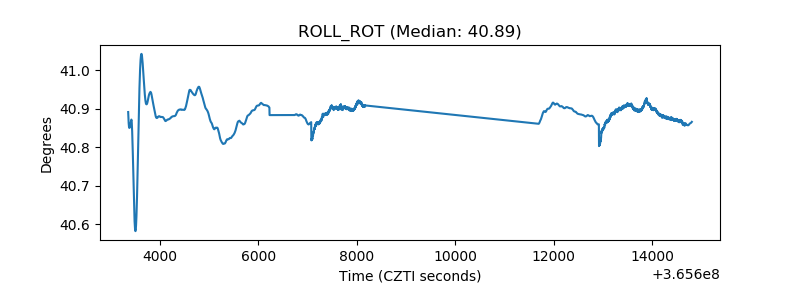 |
| _Roll_DEC |  |
| _Roll_RA | 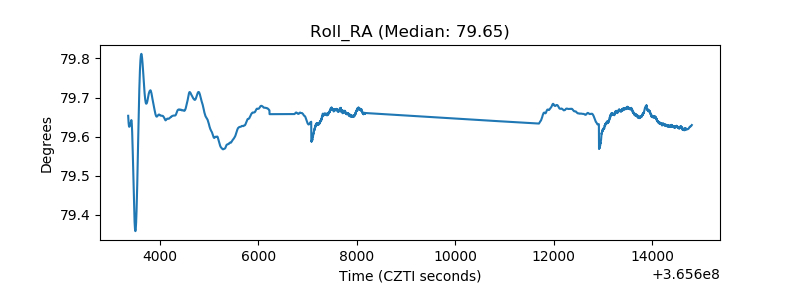 |
| Veto Counter | 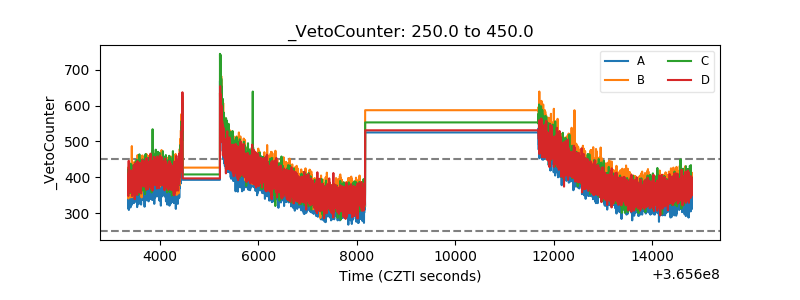 |