| Param | Original file | Final file |
|---|---|---|
| Filename | modeM0/AS1A10_094T76_9000004616cztM0_level2.fits | modeM0/AS1A10_094T76_9000004616cztM0_level2_quad_clean.evt |
| Size (bytes) | 83,586,240 | 83,560,320 |
| Size | 79.7 MB | 79.7 MB |
| Events in quadrant A | 530,998 | 521,799 |
| Events in quadrant B | 499,126 | 512,546 |
| Events in quadrant C | 499,986 | 488,998 |
| Events in quadrant D | 444,306 | 449,548 |
| Mode SS | |||
|---|---|---|---|
| Quadrant | BADHDUFLAG | Total packets | Discarded packets |
| A | 0 | 166 | 0 |
| B | 0 | 166 | 0 |
| C | 0 | 166 | 0 |
| D | 0 | 166 | 0 |
| Mode M0 | |||
|---|---|---|---|
| Quadrant | BADHDUFLAG | Total packets | Discarded packets |
| A | 0 | 17158 | 0 |
| B | 0 | 25034 | 0 |
| C | 0 | 18281 | 0 |
| D | 0 | 18460 | 0 |
| Mode M9 | |||
|---|---|---|---|
| Quadrant | BADHDUFLAG | Total packets | Discarded packets |
| A | 0 | 22 | 0 |
| B | 0 | 22 | 0 |
| C | 0 | 22 | 0 |
| D | 0 | 22 | 0 |
| Quadrant | Total seconds | Saturated seconds | Saturation percentage |
|---|---|---|---|
| A | 8009 | 89 | 1.111250% |
| B | 8009 | 157 | 1.960295% |
| C | 8008 | 260 | 3.246753% |
| D | 8008 | 130 | 1.623377% |
Noise dominated data is calculated using 1-second bins in cleaned event files. If a bin has >2000 counts, and if more than 50% of those come from <1% of pixels, then it is considered to be noise-dominated and hence unusable.
| Quadrant | # 1 sec bins | Bins with >0 counts | Bins with >2000 counts | High rate bins dominated by noise | Noise dominated (total time) | Noise dominated (detector-on time) | Marked lightcurve |
|---|---|---|---|---|---|---|---|
| A | 10244 | 8009 | 0 | 0 | 0.00% | 0.00% |  |
| B | 10244 | 8009 | 0 | 0 | 0.00% | 0.00% | 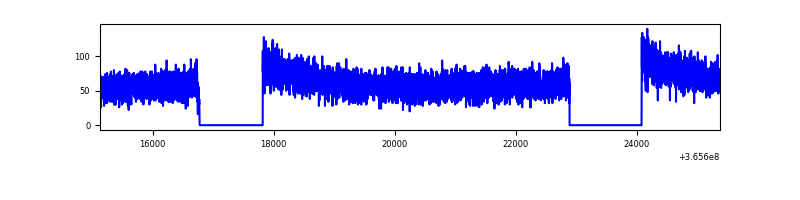 |
| C | 10243 | 8008 | 0 | 0 | 0.00% | 0.00% | 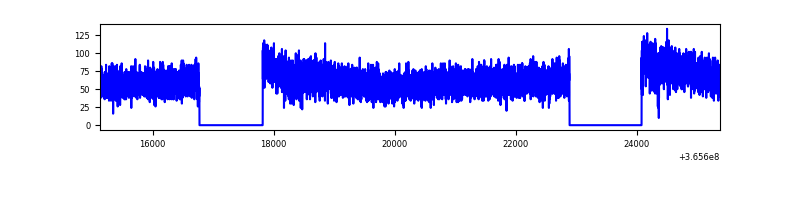 |
| D | 10242 | 8004 | 0 | 0 | 0.00% | 0.00% |  |
Top three noisy pixels from each quadrant. If the there are fewer than three noisy pixels in the level2.evt file, extra rows are filled as -1
| Pixel properties | Quadrant properties | ||||||
|---|---|---|---|---|---|---|---|
| Quadrant | DetID | PixID | Counts | Sigma | Mean | Median | Sigma |
| A | 0 | 29 | 492 | 10.17 | 138 | 131 | 35.5 |
| A | 7 | 110 | 429 | 8.39 | 138 | 131 | 35.5 |
| A | 9 | 19 | 413 | 7.94 | 138 | 131 | 35.5 |
| B | 3 | 80 | 377 | 8.86 | 132 | 127 | 28.2 |
| B | 2 | 9 | 375 | 8.79 | 132 | 127 | 28.2 |
| B | 3 | 17 | 326 | 7.05 | 132 | 127 | 28.2 |
| C | 1 | 81 | 382 | 7.3 | 132 | 124 | 35.3 |
| C | 1 | 65 | 364 | 6.79 | 132 | 124 | 35.3 |
| C | 1 | 80 | 363 | 6.76 | 132 | 124 | 35.3 |
| D | 7 | 5 | 313 | 5.71 | 127 | 116 | 34.5 |
| D | 11 | 66 | 312 | 5.69 | 127 | 116 | 34.5 |
| D | 10 | 189 | 309 | 5.6 | 127 | 116 | 34.5 |
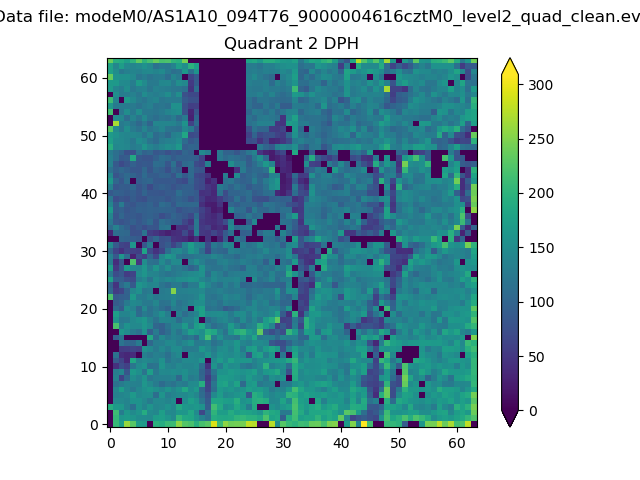
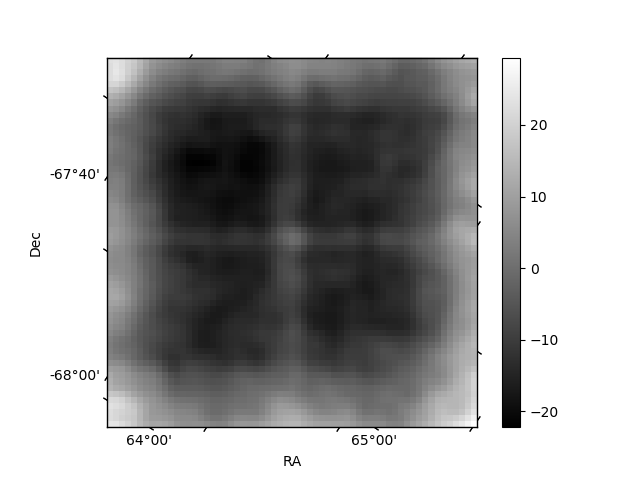
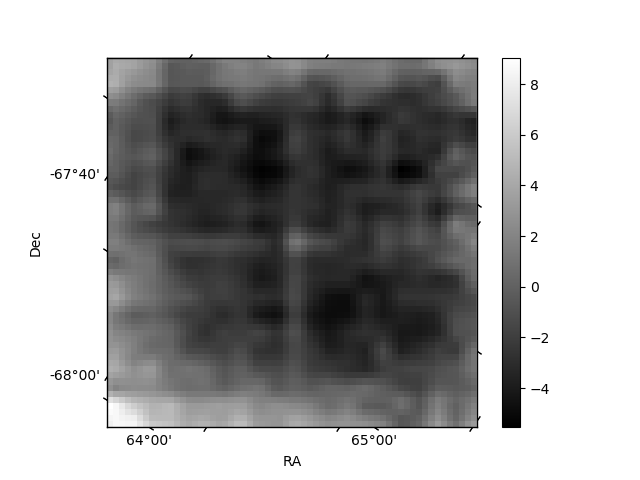
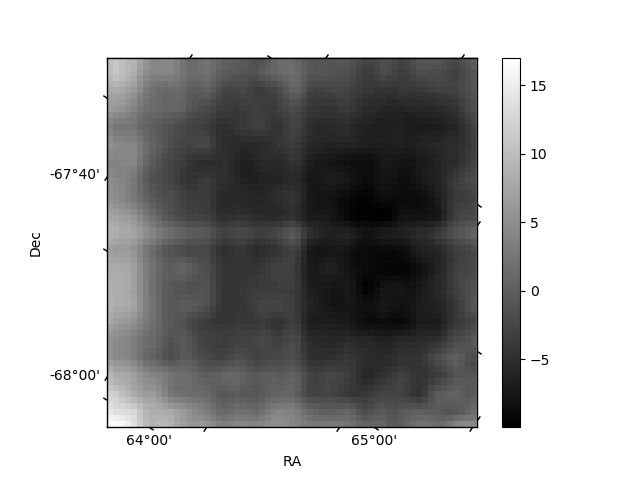
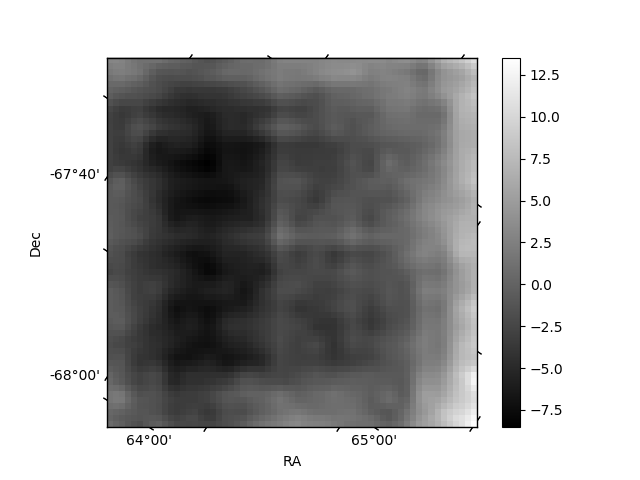
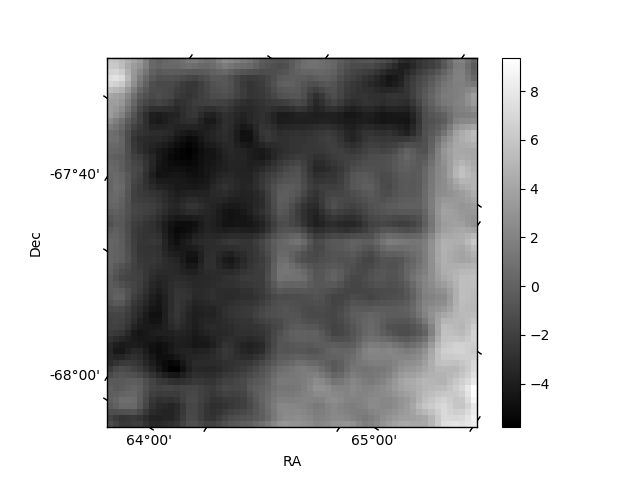
Histogram calculated using DETX and DETY for each event in the final _common_clean file
| Quadrant A | 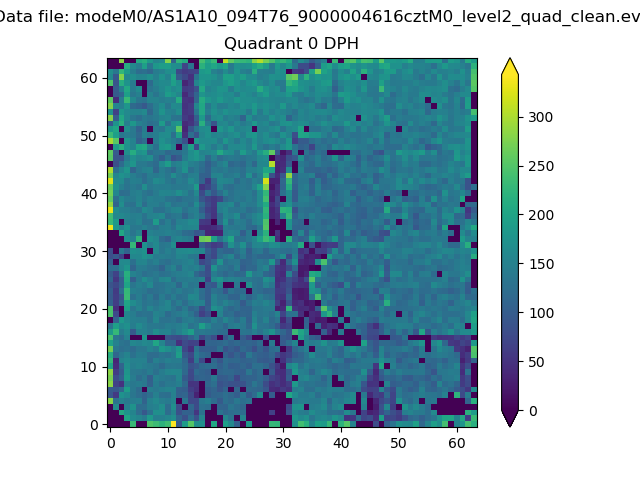 |
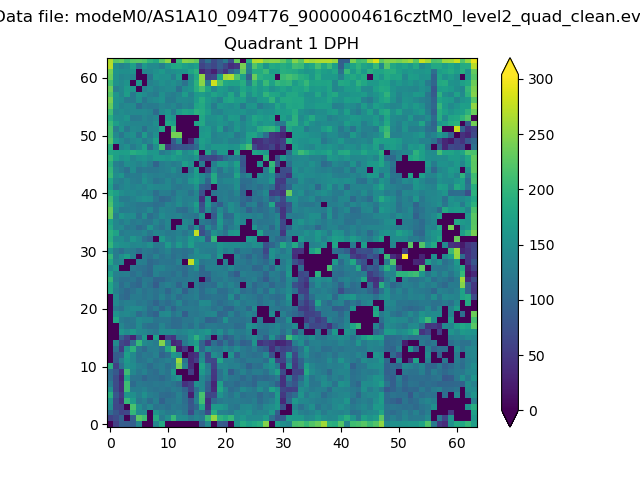 |
Quadrant B |
|---|---|---|---|
| Quadrant D | 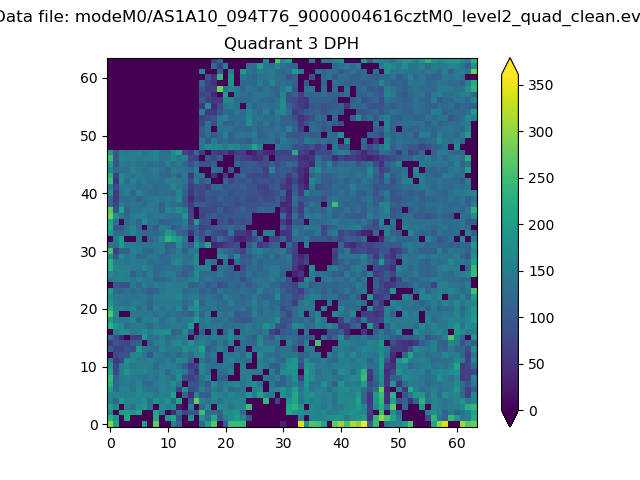 |
 |
Quadrant C |
| Plot type | Count rate plots | Images |
|---|---|---|
| Comparison with Poisson distribution Blue bars denote a histogram of data divided into 1 sec bins. Red curve is a Poisson curve with rate = median count rate of data. |
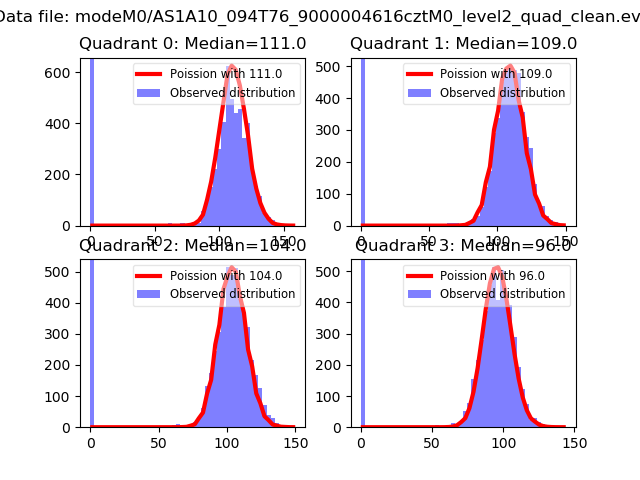 |
 |
| Quadrant-wise count rates Data is divided into 100 sec bins |
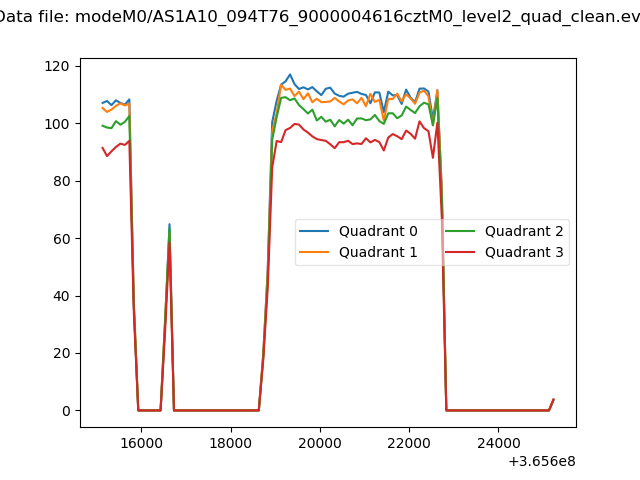 |
|
| Module-wise count rates for Quadrant A Data is divided into 100 sec bins |
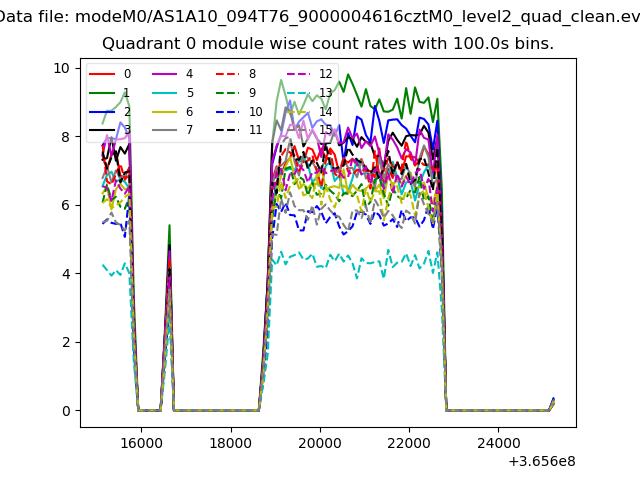 |
 |
| Module-wise count rates for Quadrant B Data is divided into 100 sec bins |
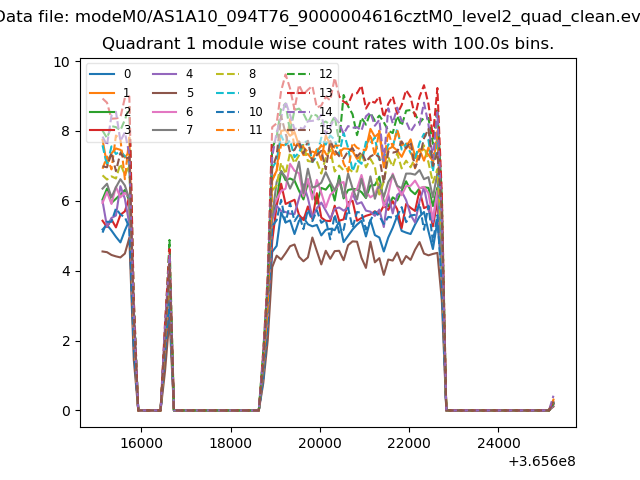 |
 |
| Module-wise count rates for Quadrant C Data is divided into 100 sec bins |
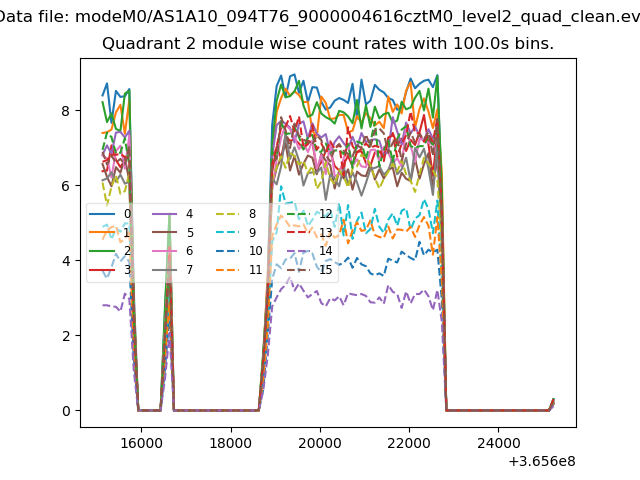 |
 |
| Module-wise count rates for Quadrant D Data is divided into 100 sec bins |
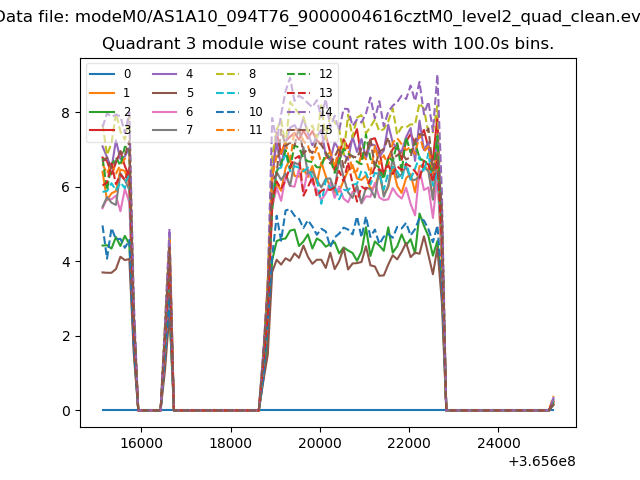 |
 |
| Parameter | Plot |
|---|---|
| CZT HV Monitor | 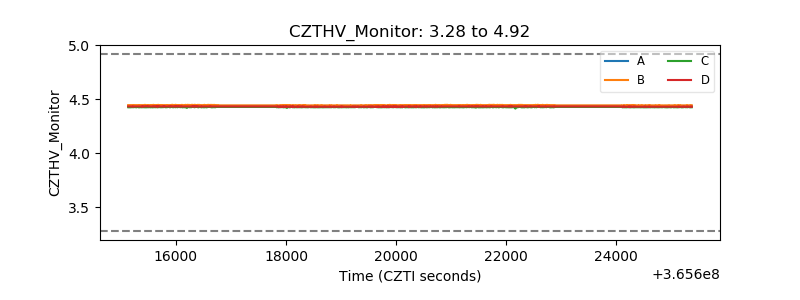 |
| D_VDD | 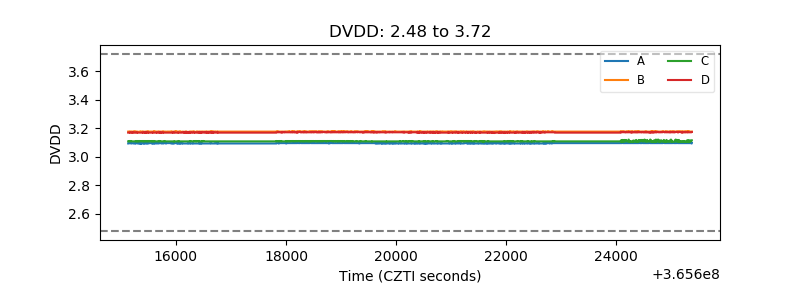 |
| Temperature 1 | 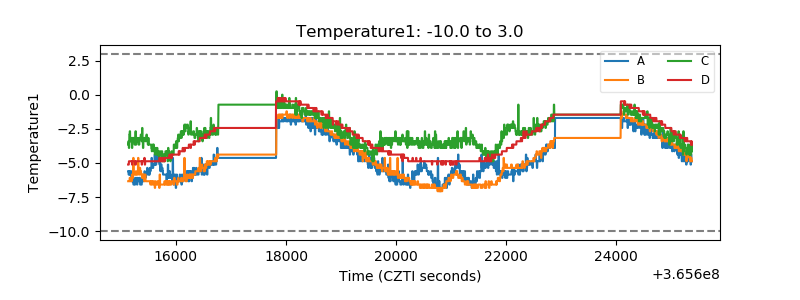 |
| Veto HV Monitor | 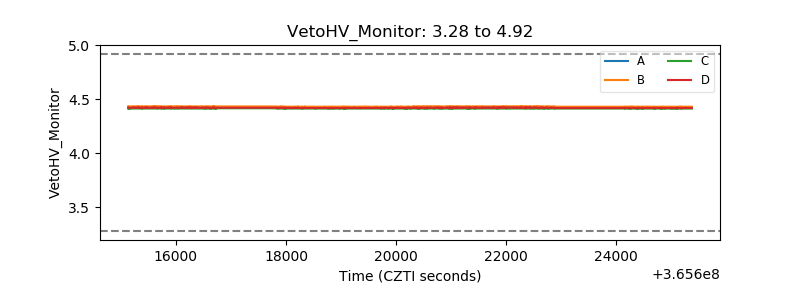 |
| Veto LLD | 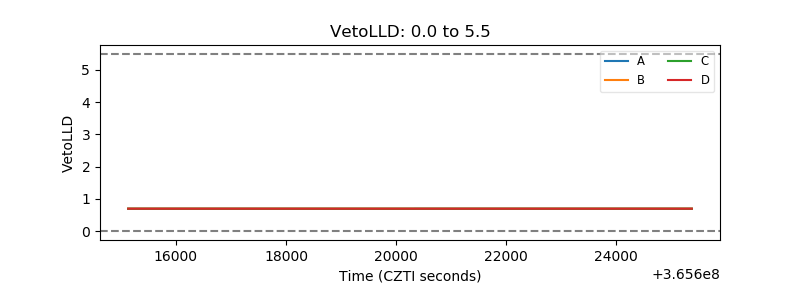 |
| Alpha Counter | 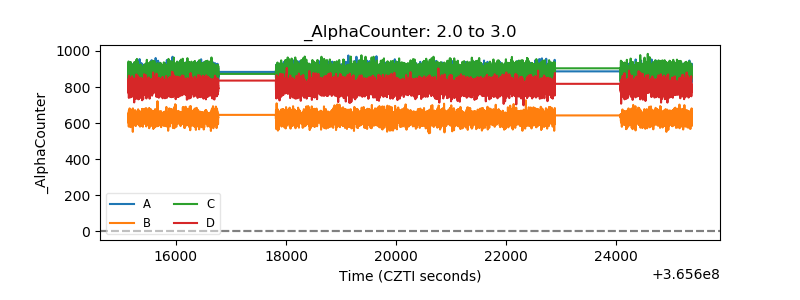 |
| _CPM_Rate | 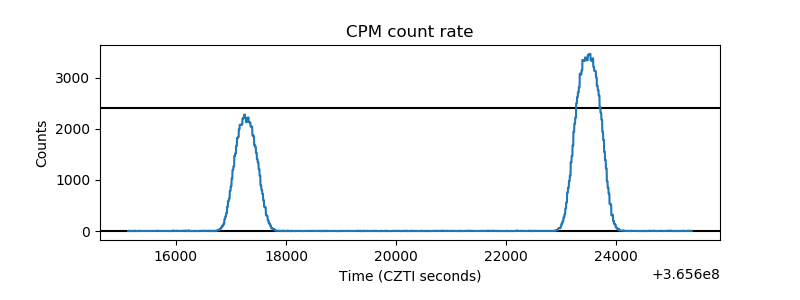 |
| CZT Counter | 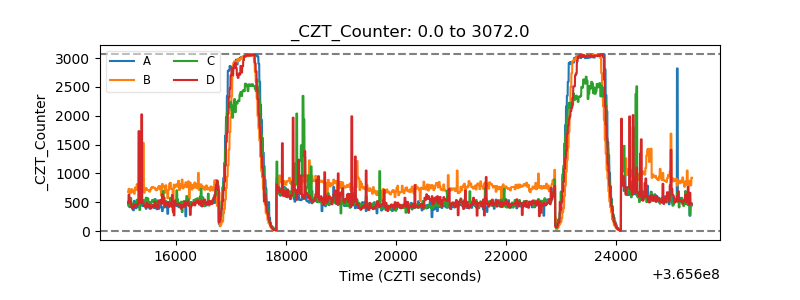 |
| +2.5 Volts monitor | 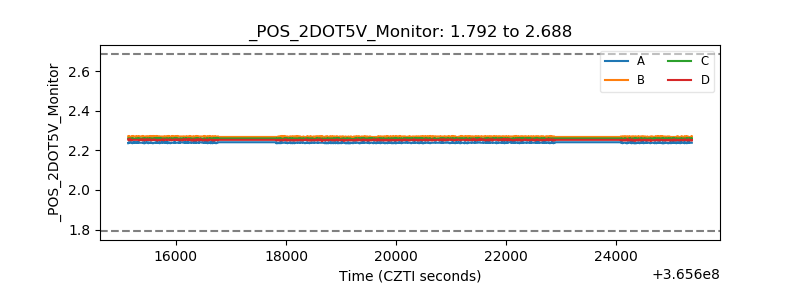 |
| +5 Volts monitor | 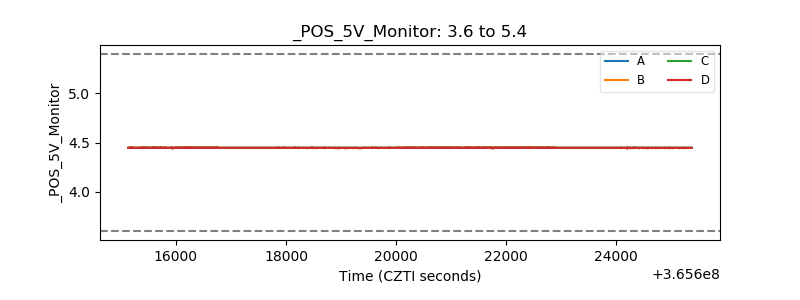 |
| _ROLL_ROT | 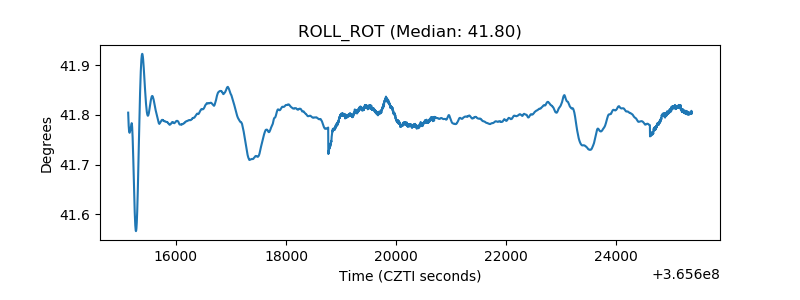 |
| _Roll_DEC | 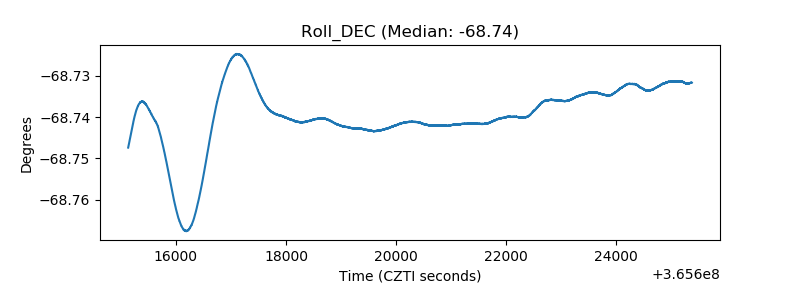 |
| _Roll_RA | 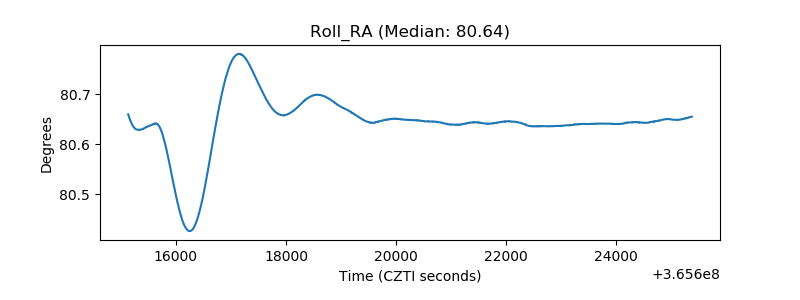 |
| Veto Counter | 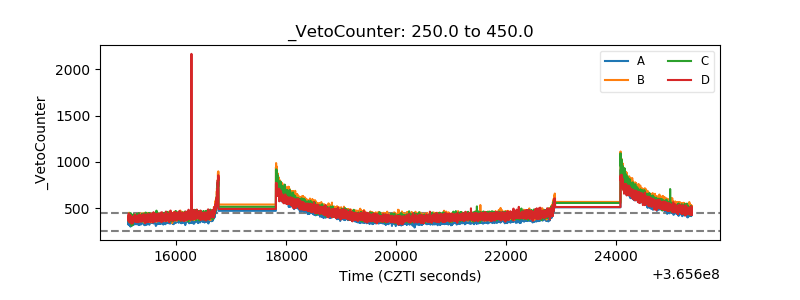 |