| Param | Original file | Final file |
|---|---|---|
| Filename | modeM0/AS1A10_094T76_9000004616_31609cztM0_level2.evt | modeM0/AS1A10_094T76_9000004616_31609cztM0_level2_quad_clean.evt |
| Size (bytes) | 259,306,560 | 63,457,920 |
| Size | 247.3 MB | 60.5 MB |
| Events in quadrant A | 1,550,244 | 437,011 |
| Events in quadrant B | 2,463,624 | 437,878 |
| Events in quadrant C | 1,871,195 | 417,330 |
| Events in quadrant D | 1,759,168 | 411,977 |
| Mode SS | |||
|---|---|---|---|
| Quadrant | BADHDUFLAG | Total packets | Discarded packets |
| A | 0 | 64 | 0 |
| B | 0 | 64 | 0 |
| C | 0 | 64 | 0 |
| D | 0 | 64 | 0 |
| Mode M0 | |||
|---|---|---|---|
| Quadrant | BADHDUFLAG | Total packets | Discarded packets |
| A | 0 | 6555 | 1 |
| B | 0 | 9384 | 3 |
| C | 0 | 7415 | 1 |
| D | 0 | 7245 | 1 |
| Mode M9 | |||
|---|---|---|---|
| Quadrant | BADHDUFLAG | Total packets | Discarded packets |
| A | 0 | 10 | 0 |
| B | 0 | 10 | 0 |
| C | 0 | 10 | 0 |
| D | 0 | 10 | 0 |
| Quadrant | Total seconds | Saturated seconds | Saturation percentage |
|---|---|---|---|
| A | 3051 | 52 | 1.704359% |
| B | 3050 | 87 | 2.852459% |
| C | 3050 | 134 | 4.393443% |
| D | 3050 | 74 | 2.426230% |
Noise dominated data is calculated using 1-second bins in cleaned event files. If a bin has >2000 counts, and if more than 50% of those come from <1% of pixels, then it is considered to be noise-dominated and hence unusable.
| Quadrant | # 1 sec bins | Bins with >0 counts | Bins with >2000 counts | High rate bins dominated by noise | Noise dominated (total time) | Noise dominated (detector-on time) | Marked lightcurve |
|---|---|---|---|---|---|---|---|
| A | 4096 | 3052 | 0 | 0 | 0.00% | 0.00% | 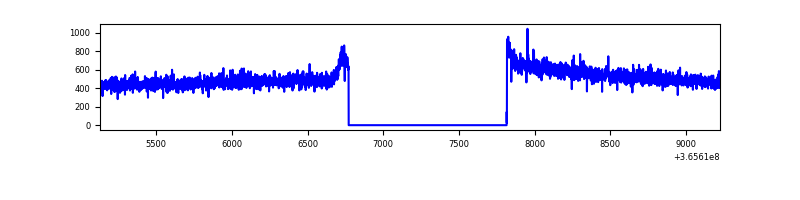 |
| B | 4095 | 3051 | 0 | 0 | 0.00% | 0.00% | 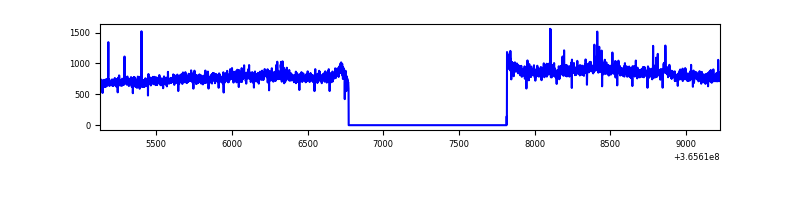 |
| C | 4095 | 3051 | 34 | 34 | 0.83% | 1.11% | 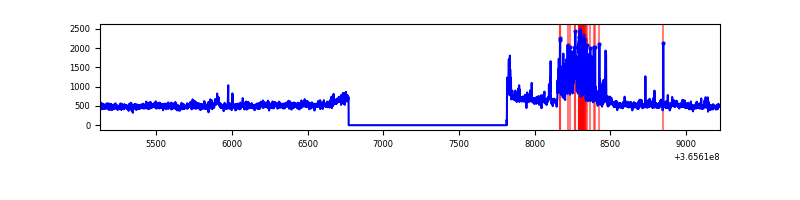 |
| D | 4095 | 3051 | 22 | 22 | 0.54% | 0.72% | 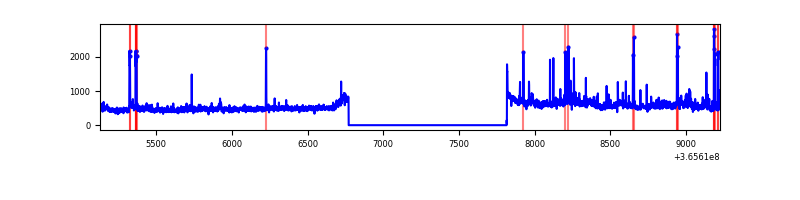 |
Top three noisy pixels from each quadrant. If the there are fewer than three noisy pixels in the level2.evt file, extra rows are filled as -1
| Pixel properties | Quadrant properties | ||||||
|---|---|---|---|---|---|---|---|
| Quadrant | DetID | PixID | Counts | Sigma | Mean | Median | Sigma |
| A | 13 | 254 | 6000 | 69.31 | 401 | 393 | 80.9 |
| A | 3 | 137 | 3938 | 43.82 | 401 | 393 | 80.9 |
| A | 0 | 226 | 3415 | 37.36 | 401 | 393 | 80.9 |
| B | 6 | 159 | 852296 | 11332.42 | 395 | 384 | 75.2 |
| B | 4 | 80 | 34165 | 449.37 | 395 | 384 | 75.2 |
| B | 12 | 111 | 9042 | 115.17 | 395 | 384 | 75.2 |
| C | 3 | 233 | 286826 | 3216.1 | 381 | 383 | 89.1 |
| C | 14 | 238 | 61895 | 690.64 | 381 | 383 | 89.1 |
| C | 0 | 10 | 13891 | 151.66 | 381 | 383 | 89.1 |
| D | 8 | 195 | 126538 | 1367.48 | 388 | 378 | 92.3 |
| D | 12 | 218 | 63252 | 681.51 | 388 | 378 | 92.3 |
| D | 13 | 249 | 42089 | 452.12 | 388 | 378 | 92.3 |
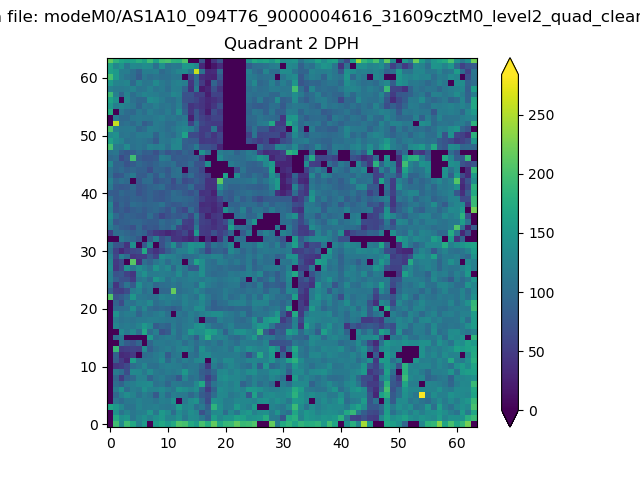
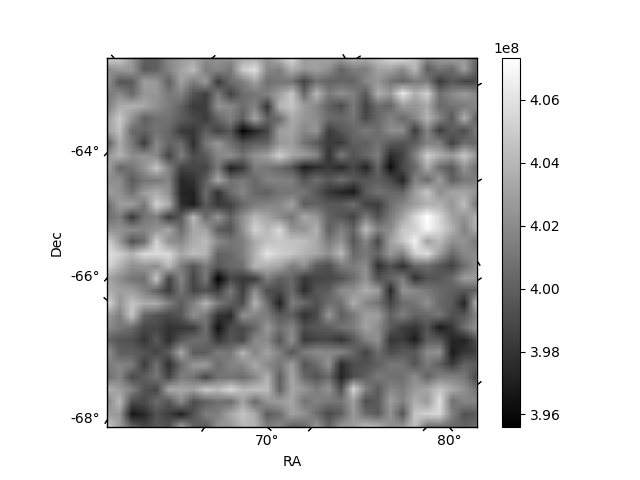
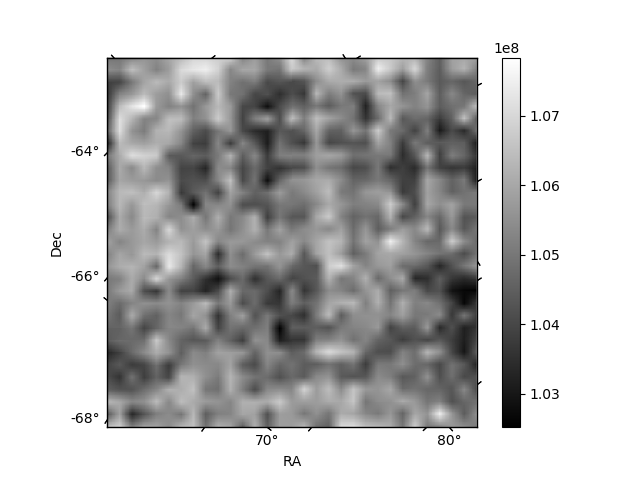
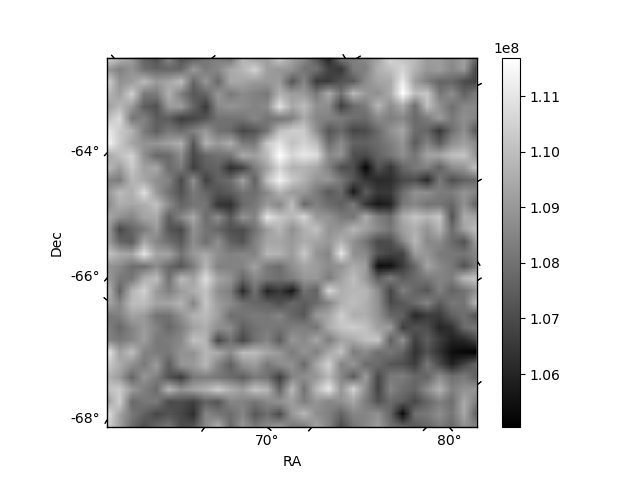
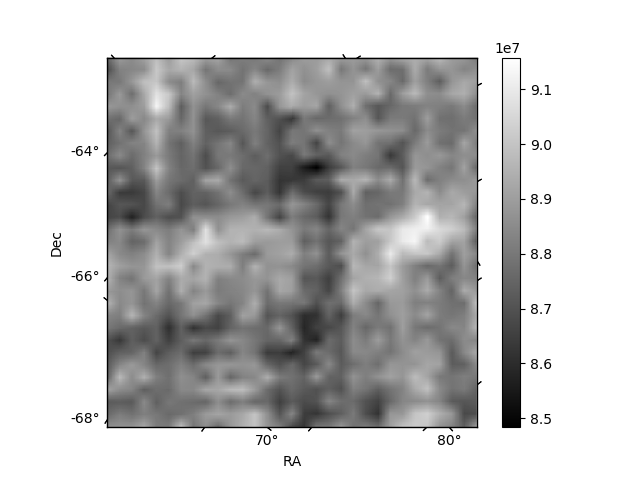
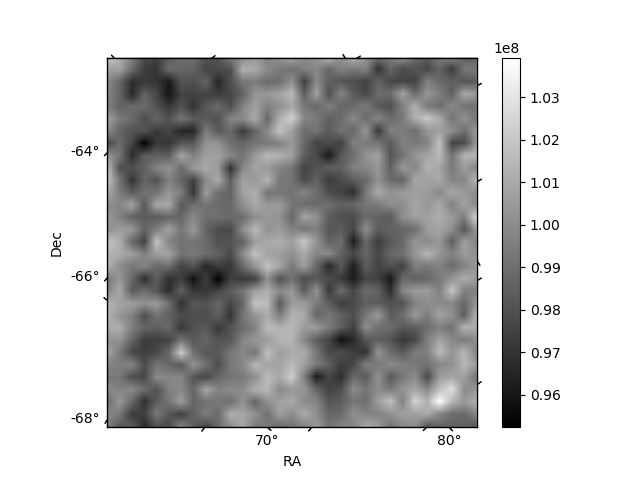
Histogram calculated using DETX and DETY for each event in the final _common_clean file
| Quadrant A | 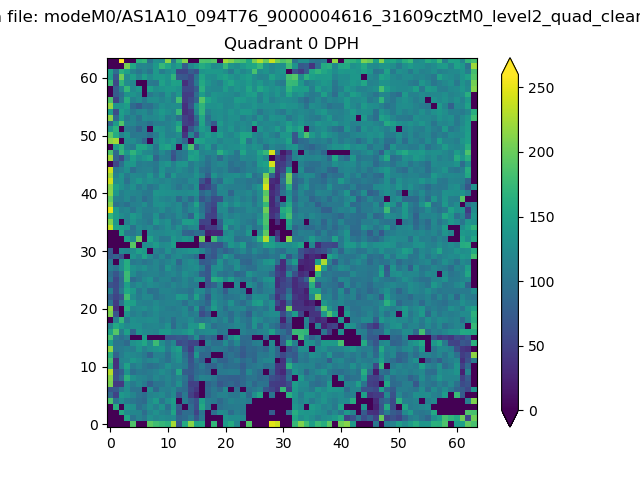 |
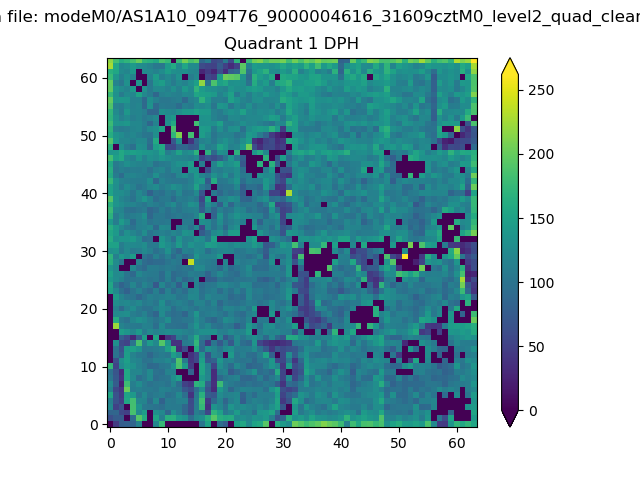 |
Quadrant B |
|---|---|---|---|
| Quadrant D | 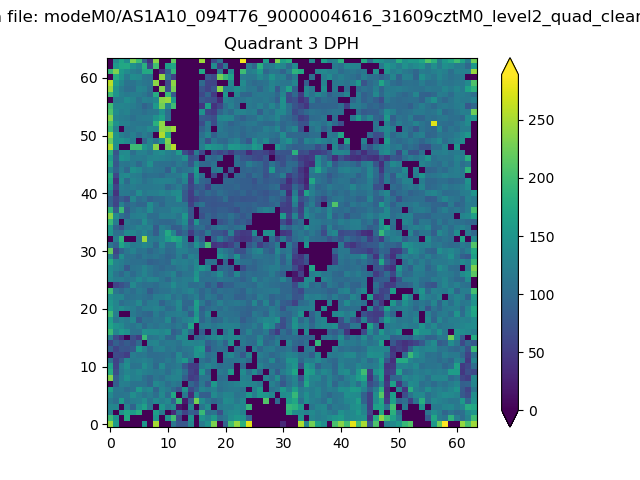 |
 |
Quadrant C |
| Plot type | Count rate plots | Images |
|---|---|---|
| Comparison with Poisson distribution Blue bars denote a histogram of data divided into 1 sec bins. Red curve is a Poisson curve with rate = median count rate of data. |
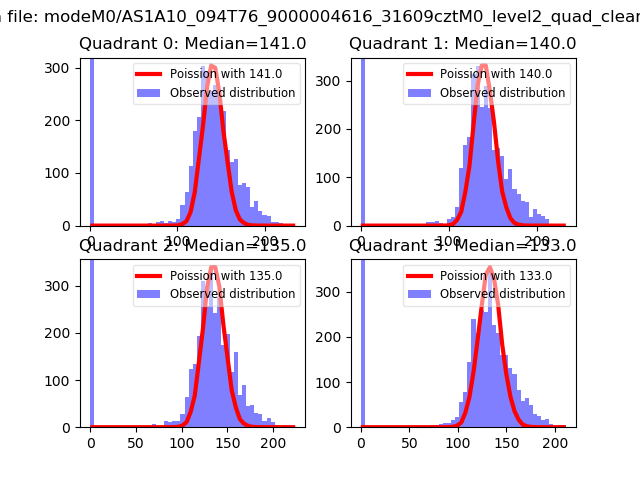 |
 |
| Quadrant-wise count rates Data is divided into 100 sec bins |
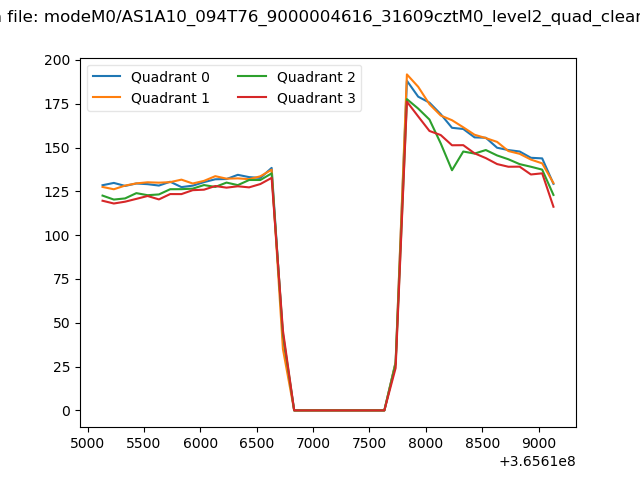 |
|
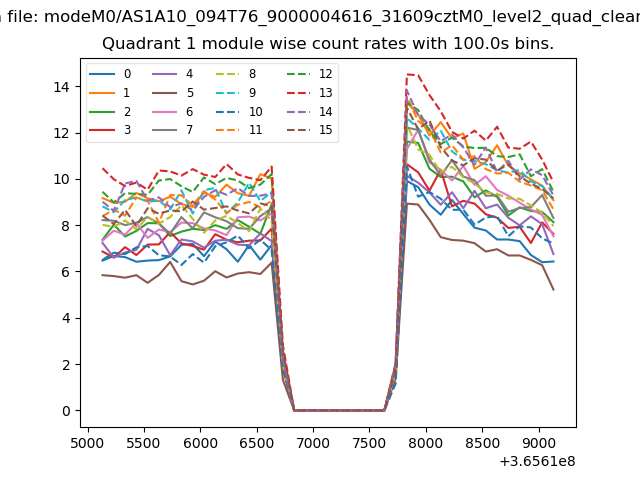
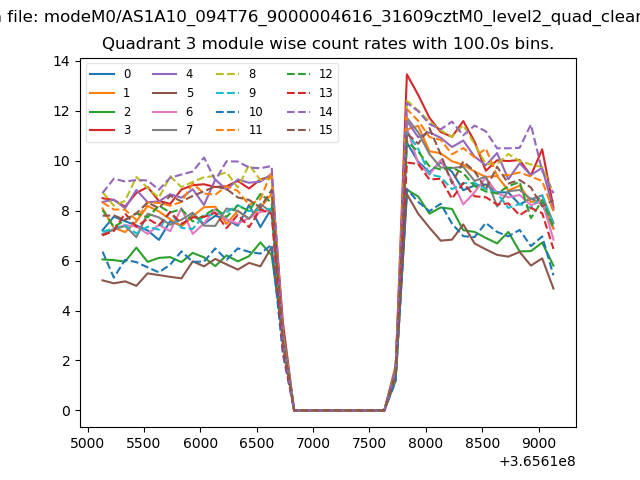
| Module-wise count rates for Quadrant A Data is divided into 100 sec bins |
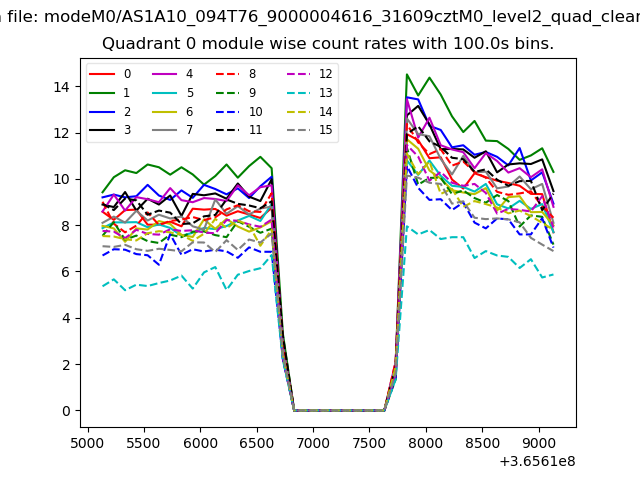 |
 |
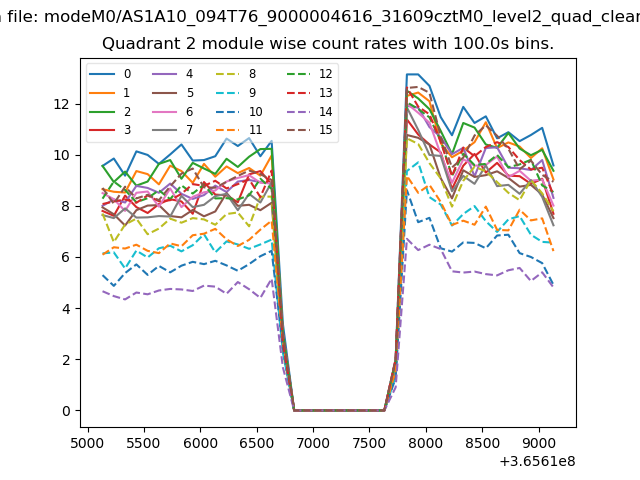
| Module-wise count rates for Quadrant B Data is divided into 100 sec bins |
 |
 |
| Module-wise count rates for Quadrant C Data is divided into 100 sec bins |
 |
 |
| Module-wise count rates for Quadrant D Data is divided into 100 sec bins |
 |
 |
| Parameter | Plot |
|---|---|
| CZT HV Monitor | 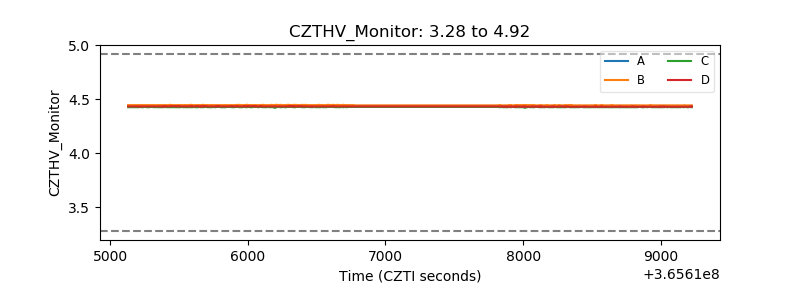 |
| D_VDD | 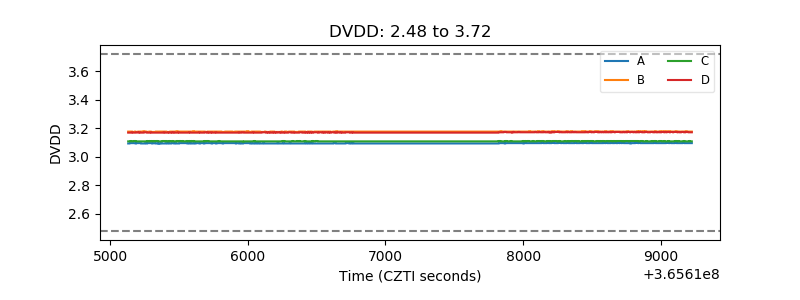 |
| Temperature 1 | 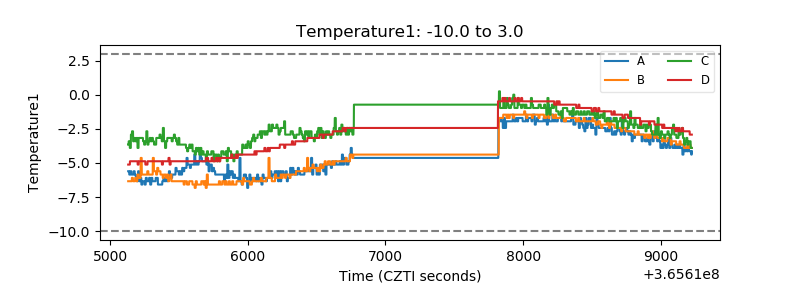 |
| Veto HV Monitor | 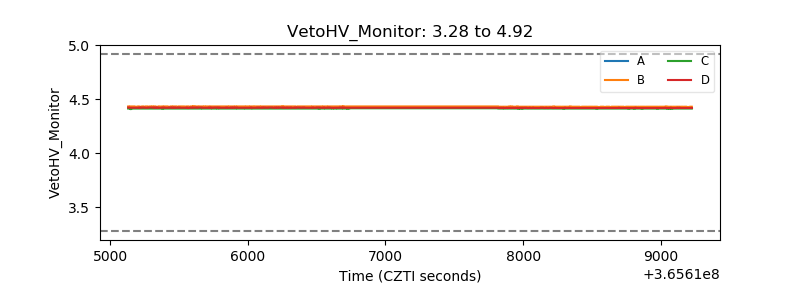 |
| Veto LLD | 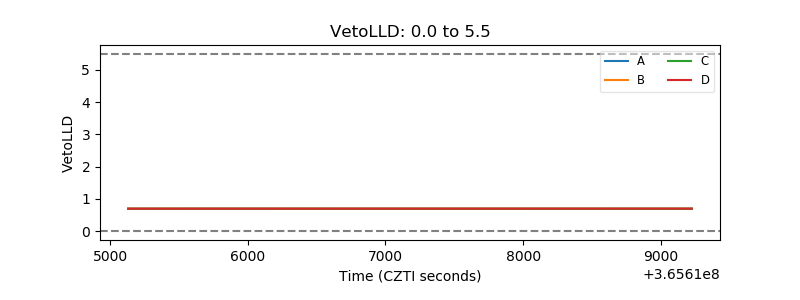 |
| Alpha Counter | 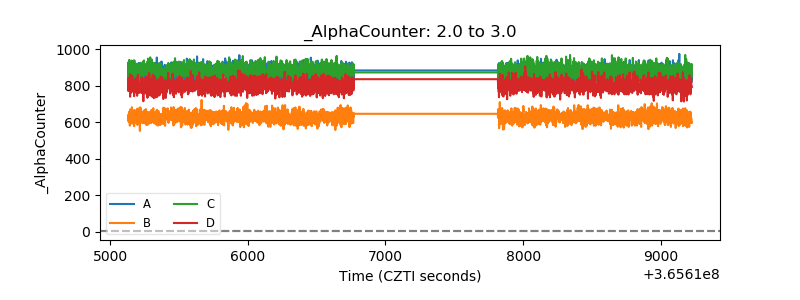 |
| _CPM_Rate | 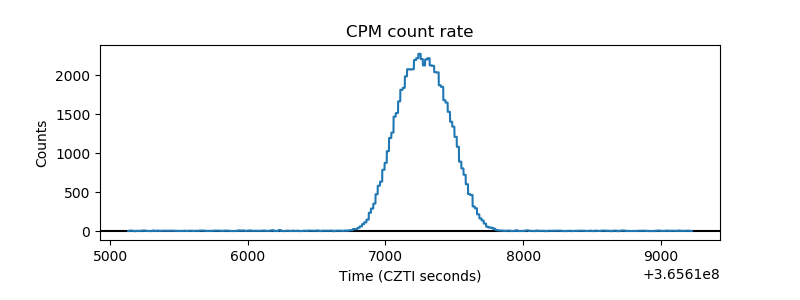 |
| CZT Counter | 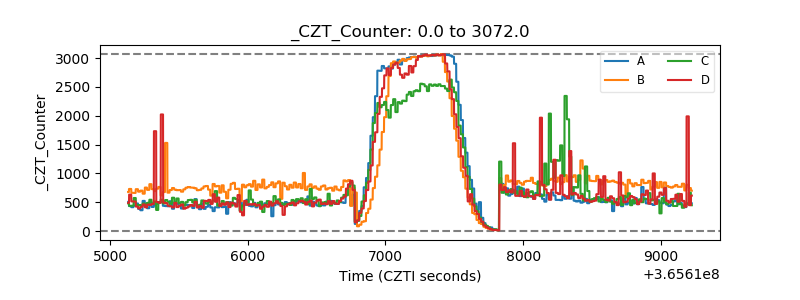 |
| +2.5 Volts monitor |  |
| +5 Volts monitor | 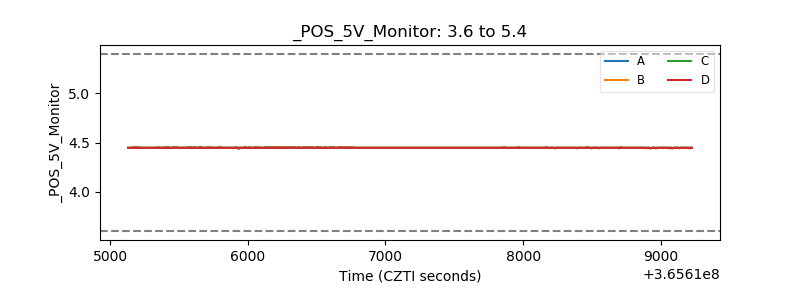 |
| _ROLL_ROT | 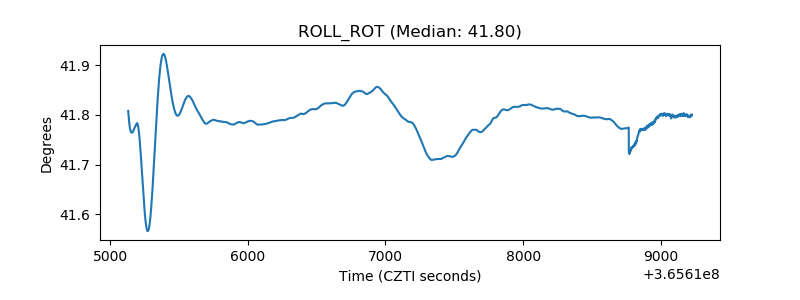 |
| _Roll_DEC | 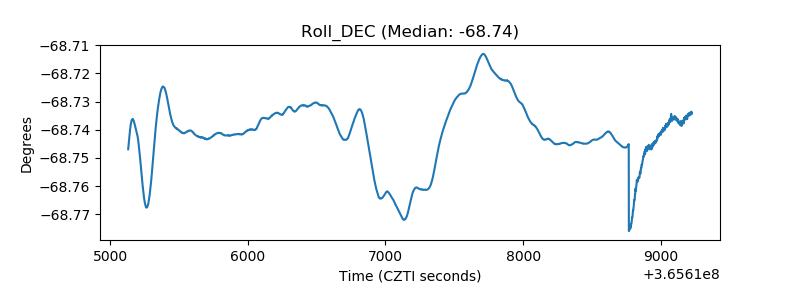 |
| _Roll_RA | 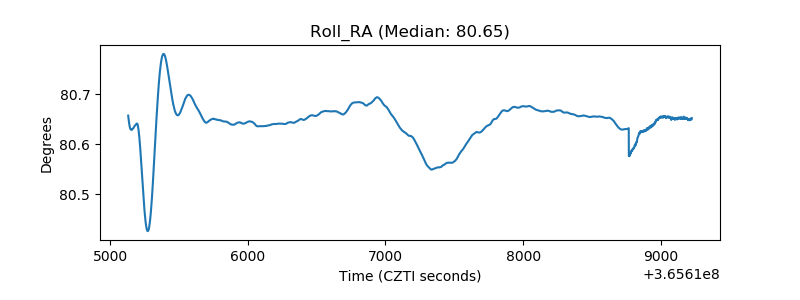 |
| Veto Counter | 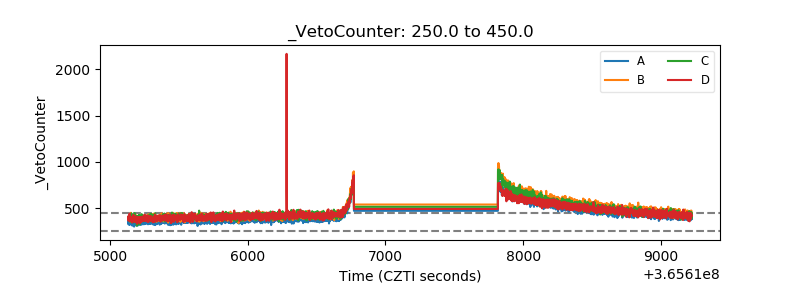 |