| Param | Original file | Final file |
|---|---|---|
| Filename | modeM0/AS1A10_094T76_9000004616_31611cztM0_level2.evt | modeM0/AS1A10_094T76_9000004616_31611cztM0_level2_quad_clean.evt |
| Size (bytes) | 492,672,960 | 124,873,920 |
| Size | 469.8 MB | 119.1 MB |
| Events in quadrant A | 2,957,325 | 869,260 |
| Events in quadrant B | 4,880,386 | 867,117 |
| Events in quadrant C | 3,314,139 | 823,022 |
| Events in quadrant D | 3,364,110 | 806,004 |
| Mode SS | |||
|---|---|---|---|
| Quadrant | BADHDUFLAG | Total packets | Discarded packets |
| A | 0 | 122 | 0 |
| B | 0 | 122 | 0 |
| C | 0 | 122 | 0 |
| D | 0 | 122 | 0 |
| Mode M0 | |||
|---|---|---|---|
| Quadrant | BADHDUFLAG | Total packets | Discarded packets |
| A | 0 | 12699 | 1 |
| B | 0 | 18818 | 1 |
| C | 0 | 13589 | 1 |
| D | 0 | 13796 | 1 |
| Mode M9 | |||
|---|---|---|---|
| Quadrant | BADHDUFLAG | Total packets | Discarded packets |
| A | 0 | 12 | 0 |
| B | 0 | 12 | 0 |
| C | 0 | 12 | 0 |
| D | 0 | 12 | 0 |
| Quadrant | Total seconds | Saturated seconds | Saturation percentage |
|---|---|---|---|
| A | 5964 | 37 | 0.620389% |
| B | 5965 | 79 | 1.324392% |
| C | 5964 | 183 | 3.068410% |
| D | 5964 | 74 | 1.240778% |
Noise dominated data is calculated using 1-second bins in cleaned event files. If a bin has >2000 counts, and if more than 50% of those come from <1% of pixels, then it is considered to be noise-dominated and hence unusable.
| Quadrant | # 1 sec bins | Bins with >0 counts | Bins with >2000 counts | High rate bins dominated by noise | Noise dominated (total time) | Noise dominated (detector-on time) | Marked lightcurve |
|---|---|---|---|---|---|---|---|
| A | 7154 | 5965 | 5 | 5 | 0.07% | 0.08% | 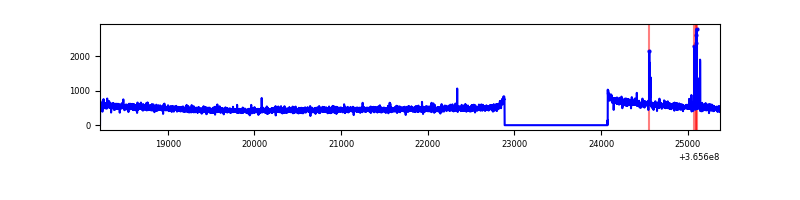 |
| B | 7155 | 5966 | 5 | 5 | 0.07% | 0.08% | 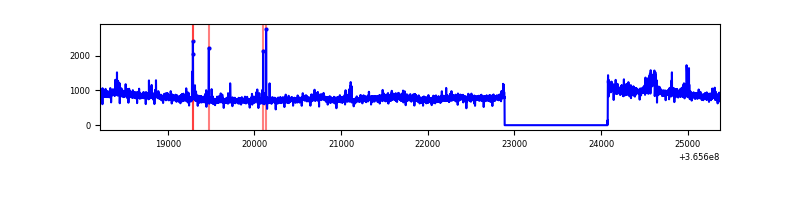 |
| C | 7154 | 5965 | 70 | 70 | 0.98% | 1.17% | 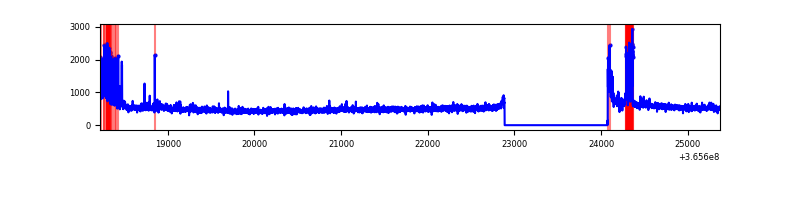 |
| D | 7154 | 5965 | 54 | 54 | 0.75% | 0.91% | 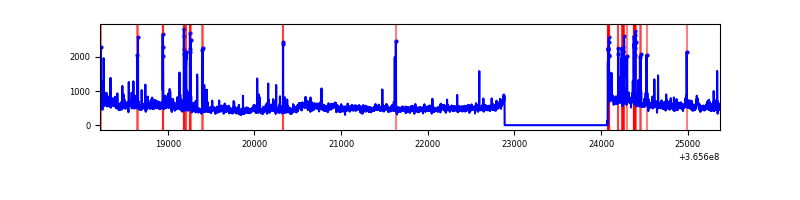 |
Top three noisy pixels from each quadrant. If the there are fewer than three noisy pixels in the level2.evt file, extra rows are filled as -1
| Pixel properties | Quadrant properties | ||||||
|---|---|---|---|---|---|---|---|
| Quadrant | DetID | PixID | Counts | Sigma | Mean | Median | Sigma |
| A | 4 | 2 | 33298 | 216.74 | 756 | 741 | 150.2 |
| A | 13 | 254 | 11559 | 72.02 | 756 | 741 | 150.2 |
| A | 3 | 137 | 7051 | 42.01 | 756 | 741 | 150.2 |
| B | 6 | 159 | 1754505 | 12536.48 | 750 | 734 | 139.9 |
| B | 4 | 80 | 58676 | 414.19 | 750 | 734 | 139.9 |
| B | 6 | 235 | 36256 | 253.92 | 750 | 734 | 139.9 |
| C | 3 | 233 | 254222 | 1536.75 | 711 | 718 | 165.0 |
| C | 0 | 10 | 137546 | 829.46 | 711 | 718 | 165.0 |
| C | 14 | 238 | 120430 | 725.7 | 711 | 718 | 165.0 |
| D | 8 | 195 | 256110 | 1501.5 | 719 | 698 | 170.1 |
| D | 12 | 218 | 177088 | 1036.95 | 719 | 698 | 170.1 |
| D | 13 | 249 | 88825 | 518.07 | 719 | 698 | 170.1 |
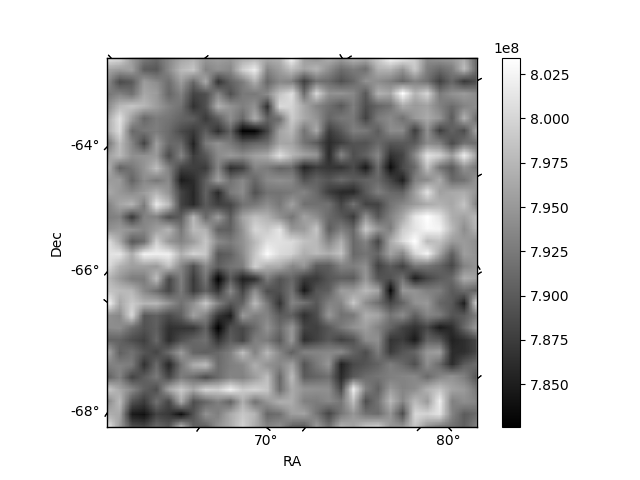
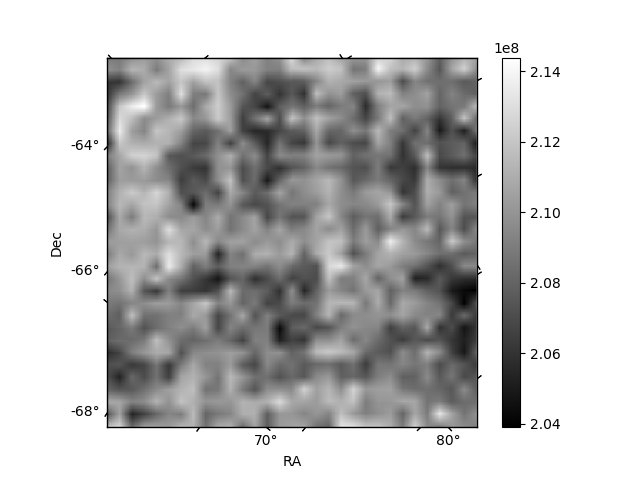
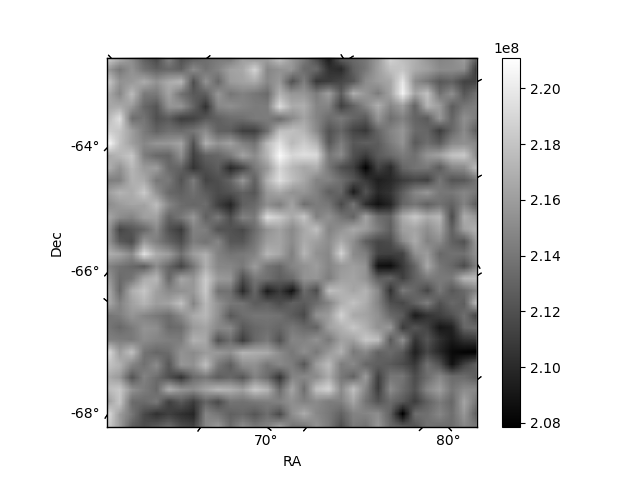
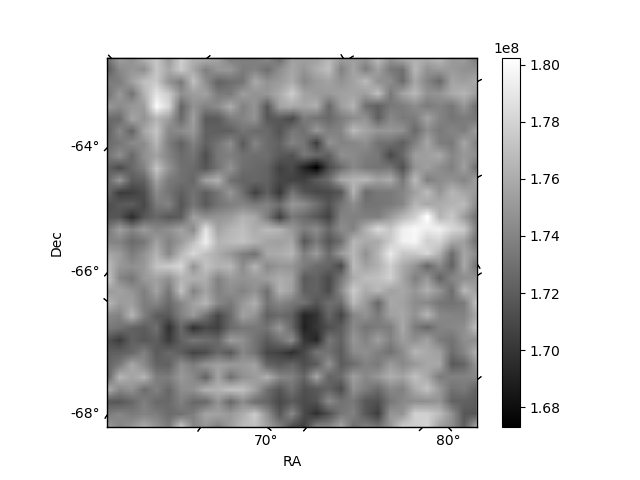
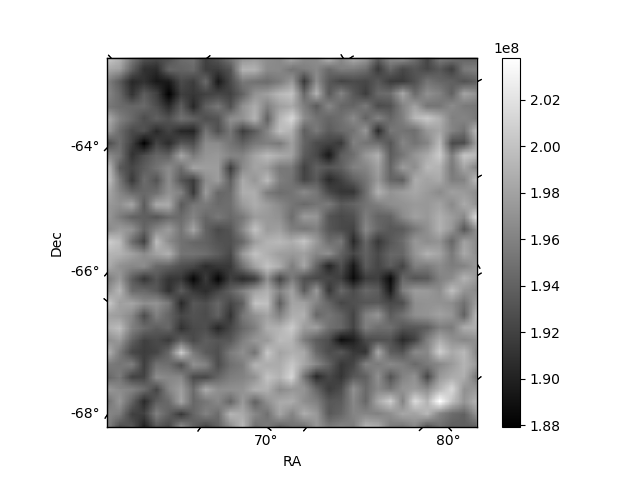
Histogram calculated using DETX and DETY for each event in the final _common_clean file
| Quadrant A | 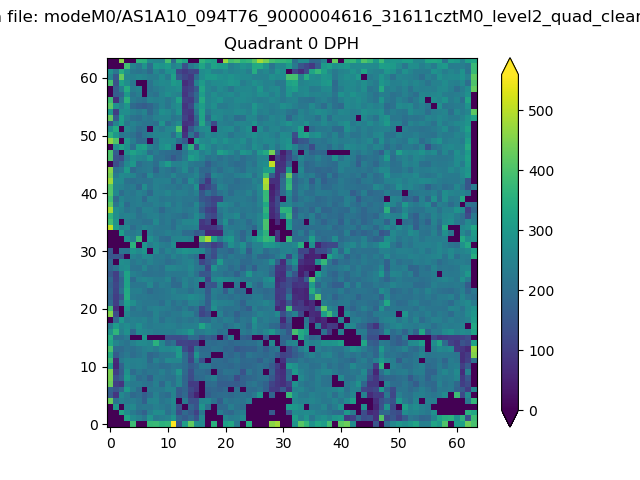 |
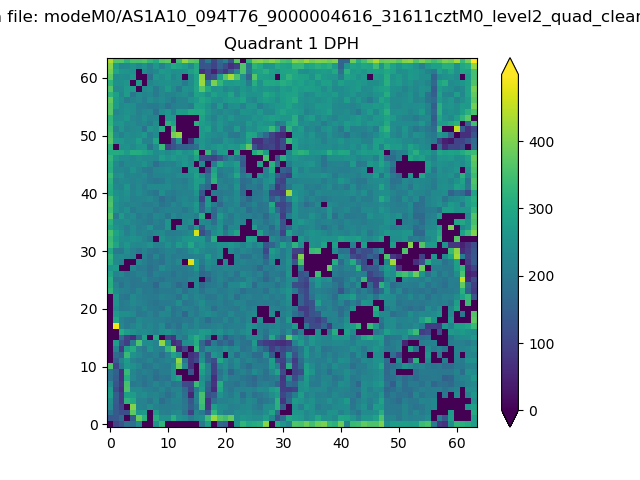 |
Quadrant B |
|---|---|---|---|
| Quadrant D | 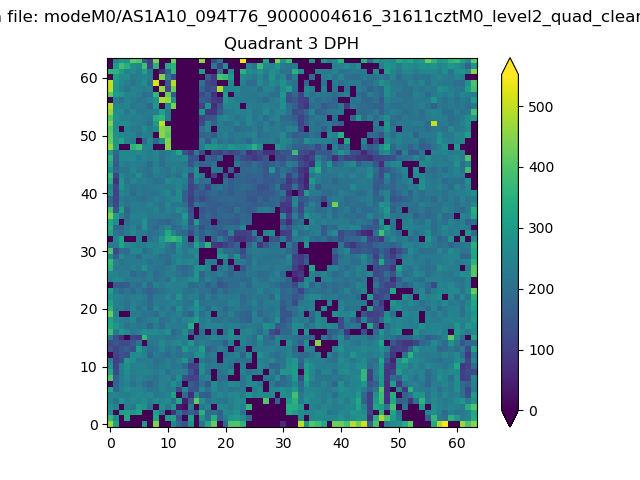 |
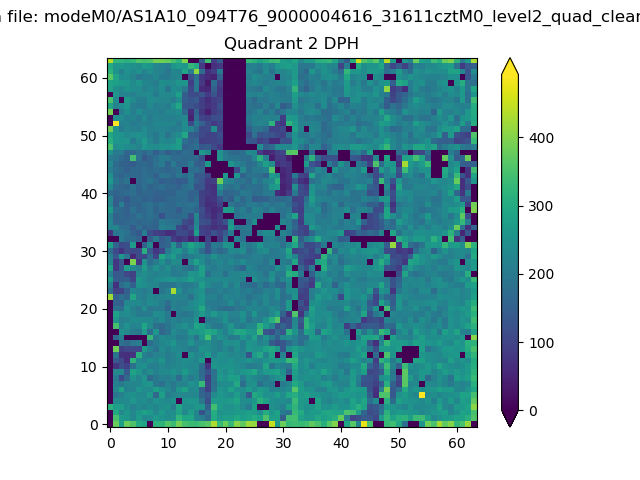 |
Quadrant C |
| Plot type | Count rate plots | Images |
|---|---|---|
| Comparison with Poisson distribution Blue bars denote a histogram of data divided into 1 sec bins. Red curve is a Poisson curve with rate = median count rate of data. |
 |
 |
| Quadrant-wise count rates Data is divided into 100 sec bins |
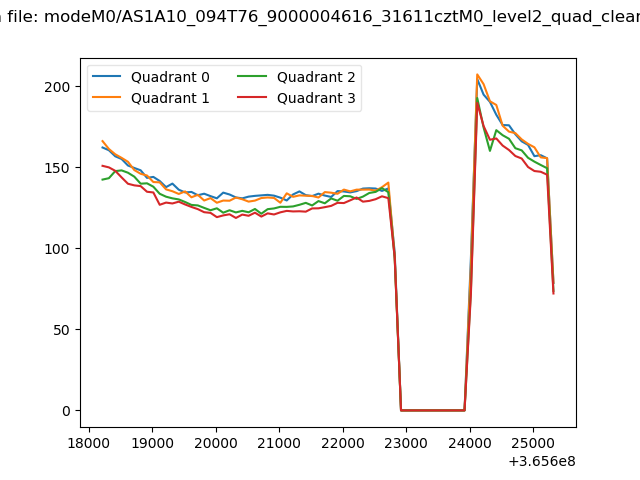 |
|
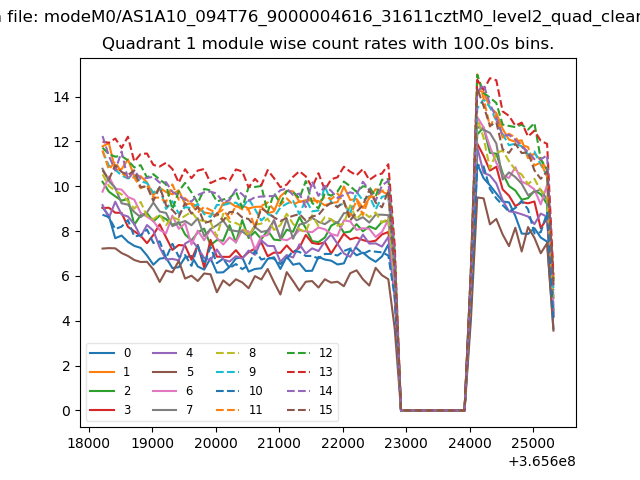
| Module-wise count rates for Quadrant A Data is divided into 100 sec bins |
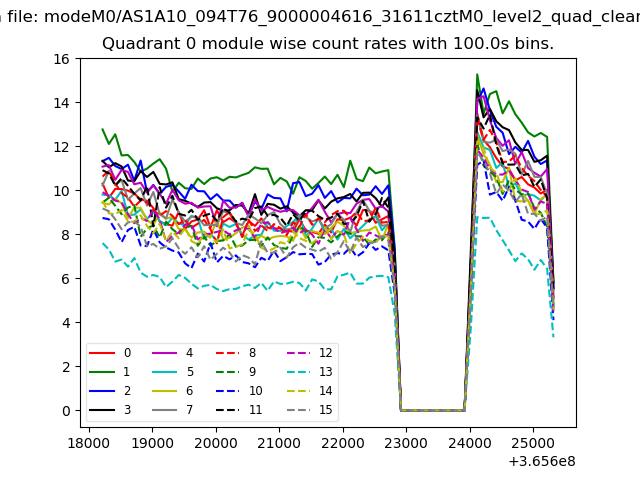 |
 |
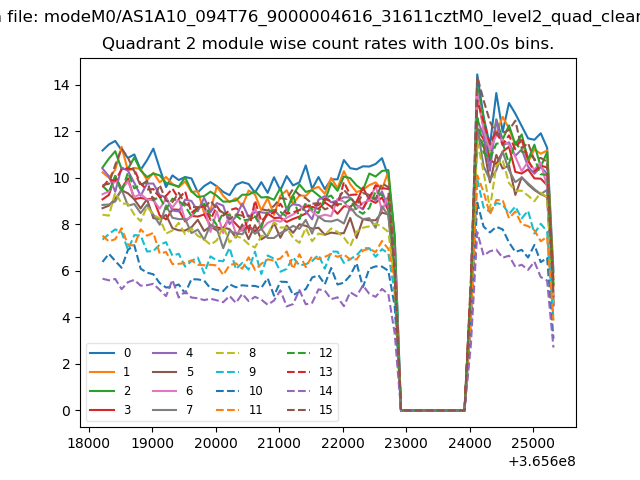
| Module-wise count rates for Quadrant B Data is divided into 100 sec bins |
 |
 |
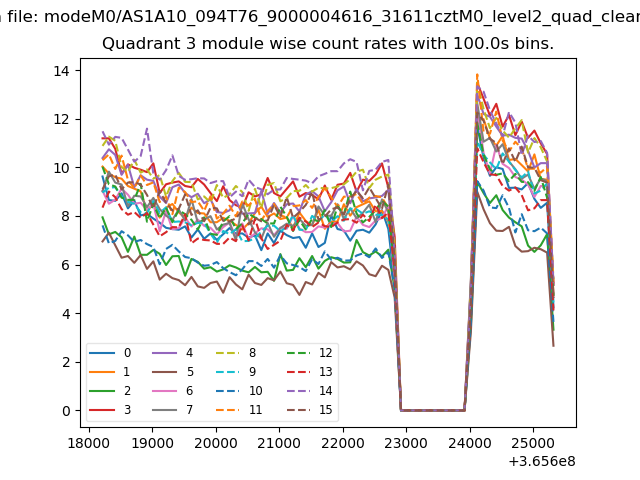
| Module-wise count rates for Quadrant C Data is divided into 100 sec bins |
 |
 |
| Module-wise count rates for Quadrant D Data is divided into 100 sec bins |
 |
 |
| Parameter | Plot |
|---|---|
| CZT HV Monitor | 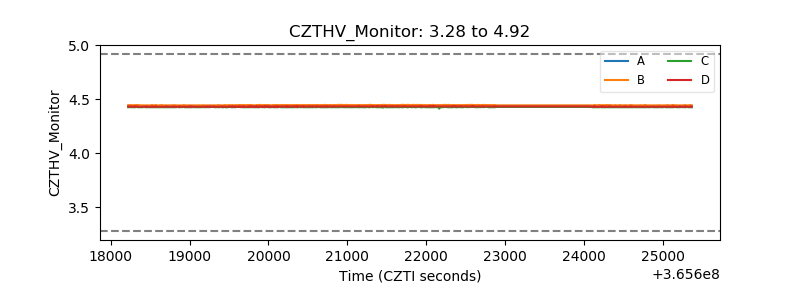 |
| D_VDD | 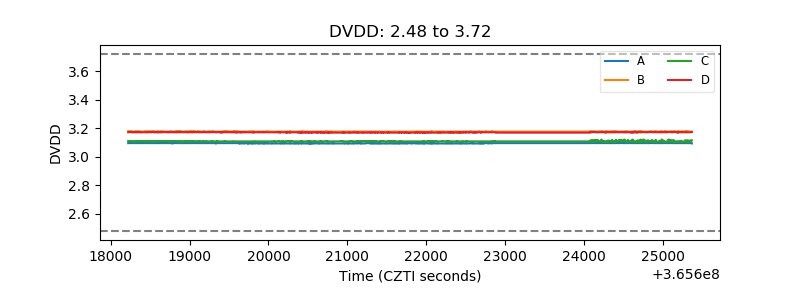 |
| Temperature 1 | 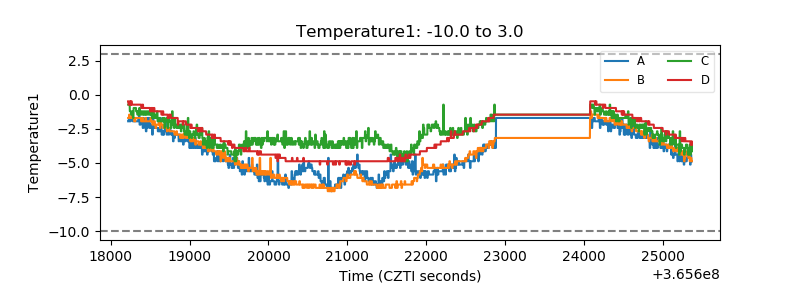 |
| Veto HV Monitor |  |
| Veto LLD | 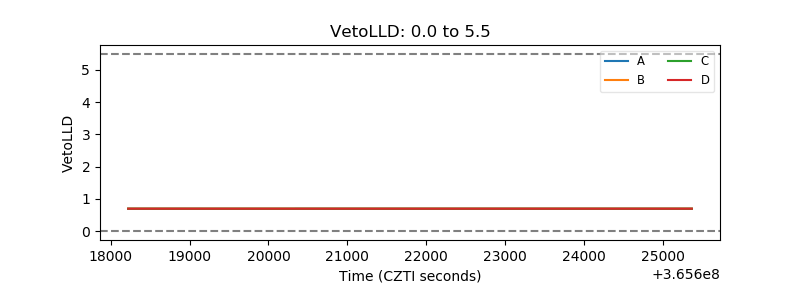 |
| Alpha Counter | 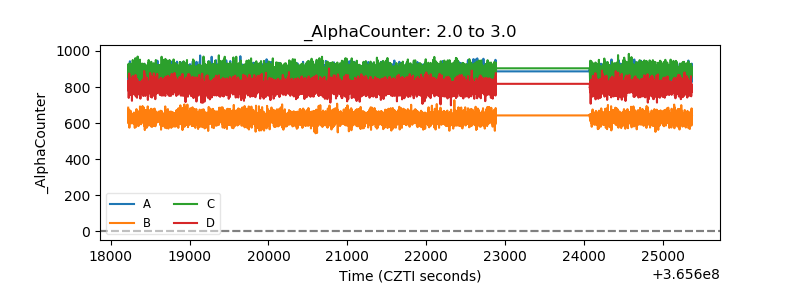 |
| _CPM_Rate | 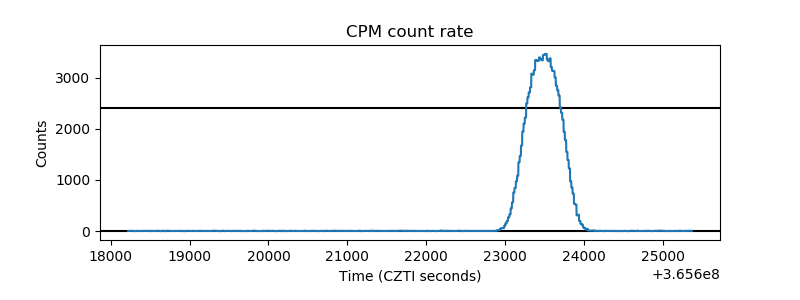 |
| CZT Counter | 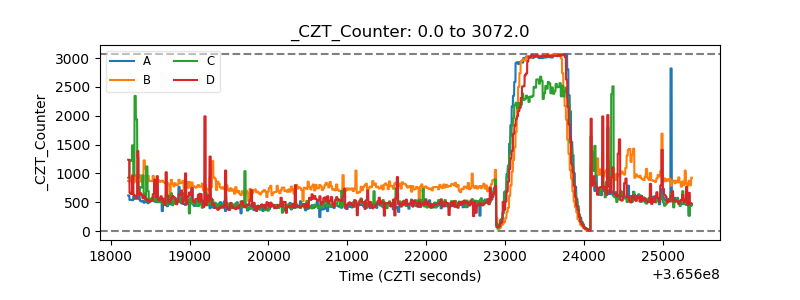 |
| +2.5 Volts monitor |  |
| +5 Volts monitor |  |
| _ROLL_ROT | 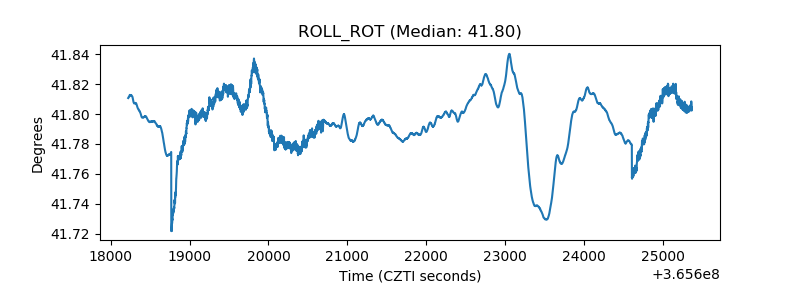 |
| _Roll_DEC |  |
| _Roll_RA | 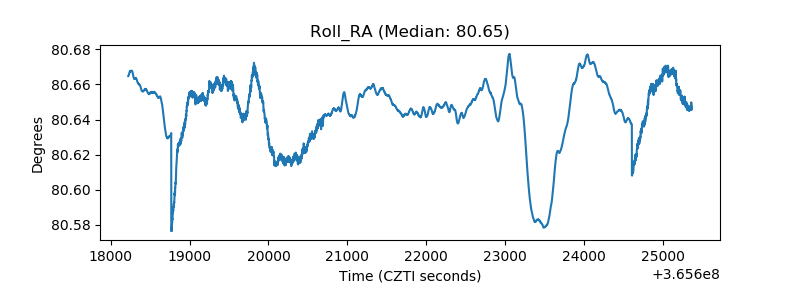 |
| Veto Counter | 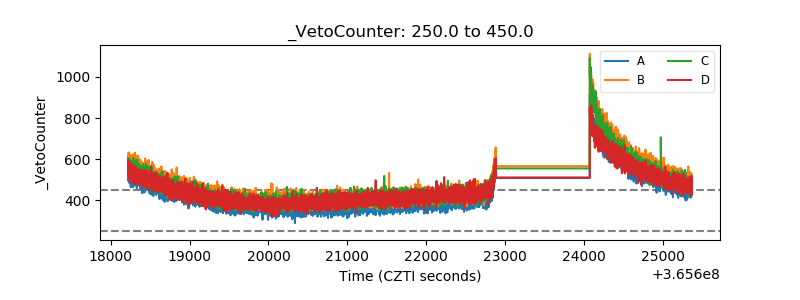 |