| Param | Original file | Final file |
|---|---|---|
| Filename | modeM0/AS1A10_123T01_9000004620_31615cztM0_level2.evt | modeM0/AS1A10_123T01_9000004620_31615cztM0_level2_quad_clean.evt |
| Size (bytes) | 188,415,360 | 17,176,320 |
| Size | 179.7 MB | 16.4 MB |
| Events in quadrant A | 1,486,160 | 91,638 |
| Events in quadrant B | 1,713,783 | 93,566 |
| Events in quadrant C | 1,067,206 | 90,475 |
| Events in quadrant D | 1,288,479 | 85,557 |
| Mode M0 | |||
|---|---|---|---|
| Quadrant | BADHDUFLAG | Total packets | Discarded packets |
| A | 0 | 7937 | 2161 |
| B | 0 | 7690 | 1126 |
| C | 0 | 5175 | 737 |
| D | 0 | 6175 | 985 |
| Mode SS | |||
|---|---|---|---|
| Quadrant | BADHDUFLAG | Total packets | Discarded packets |
| A | 0 | 54 | 10 |
| B | 0 | 54 | 10 |
| C | 0 | 54 | 8 |
| D | 0 | 55 | 11 |
| Quadrant | Total seconds | Saturated seconds | Saturation percentage |
|---|---|---|---|
| A | 2151 | 241 | 11.204091% |
| B | 2182 | 4 | 0.183318% |
| C | 2204 | 10 | 0.453721% |
| D | 2192 | 7 | 0.319343% |
Noise dominated data is calculated using 1-second bins in cleaned event files. If a bin has >2000 counts, and if more than 50% of those come from <1% of pixels, then it is considered to be noise-dominated and hence unusable.
| Quadrant | # 1 sec bins | Bins with >0 counts | Bins with >2000 counts | High rate bins dominated by noise | Noise dominated (total time) | Noise dominated (detector-on time) | Marked lightcurve |
|---|---|---|---|---|---|---|---|
| A | 5582 | 2215 | 168 | 168 | 3.01% | 7.58% | 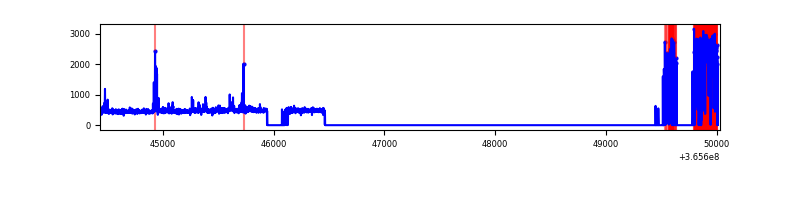 |
| B | 5598 | 2236 | 0 | 0 | 0.00% | 0.00% | 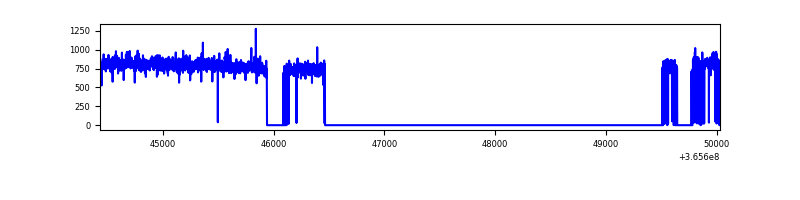 |
| C | 5594 | 2257 | 0 | 0 | 0.00% | 0.00% | 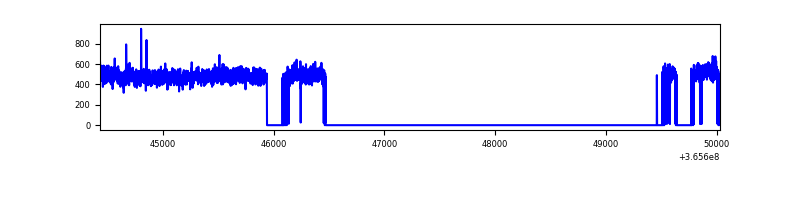 |
| D | 5594 | 2242 | 4 | 4 | 0.07% | 0.18% | 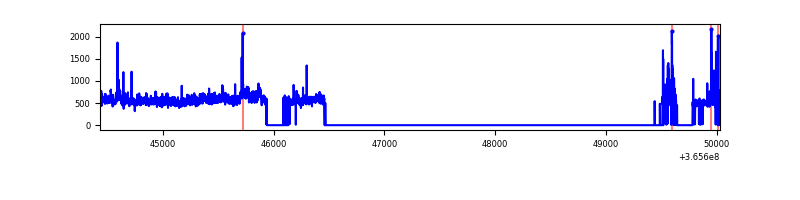 |
Top three noisy pixels from each quadrant. If the there are fewer than three noisy pixels in the level2.evt file, extra rows are filled as -1
| Pixel properties | Quadrant properties | ||||||
|---|---|---|---|---|---|---|---|
| Quadrant | DetID | PixID | Counts | Sigma | Mean | Median | Sigma |
| A | 0 | 13 | 571175 | 11623.57 | 236 | 232 | 49.1 |
| A | 13 | 254 | 3602 | 68.61 | 236 | 232 | 49.1 |
| A | 3 | 137 | 2346 | 43.04 | 236 | 232 | 49.1 |
| B | 6 | 159 | 660812 | 12785.87 | 261 | 255 | 51.7 |
| B | 4 | 80 | 23174 | 443.62 | 261 | 255 | 51.7 |
| B | 12 | 111 | 5967 | 110.56 | 261 | 255 | 51.7 |
| C | 14 | 238 | 45506 | 739.89 | 255 | 256 | 61.2 |
| C | 3 | 233 | 11312 | 180.78 | 255 | 256 | 61.2 |
| C | 4 | 175 | 7065 | 111.34 | 255 | 256 | 61.2 |
| D | 8 | 195 | 197803 | 3156.04 | 252 | 245 | 62.6 |
| D | 10 | 203 | 65908 | 1048.98 | 252 | 245 | 62.6 |
| D | 2 | 250 | 47692 | 757.98 | 252 | 245 | 62.6 |
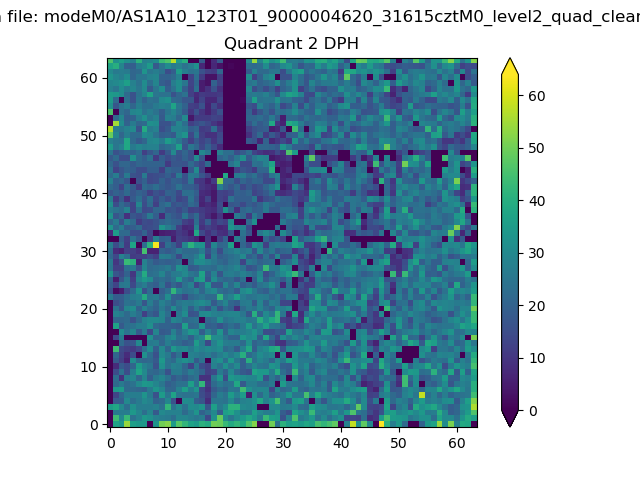
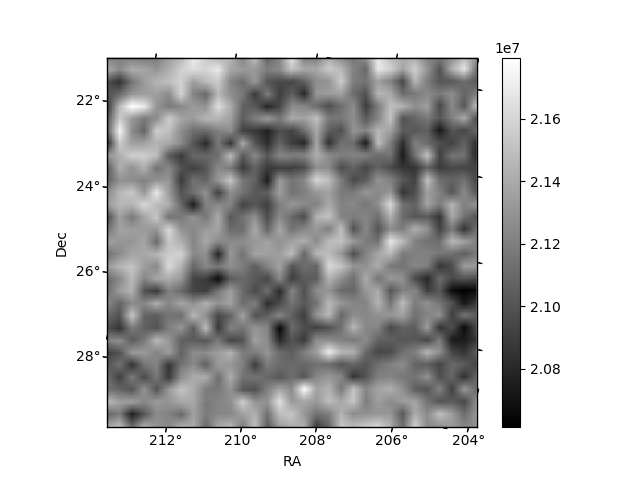
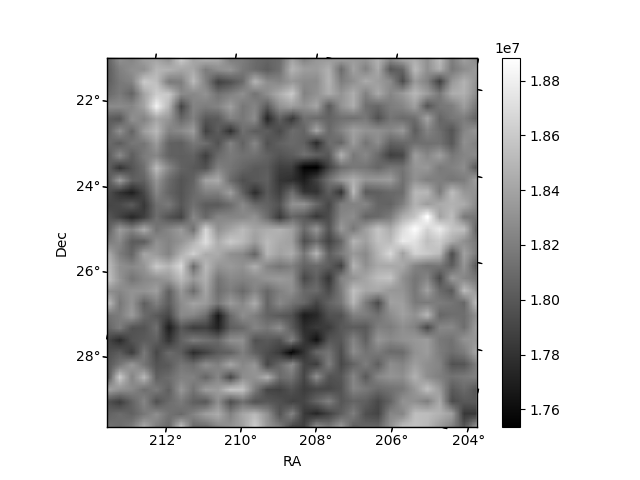
Histogram calculated using DETX and DETY for each event in the final _common_clean file
| Quadrant A | 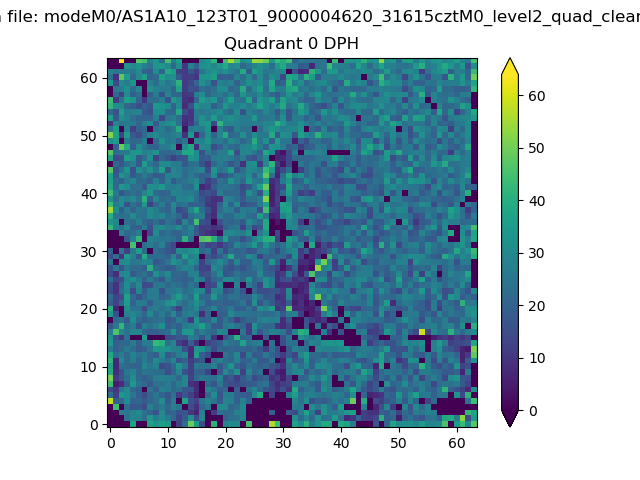 |
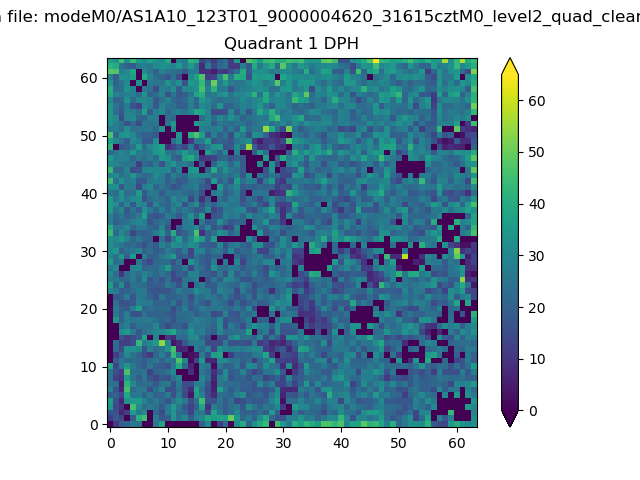 |
Quadrant B |
|---|---|---|---|
| Quadrant D | 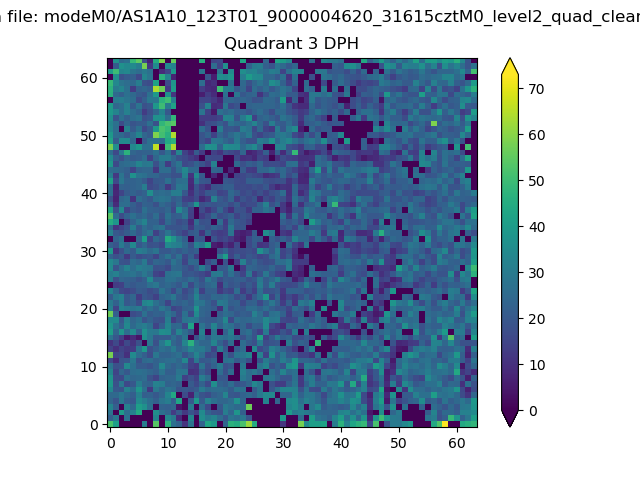 |
 |
Quadrant C |
| Plot type | Count rate plots | Images |
|---|---|---|
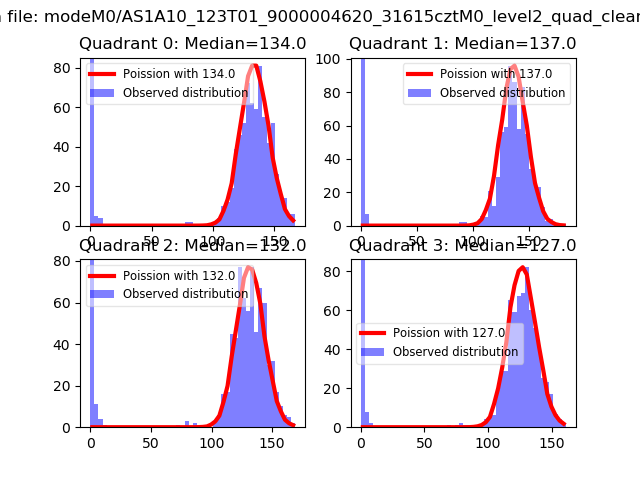
| Comparison with Poisson distribution Blue bars denote a histogram of data divided into 1 sec bins. Red curve is a Poisson curve with rate = median count rate of data. |
 |
 |
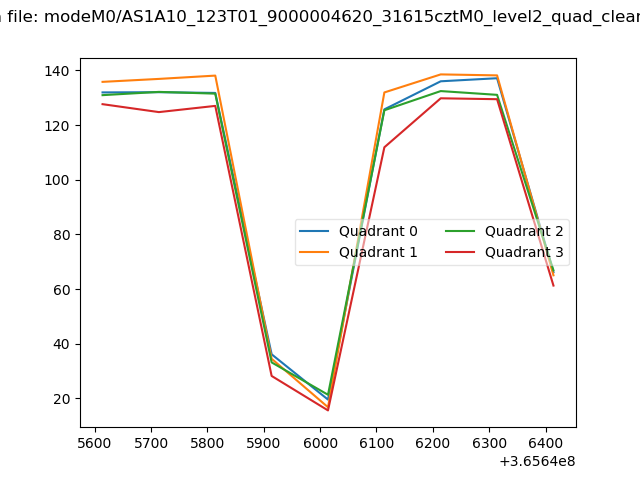
| Quadrant-wise count rates Data is divided into 100 sec bins |
 |
|
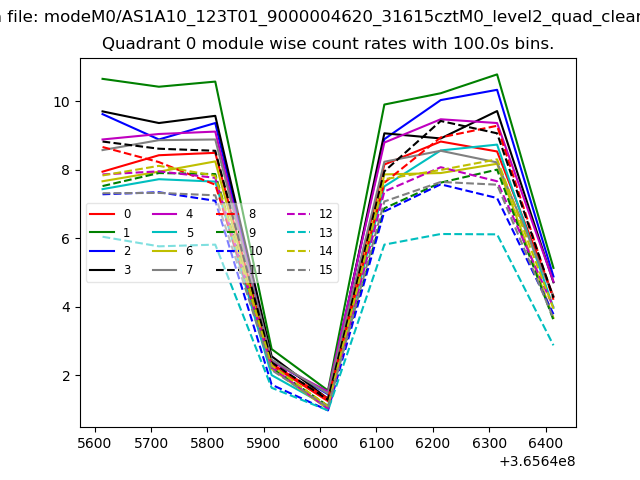
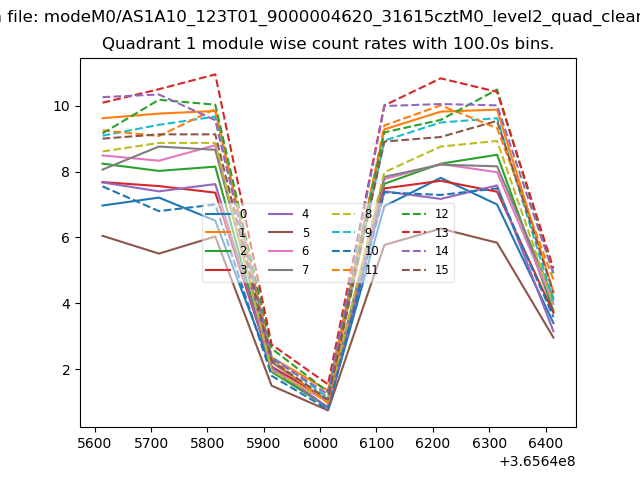
| Module-wise count rates for Quadrant A Data is divided into 100 sec bins |
 |
 |
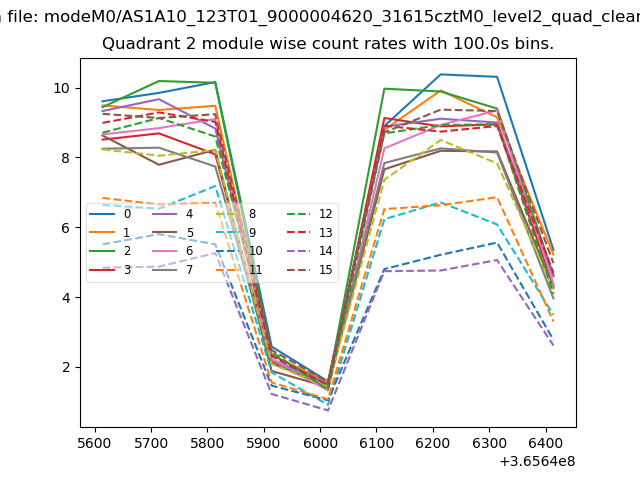
| Module-wise count rates for Quadrant B Data is divided into 100 sec bins |
 |
 |
| Module-wise count rates for Quadrant C Data is divided into 100 sec bins |
 |
 |
| Module-wise count rates for Quadrant D Data is divided into 100 sec bins |
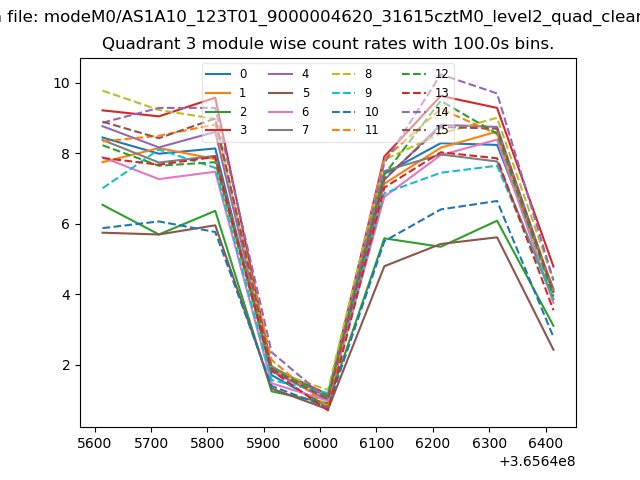 |
 |
| Parameter | Plot |
|---|---|
| CZT HV Monitor | 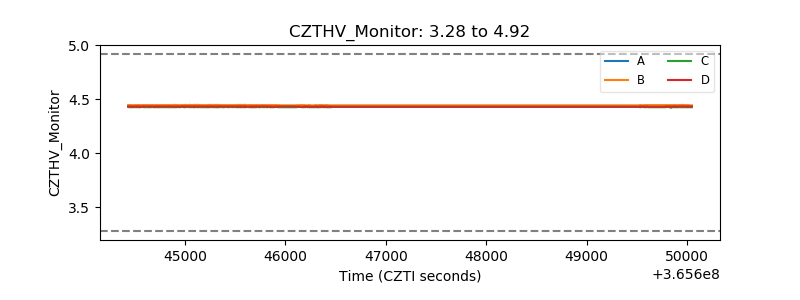 |
| D_VDD | 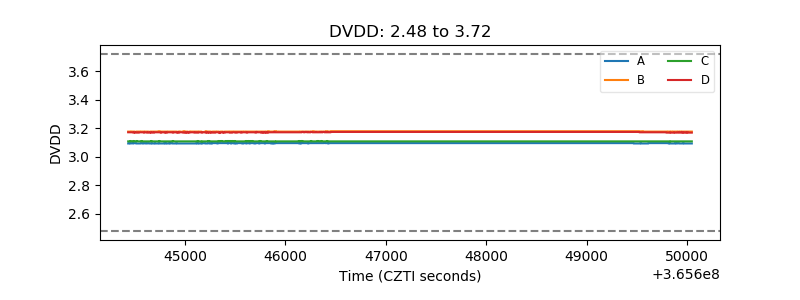 |
| Temperature 1 |  |
| Veto HV Monitor | 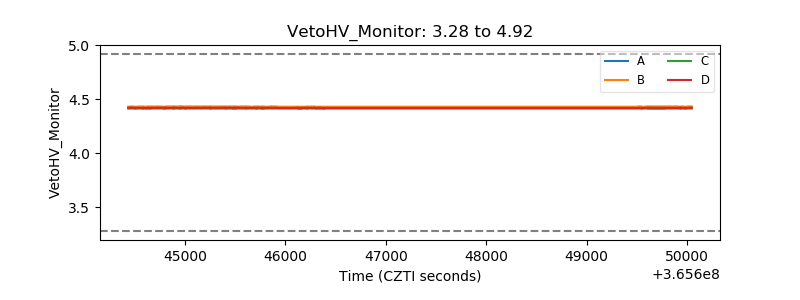 |
| Veto LLD | 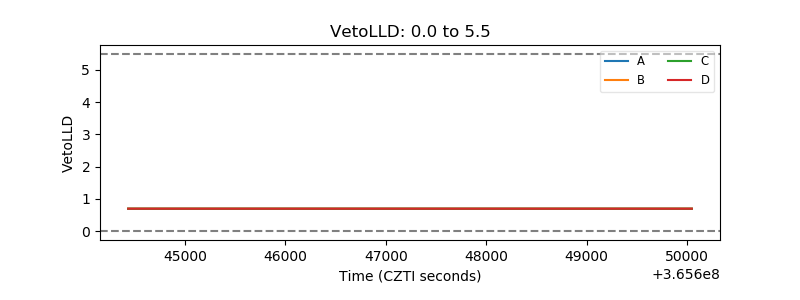 |
| Alpha Counter | 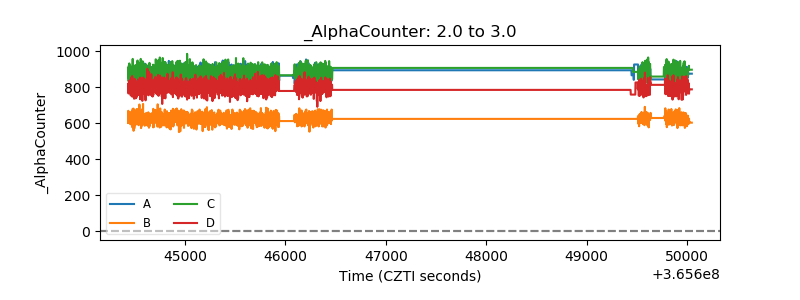 |
| _CPM_Rate | 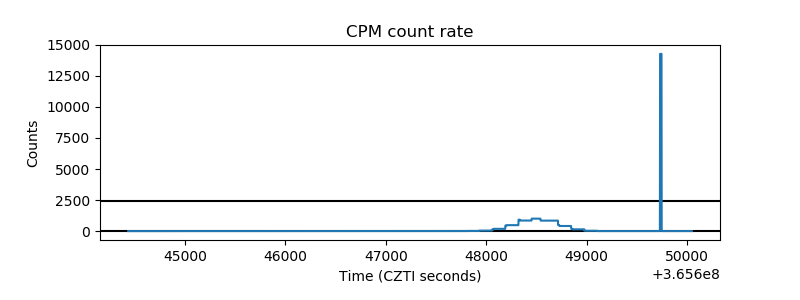 |
| CZT Counter | 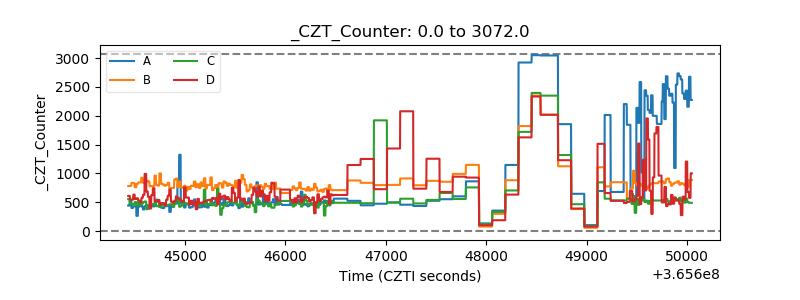 |
| +2.5 Volts monitor |  |
| +5 Volts monitor |  |
| _ROLL_ROT | 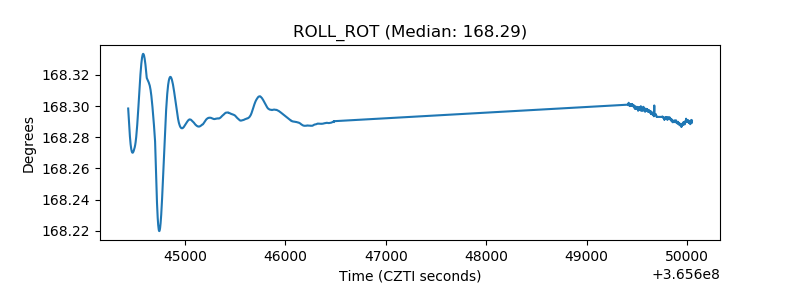 |
| _Roll_DEC | 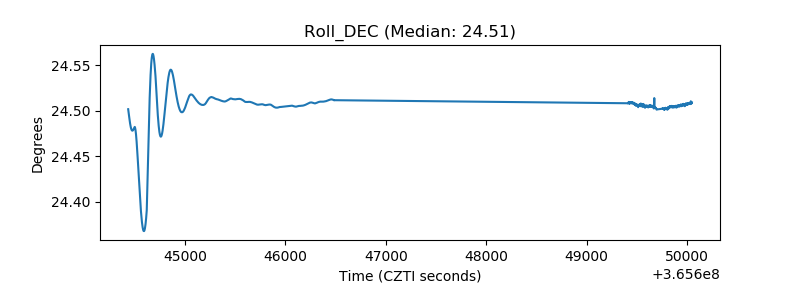 |
| _Roll_RA | 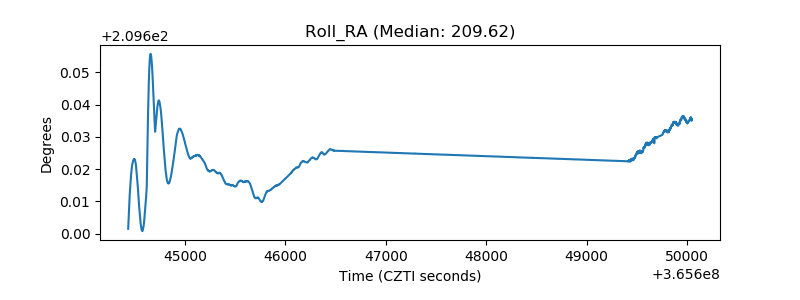 |
| Veto Counter | 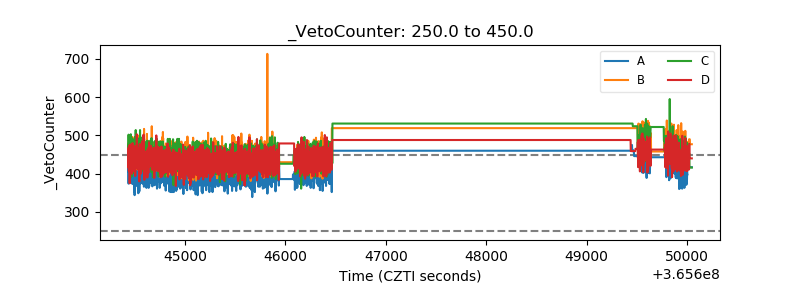 |