| Param | Original file | Final file |
|---|---|---|
| Filename | modeM0/AS1A10_123T01_9000004620_31616cztM0_level2.evt | modeM0/AS1A10_123T01_9000004620_31616cztM0_level2_quad_clean.evt |
| Size (bytes) | 210,032,640 | 23,172,480 |
| Size | 200.3 MB | 22.1 MB |
| Events in quadrant A | 2,055,190 | 115,934 |
| Events in quadrant B | 1,648,037 | 156,100 |
| Events in quadrant C | 1,315,686 | 145,520 |
| Events in quadrant D | 1,215,393 | 149,240 |
| Mode M0 | |||
|---|---|---|---|
| Quadrant | BADHDUFLAG | Total packets | Discarded packets |
| A | 0 | 8458 | 1124 |
| B | 0 | 6783 | 614 |
| C | 0 | 5803 | 727 |
| D | 0 | 5464 | 545 |
| Mode M9 | |||
|---|---|---|---|
| Quadrant | BADHDUFLAG | Total packets | Discarded packets |
| A | 0 | 1 | 1 |
| B | 0 | 1 | 1 |
| C | 0 | 1 | 1 |
| D | 0 | 1 | 1 |
| Mode SS | |||
|---|---|---|---|
| Quadrant | BADHDUFLAG | Total packets | Discarded packets |
| A | 0 | 43 | 7 |
| B | 0 | 46 | 8 |
| C | 0 | 46 | 6 |
| D | 0 | 46 | 6 |
| Quadrant | Total seconds | Saturated seconds | Saturation percentage |
|---|---|---|---|
| A | 1815 | 561 | 30.909091% |
| B | 1831 | 90 | 4.915347% |
| C | 1829 | 157 | 8.583926% |
| D | 1834 | 33 | 1.799346% |
Noise dominated data is calculated using 1-second bins in cleaned event files. If a bin has >2000 counts, and if more than 50% of those come from <1% of pixels, then it is considered to be noise-dominated and hence unusable.
| Quadrant | # 1 sec bins | Bins with >0 counts | Bins with >2000 counts | High rate bins dominated by noise | Noise dominated (total time) | Noise dominated (detector-on time) | Marked lightcurve |
|---|---|---|---|---|---|---|---|
| A | 4659 | 1849 | 368 | 368 | 7.90% | 19.90% | 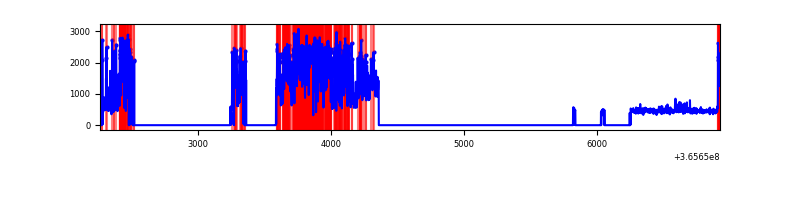 |
| B | 4658 | 1865 | 3 | 3 | 0.06% | 0.16% | 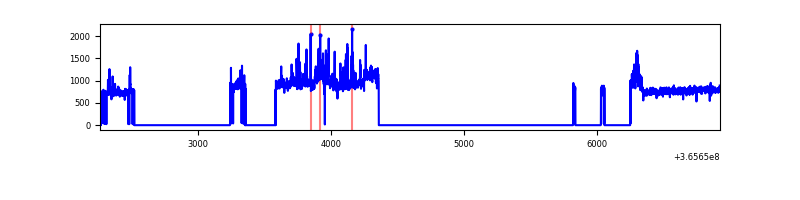 |
| C | 4663 | 1853 | 38 | 38 | 0.81% | 2.05% | 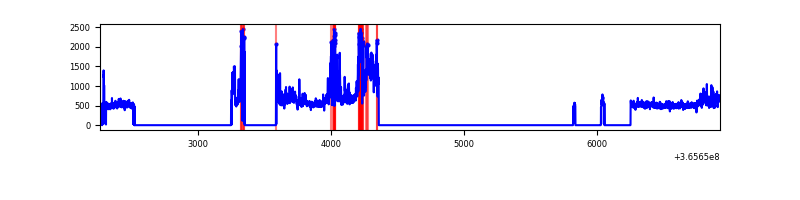 |
| D | 4657 | 1861 | 9 | 9 | 0.19% | 0.48% | 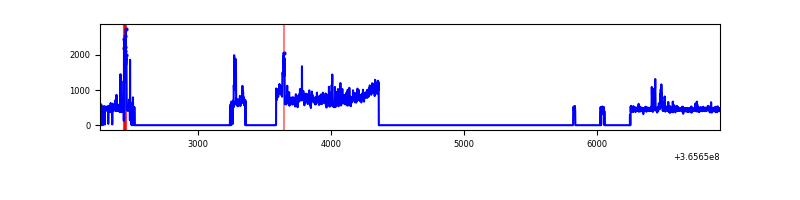 |
Top three noisy pixels from each quadrant. If the there are fewer than three noisy pixels in the level2.evt file, extra rows are filled as -1
| Pixel properties | Quadrant properties | ||||||
|---|---|---|---|---|---|---|---|
| Quadrant | DetID | PixID | Counts | Sigma | Mean | Median | Sigma |
| A | 0 | 13 | 1266998 | 29109.34 | 203 | 198 | 43.5 |
| A | 13 | 254 | 3108 | 66.87 | 203 | 198 | 43.5 |
| A | 13 | 6 | 2162 | 45.13 | 203 | 198 | 43.5 |
| B | 6 | 159 | 547071 | 11503.0 | 235 | 229 | 47.5 |
| B | 0 | 190 | 45311 | 948.31 | 235 | 229 | 47.5 |
| B | 4 | 80 | 45174 | 945.43 | 235 | 229 | 47.5 |
| C | 3 | 233 | 357213 | 6525.95 | 223 | 224 | 54.7 |
| C | 14 | 238 | 37403 | 679.65 | 223 | 224 | 54.7 |
| C | 0 | 10 | 33693 | 611.83 | 223 | 224 | 54.7 |
| D | 8 | 195 | 200207 | 3484.36 | 231 | 226 | 57.4 |
| D | 7 | 223 | 76421 | 1327.58 | 231 | 226 | 57.4 |
| D | 2 | 250 | 25219 | 435.46 | 231 | 226 | 57.4 |
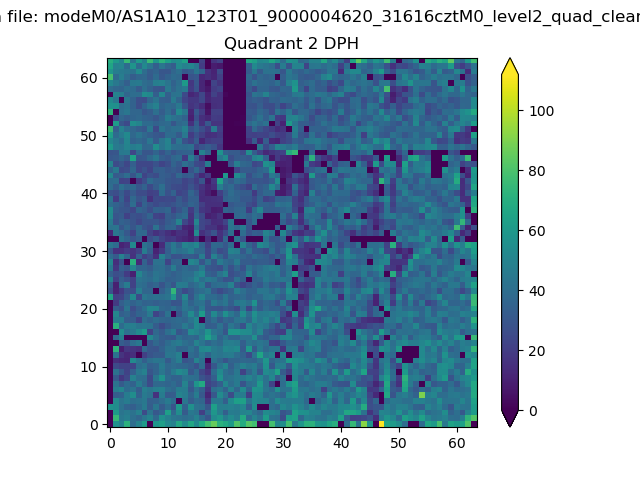
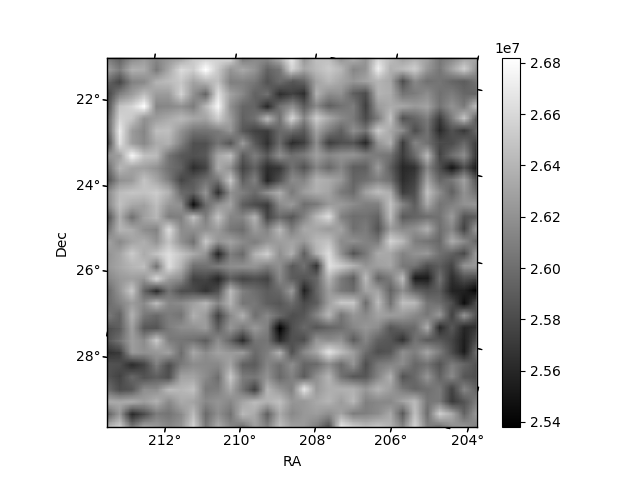
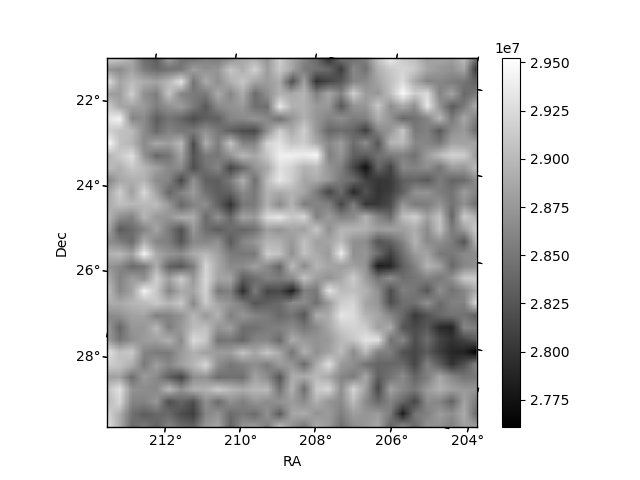
Histogram calculated using DETX and DETY for each event in the final _common_clean file
| Quadrant A | 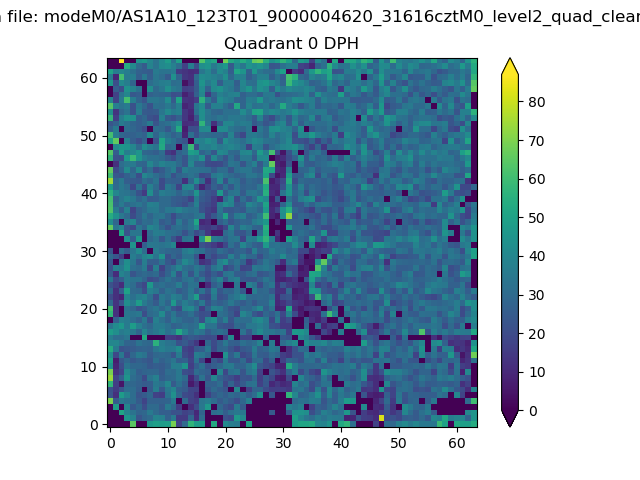 |
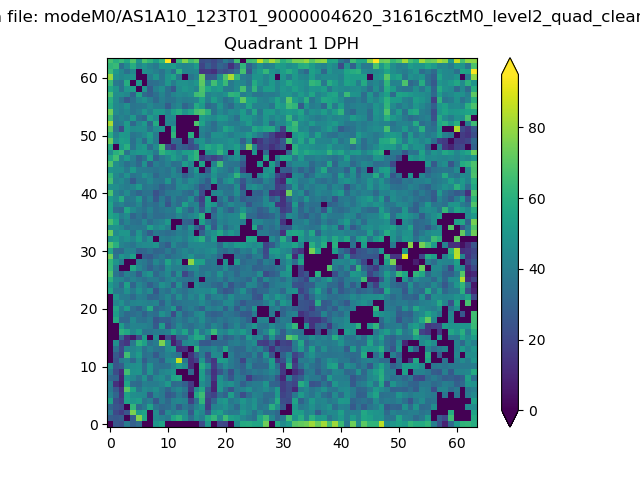 |
Quadrant B |
|---|---|---|---|
| Quadrant D | 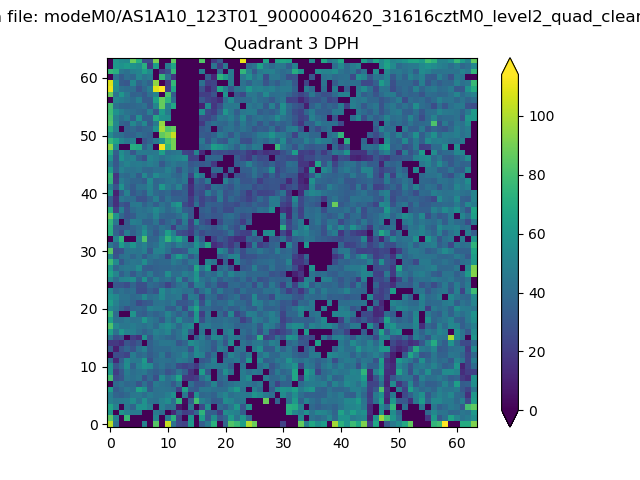 |
 |
Quadrant C |
| Plot type | Count rate plots | Images |
|---|---|---|
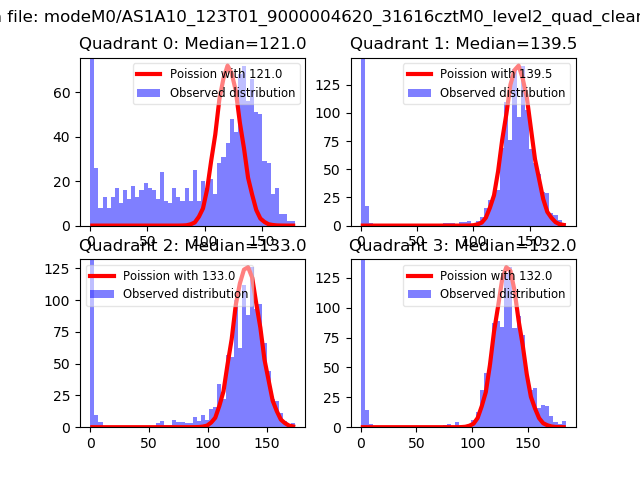
| Comparison with Poisson distribution Blue bars denote a histogram of data divided into 1 sec bins. Red curve is a Poisson curve with rate = median count rate of data. |
 |
 |
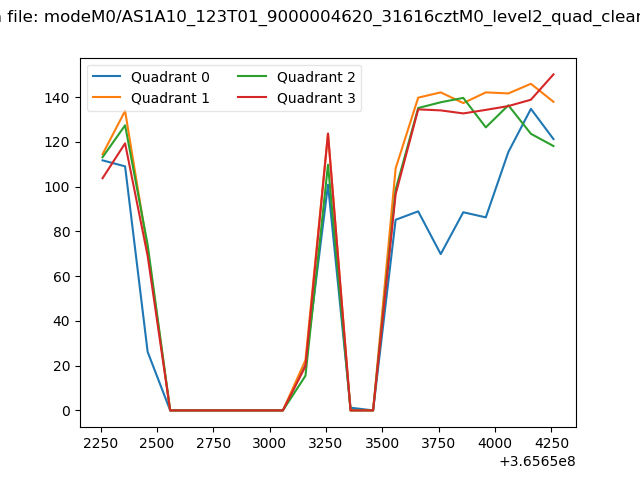
| Quadrant-wise count rates Data is divided into 100 sec bins |
 |
|
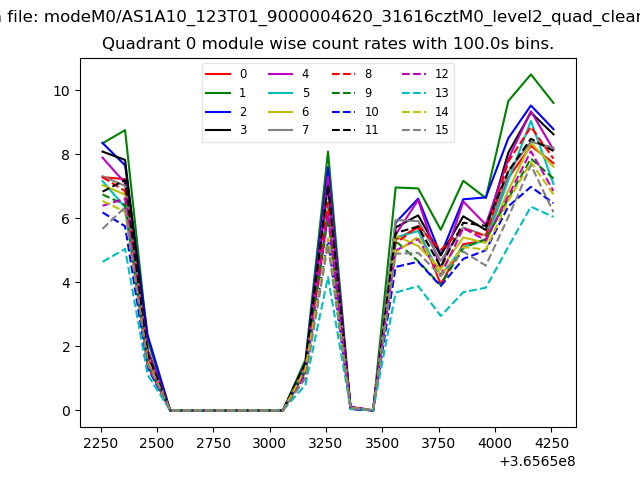
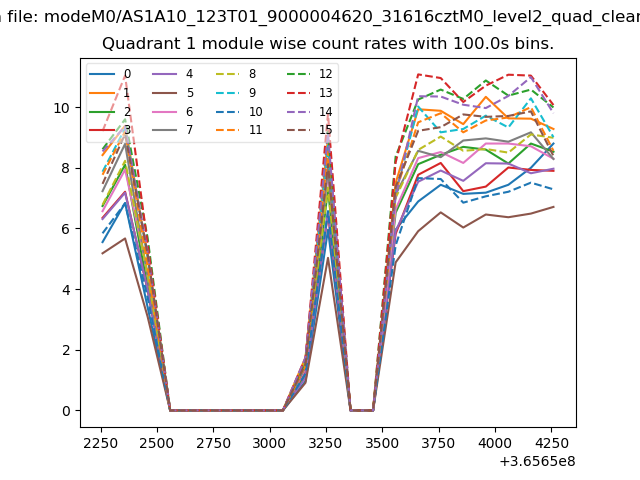
| Module-wise count rates for Quadrant A Data is divided into 100 sec bins |
 |
 |
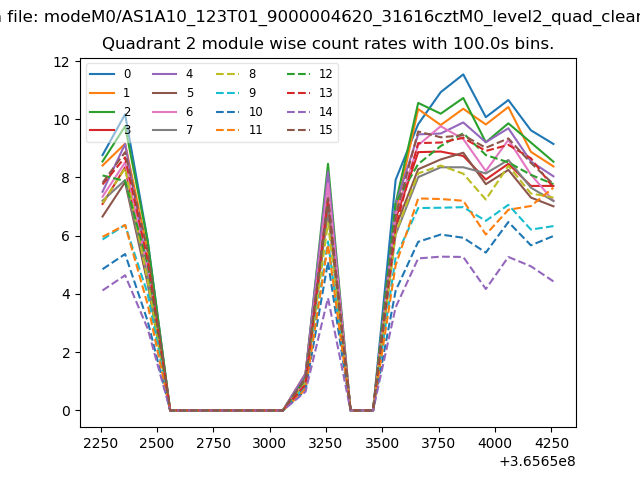
| Module-wise count rates for Quadrant B Data is divided into 100 sec bins |
 |
 |
| Module-wise count rates for Quadrant C Data is divided into 100 sec bins |
 |
 |
| Module-wise count rates for Quadrant D Data is divided into 100 sec bins |
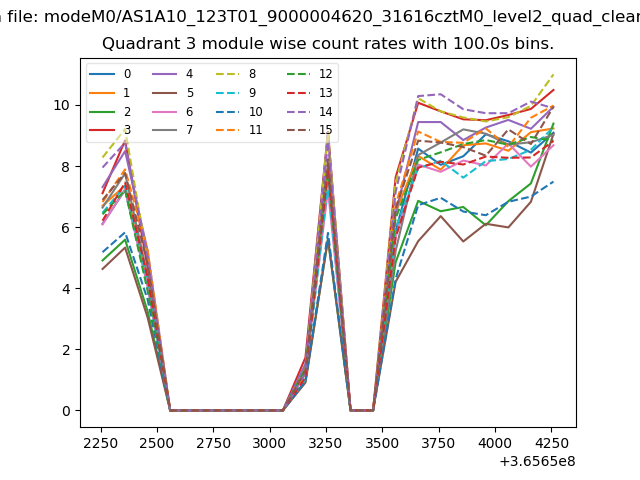 |
 |
| Parameter | Plot |
|---|---|
| CZT HV Monitor | 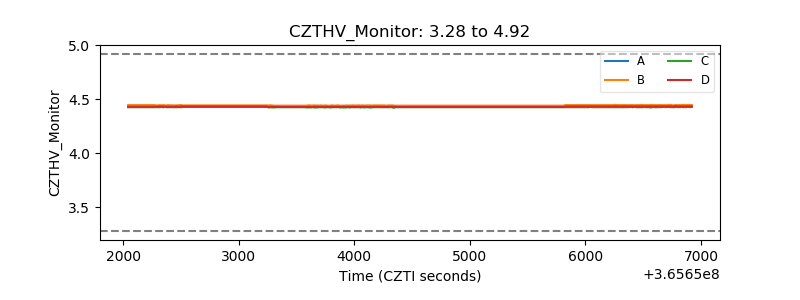 |
| D_VDD | 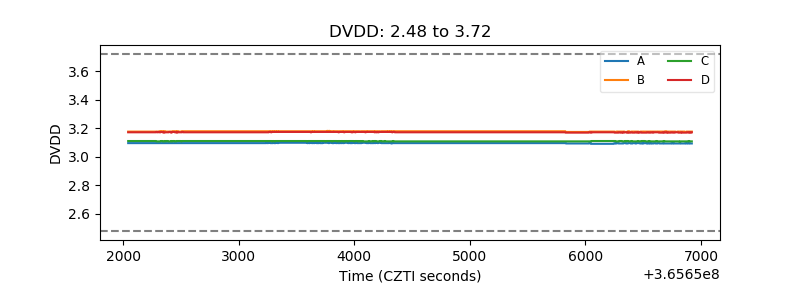 |
| Temperature 1 | 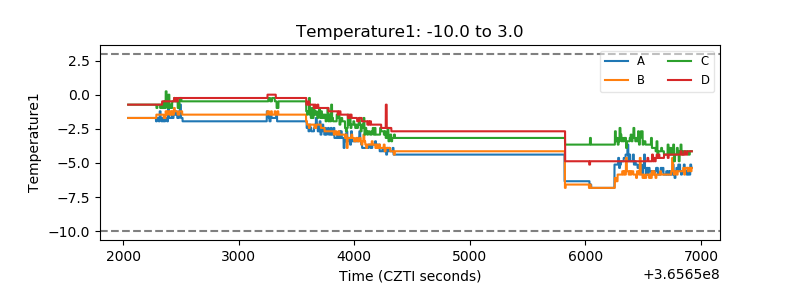 |
| Veto HV Monitor |  |
| Veto LLD | 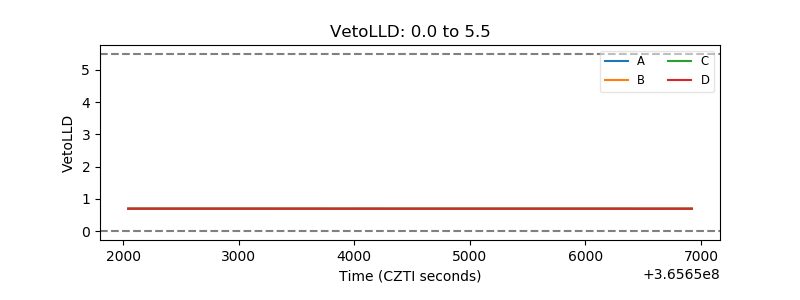 |
| Alpha Counter | 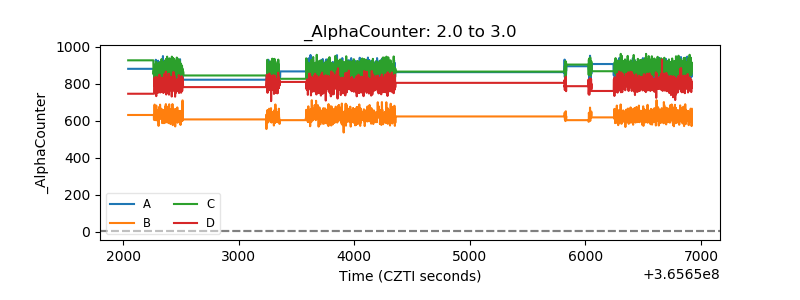 |
| _CPM_Rate | 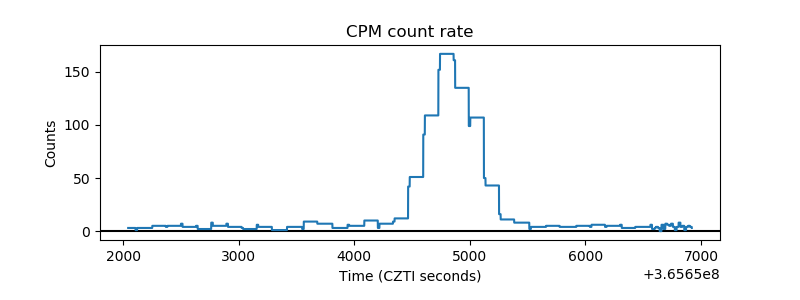 |
| CZT Counter | 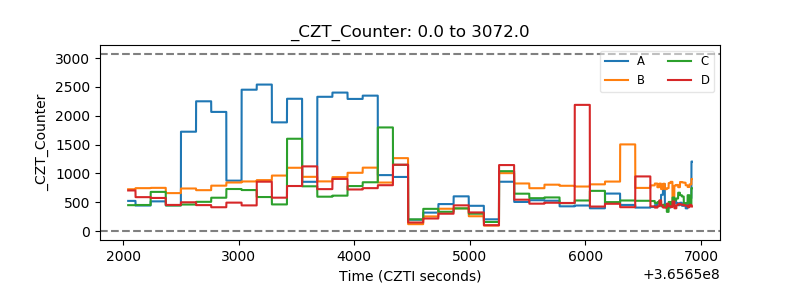 |
| +2.5 Volts monitor |  |
| +5 Volts monitor |  |
| _ROLL_ROT | 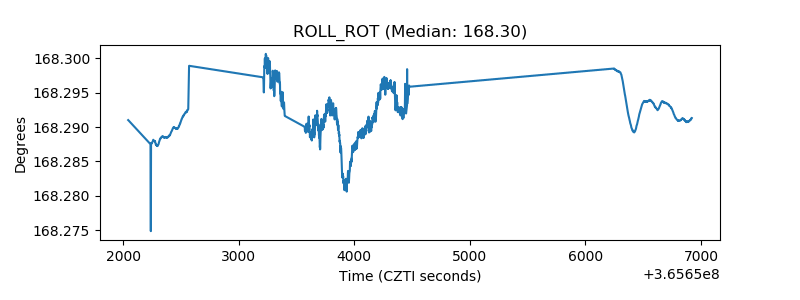 |
| _Roll_DEC | 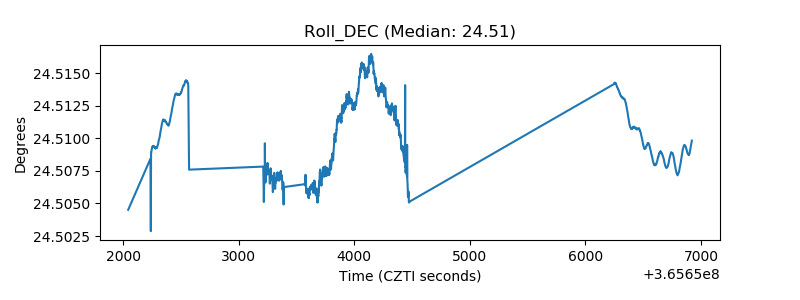 |
| _Roll_RA | 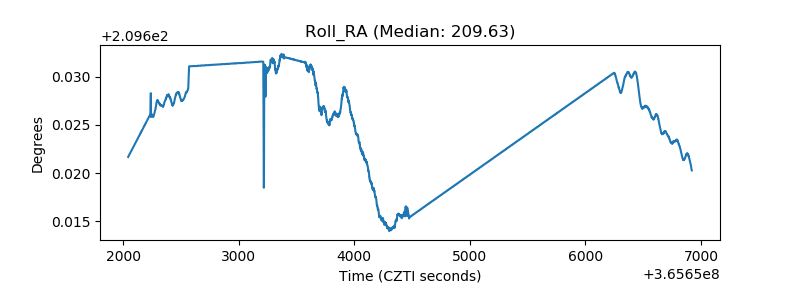 |
| Veto Counter | 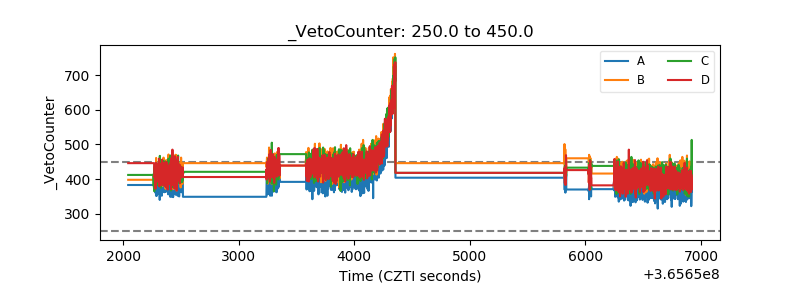 |