| Param | Original file | Final file |
|---|---|---|
| Filename | modeM0/AS1A10_123T01_9000004620_31619cztM0_level2.evt | modeM0/AS1A10_123T01_9000004620_31619cztM0_level2_quad_clean.evt |
| Size (bytes) | 234,466,560 | 26,478,720 |
| Size | 223.6 MB | 25.3 MB |
| Events in quadrant A | 1,846,355 | 156,170 |
| Events in quadrant B | 1,880,929 | 160,688 |
| Events in quadrant C | 1,633,341 | 158,084 |
| Events in quadrant D | 1,572,978 | 151,303 |
| Mode M0 | |||
|---|---|---|---|
| Quadrant | BADHDUFLAG | Total packets | Discarded packets |
| A | 0 | 10198 | 3168 |
| B | 0 | 11054 | 3661 |
| C | 0 | 9389 | 3095 |
| D | 0 | 9449 | 3071 |
| Mode M9 | |||
|---|---|---|---|
| Quadrant | BADHDUFLAG | Total packets | Discarded packets |
| A | 0 | 3 | 1 |
| B | 0 | 4 | 2 |
| C | 0 | 2 | 0 |
| D | 0 | 2 | 0 |
| Mode SS | |||
|---|---|---|---|
| Quadrant | BADHDUFLAG | Total packets | Discarded packets |
| A | 0 | 73 | 21 |
| B | 0 | 72 | 18 |
| C | 0 | 76 | 24 |
| D | 0 | 74 | 26 |
| Quadrant | Total seconds | Saturated seconds | Saturation percentage |
|---|---|---|---|
| A | 2460 | 297 | 12.073171% |
| B | 2391 | 133 | 5.562526% |
| C | 2432 | 232 | 9.539474% |
| D | 2434 | 91 | 3.738702% |
Noise dominated data is calculated using 1-second bins in cleaned event files. If a bin has >2000 counts, and if more than 50% of those come from <1% of pixels, then it is considered to be noise-dominated and hence unusable.
| Quadrant | # 1 sec bins | Bins with >0 counts | Bins with >2000 counts | High rate bins dominated by noise | Noise dominated (total time) | Noise dominated (detector-on time) | Marked lightcurve |
|---|---|---|---|---|---|---|---|
| A | 7226 | 2653 | 137 | 137 | 1.90% | 5.16% | 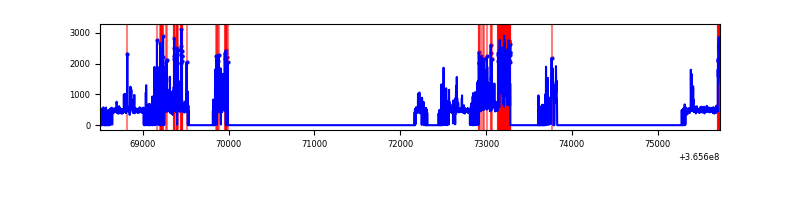 |
| B | 7213 | 2567 | 11 | 11 | 0.15% | 0.43% | 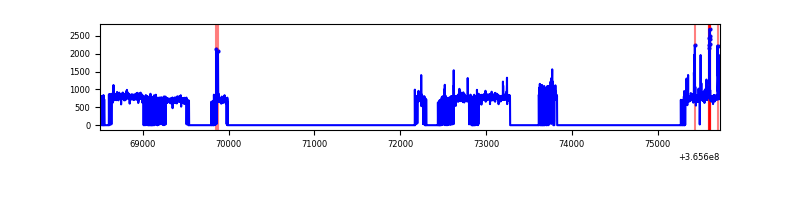 |
| C | 7209 | 2607 | 77 | 77 | 1.07% | 2.95% | 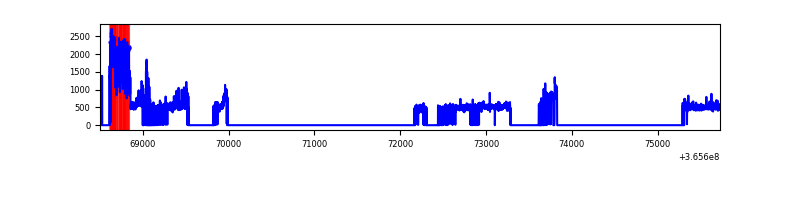 |
| D | 7227 | 2604 | 4 | 4 | 0.06% | 0.15% | 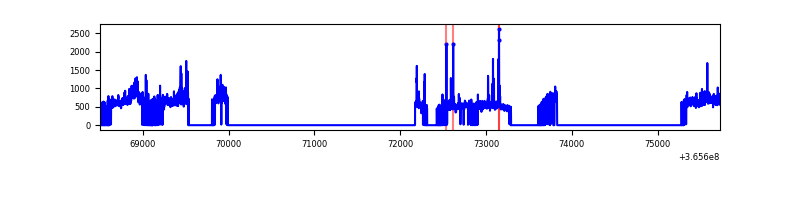 |
Top three noisy pixels from each quadrant. If the there are fewer than three noisy pixels in the level2.evt file, extra rows are filled as -1
| Pixel properties | Quadrant properties | ||||||
|---|---|---|---|---|---|---|---|
| Quadrant | DetID | PixID | Counts | Sigma | Mean | Median | Sigma |
| A | 0 | 13 | 700186 | 11527.0 | 292 | 286 | 60.7 |
| A | 15 | 174 | 17374 | 281.43 | 292 | 286 | 60.7 |
| A | 13 | 254 | 4300 | 66.11 | 292 | 286 | 60.7 |
| B | 6 | 159 | 621172 | 10546.49 | 291 | 283 | 58.9 |
| B | 10 | 245 | 71236 | 1205.22 | 291 | 283 | 58.9 |
| B | 4 | 80 | 12132 | 201.27 | 291 | 283 | 58.9 |
| C | 3 | 233 | 448414 | 6436.01 | 285 | 287 | 69.6 |
| C | 14 | 238 | 45684 | 651.99 | 285 | 287 | 69.6 |
| C | 0 | 10 | 8110 | 112.35 | 285 | 287 | 69.6 |
| D | 8 | 195 | 370269 | 5081.93 | 294 | 284 | 72.8 |
| D | 2 | 250 | 42090 | 574.23 | 294 | 284 | 72.8 |
| D | 10 | 203 | 24672 | 334.98 | 294 | 284 | 72.8 |
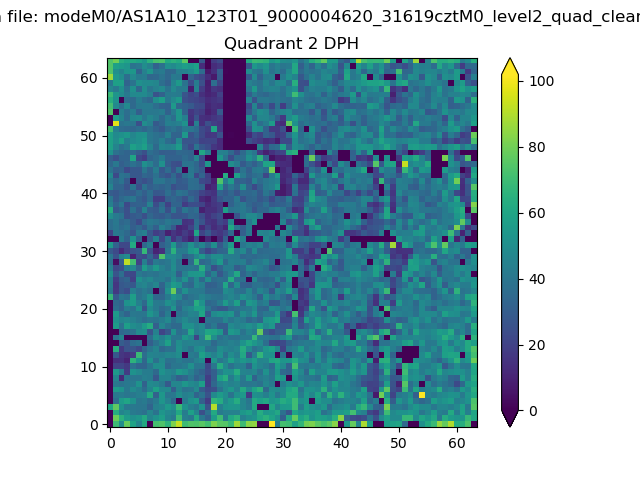
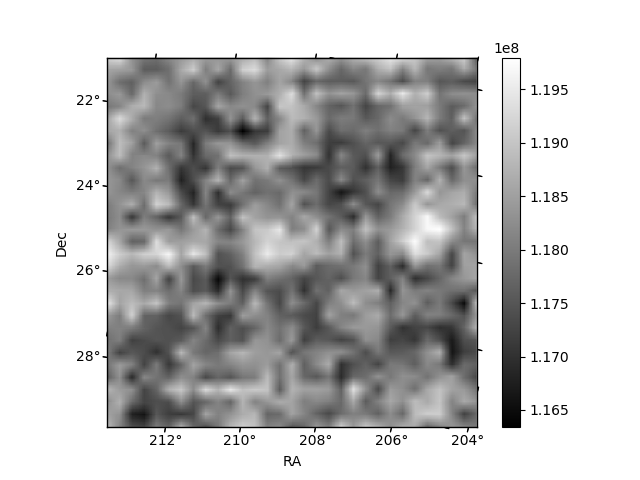
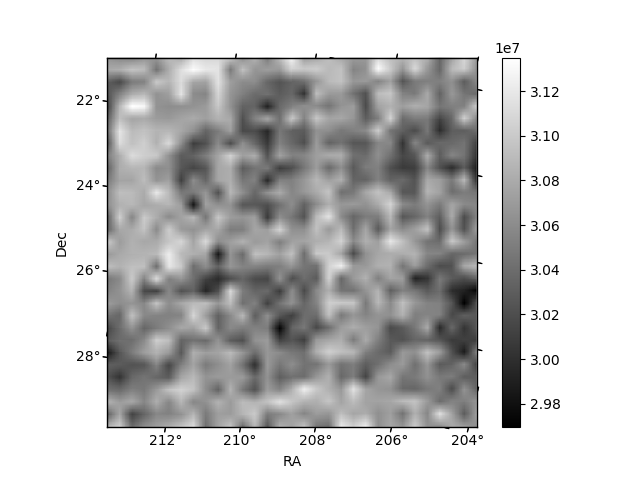
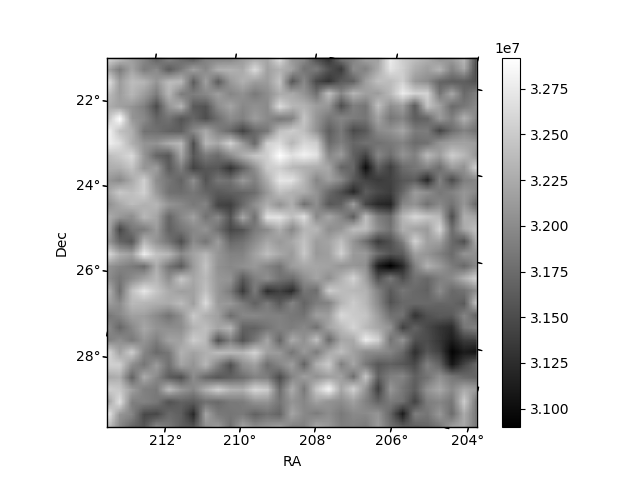
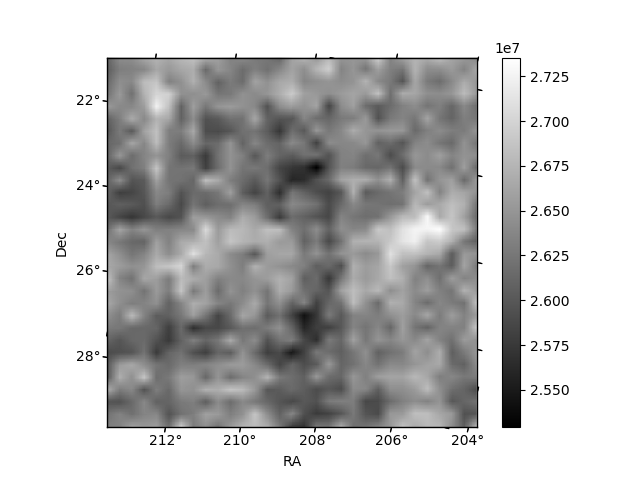
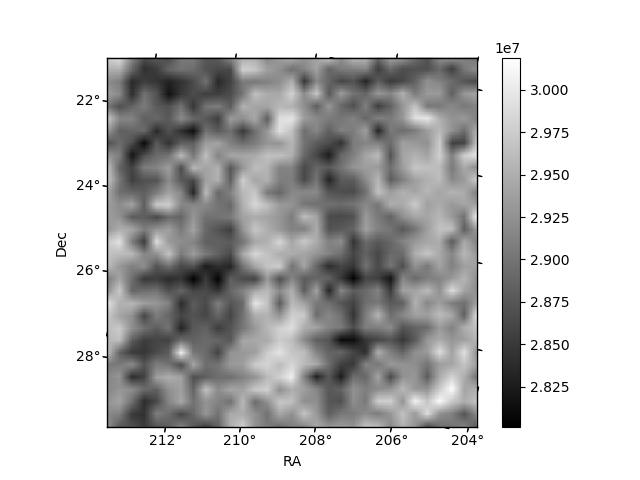
Histogram calculated using DETX and DETY for each event in the final _common_clean file
| Quadrant A | 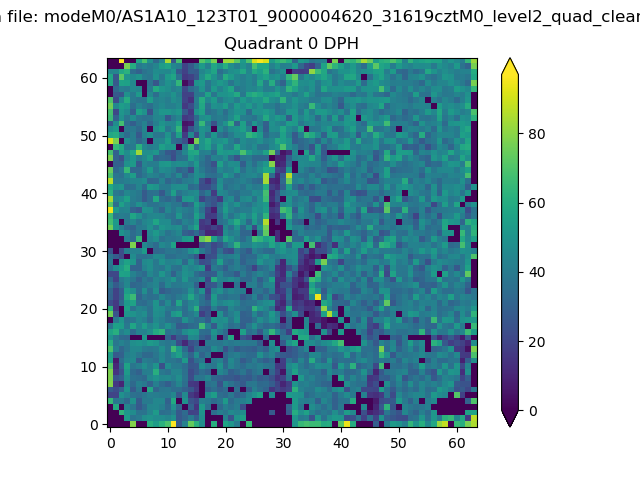 |
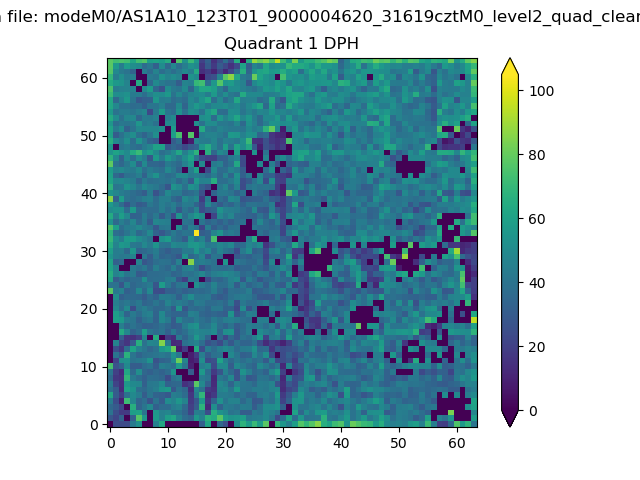 |
Quadrant B |
|---|---|---|---|
| Quadrant D | 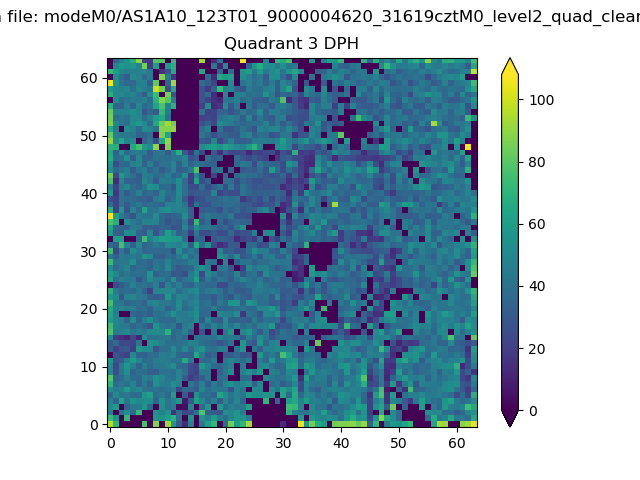 |
 |
Quadrant C |
| Plot type | Count rate plots | Images |
|---|---|---|
| Comparison with Poisson distribution Blue bars denote a histogram of data divided into 1 sec bins. Red curve is a Poisson curve with rate = median count rate of data. |
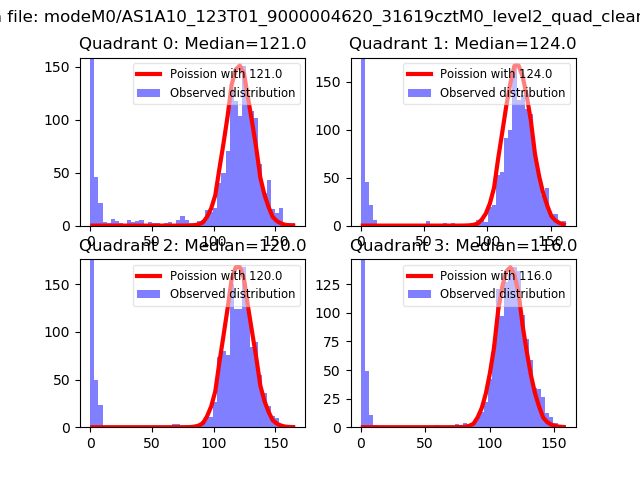 |
 |
| Quadrant-wise count rates Data is divided into 100 sec bins |
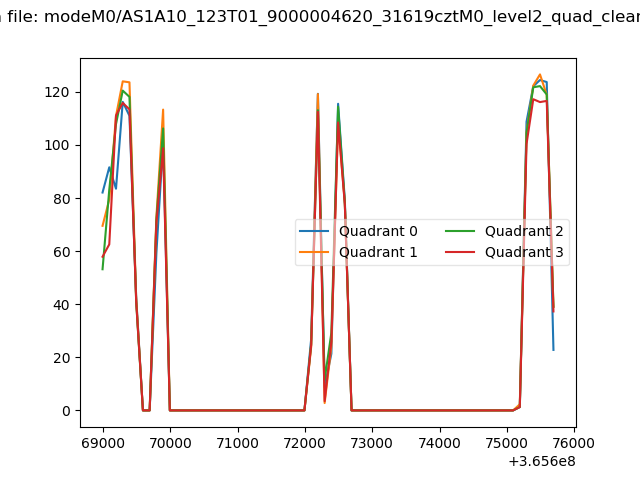 |
|
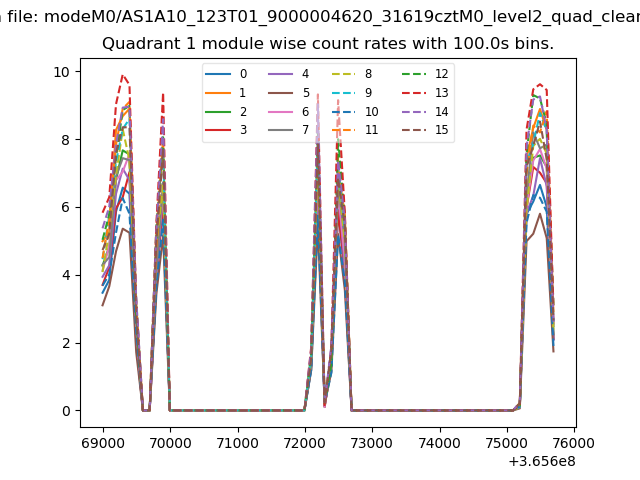
| Module-wise count rates for Quadrant A Data is divided into 100 sec bins |
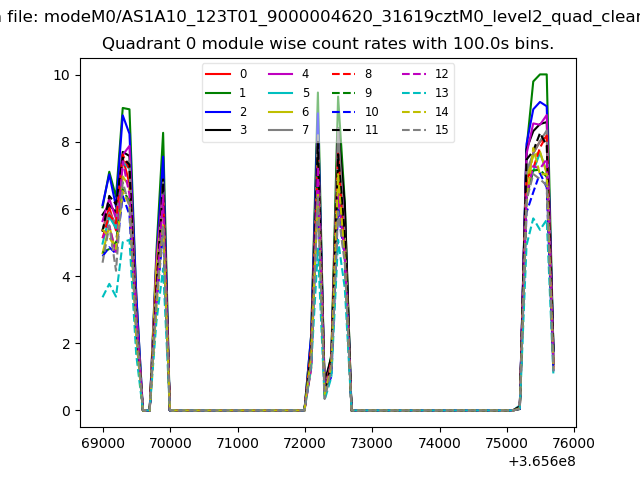 |
 |
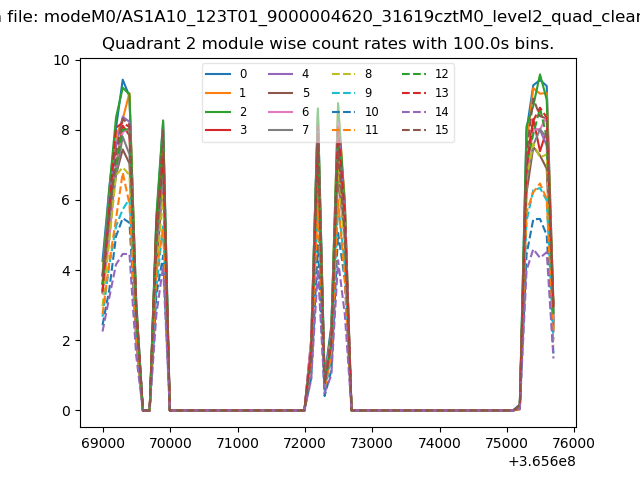
| Module-wise count rates for Quadrant B Data is divided into 100 sec bins |
 |
 |
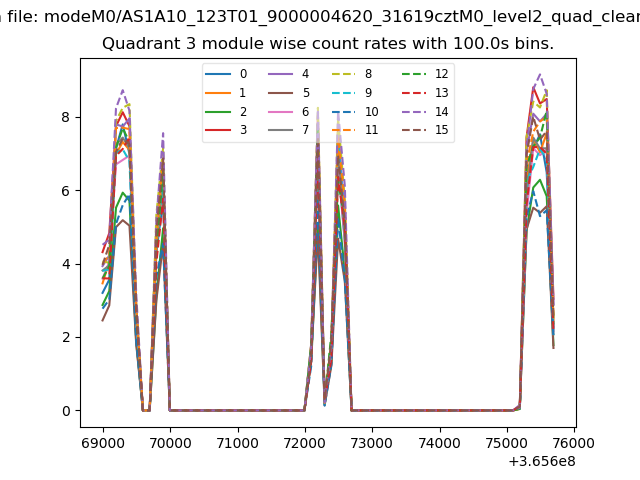
| Module-wise count rates for Quadrant C Data is divided into 100 sec bins |
 |
 |
| Module-wise count rates for Quadrant D Data is divided into 100 sec bins |
 |
 |
| Parameter | Plot |
|---|---|
| CZT HV Monitor | 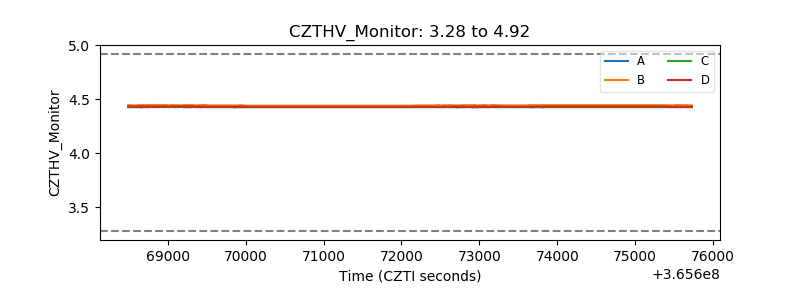 |
| D_VDD | 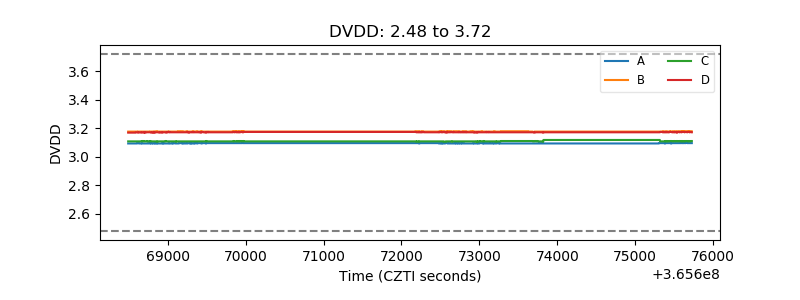 |
| Temperature 1 | 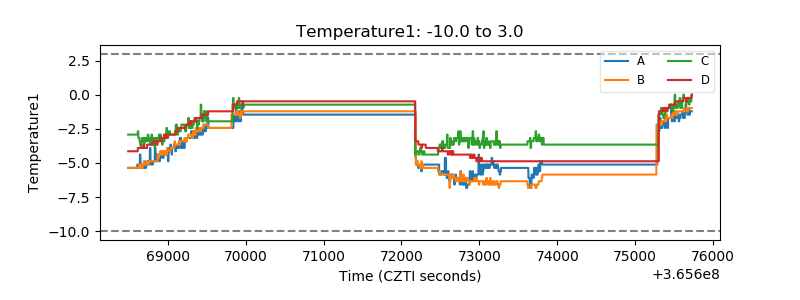 |
| Veto HV Monitor | 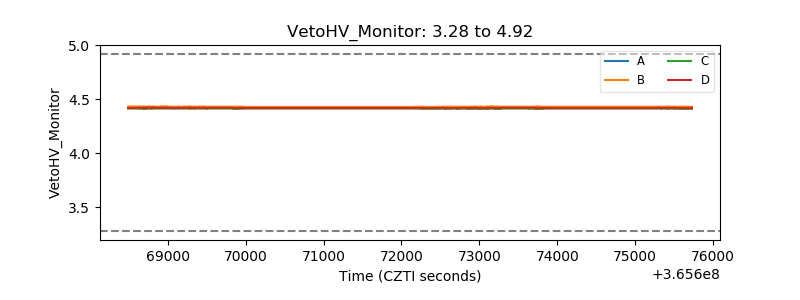 |
| Veto LLD | 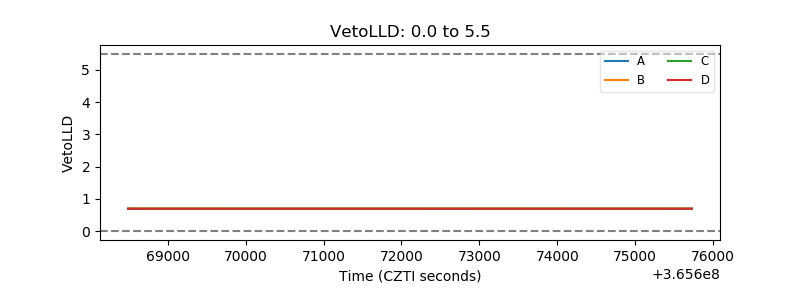 |
| Alpha Counter | 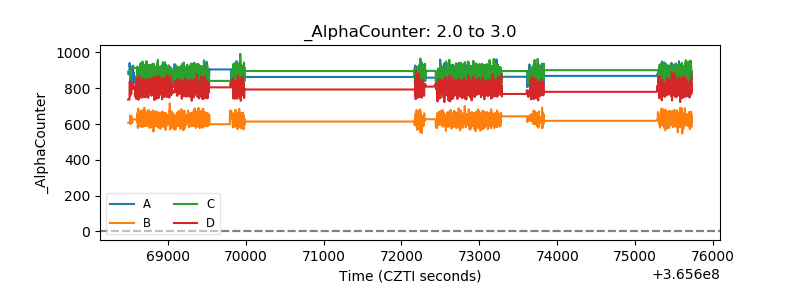 |
| _CPM_Rate | 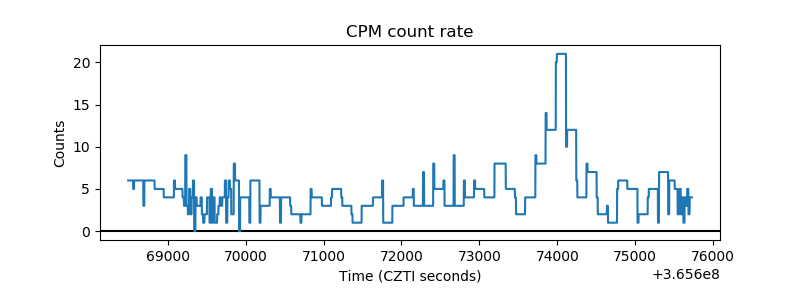 |
| CZT Counter | 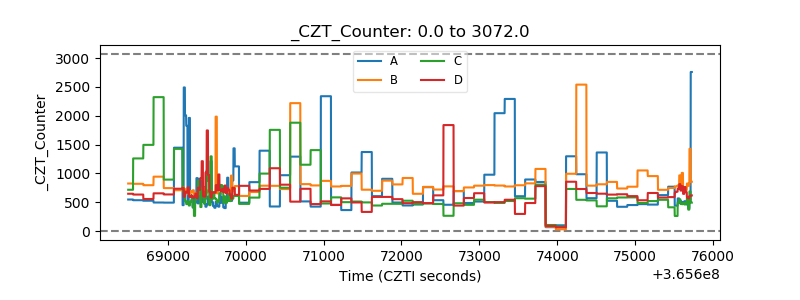 |
| +2.5 Volts monitor |  |
| +5 Volts monitor | 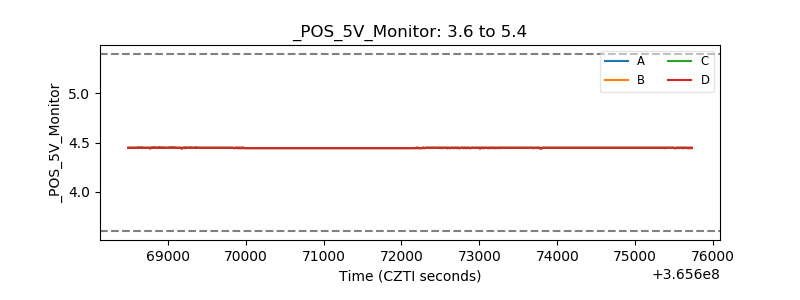 |
| _ROLL_ROT | 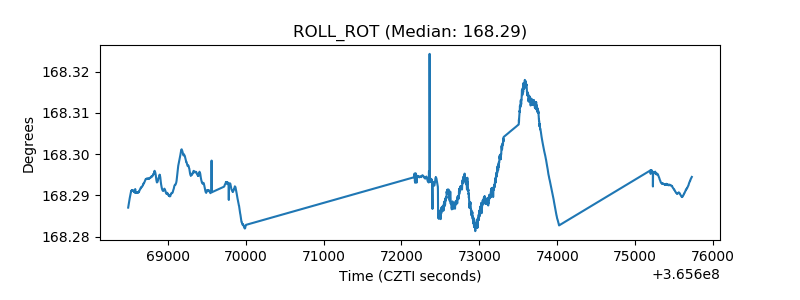 |
| _Roll_DEC | 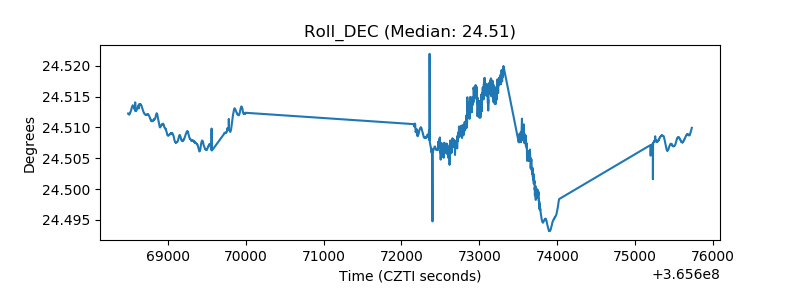 |
| _Roll_RA | 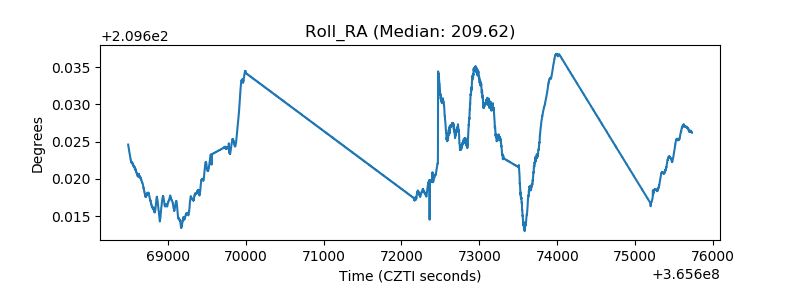 |
| Veto Counter | 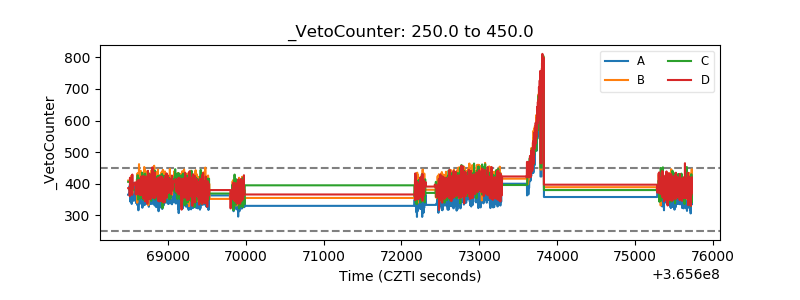 |