| Param | Original file | Final file |
|---|---|---|
| Filename | modeM0/AS1A10_123T01_9000004620_31622cztM0_level2.evt | modeM0/AS1A10_123T01_9000004620_31622cztM0_level2_quad_clean.evt |
| Size (bytes) | 2,179,224,000 | 224,861,760 |
| Size | 2.0 GB | 214.4 MB |
| Events in quadrant A | 22,758,612 | 1,165,756 |
| Events in quadrant B | 15,996,220 | 1,509,563 |
| Events in quadrant C | 11,799,155 | 1,464,155 |
| Events in quadrant D | 14,237,719 | 1,429,297 |
| Mode M0 | |||
|---|---|---|---|
| Quadrant | BADHDUFLAG | Total packets | Discarded packets |
| A | 0 | 79759 | 3 |
| B | 0 | 59928 | 3 |
| C | 0 | 46499 | 3 |
| D | 0 | 54842 | 3 |
| Mode M9 | |||
|---|---|---|---|
| Quadrant | BADHDUFLAG | Total packets | Discarded packets |
| A | 0 | 19 | 0 |
| B | 0 | 19 | 0 |
| C | 0 | 19 | 0 |
| D | 0 | 19 | 0 |
| Mode SS | |||
|---|---|---|---|
| Quadrant | BADHDUFLAG | Total packets | Discarded packets |
| A | 0 | 366 | 0 |
| B | 0 | 366 | 0 |
| C | 0 | 366 | 0 |
| D | 0 | 366 | 0 |
| Quadrant | Total seconds | Saturated seconds | Saturation percentage |
|---|---|---|---|
| A | 17974 | 7134 | 39.690664% |
| B | 17974 | 787 | 4.378547% |
| C | 17974 | 816 | 4.539891% |
| D | 17975 | 605 | 3.365786% |
Noise dominated data is calculated using 1-second bins in cleaned event files. If a bin has >2000 counts, and if more than 50% of those come from <1% of pixels, then it is considered to be noise-dominated and hence unusable.
| Quadrant | # 1 sec bins | Bins with >0 counts | Bins with >2000 counts | High rate bins dominated by noise | Noise dominated (total time) | Noise dominated (detector-on time) | Marked lightcurve |
|---|---|---|---|---|---|---|---|
| A | 19894 | 17977 | 4355 | 4355 | 21.89% | 24.23% | 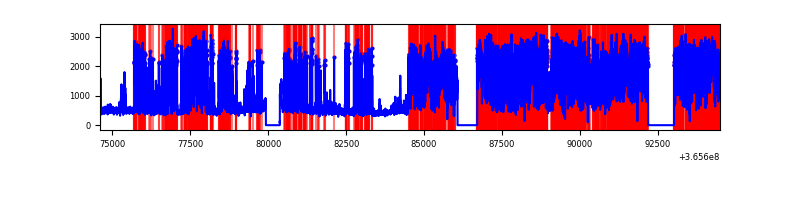 |
| B | 19894 | 17977 | 290 | 290 | 1.46% | 1.61% | 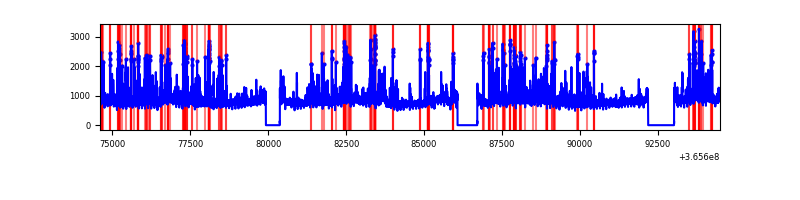 |
| C | 19894 | 17977 | 336 | 336 | 1.69% | 1.87% | 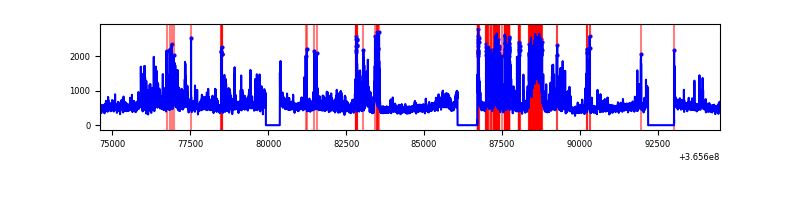 |
| D | 19895 | 17978 | 458 | 458 | 2.30% | 2.55% | 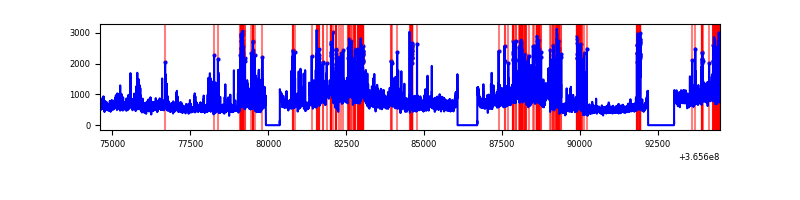 |
Top three noisy pixels from each quadrant. If the there are fewer than three noisy pixels in the level2.evt file, extra rows are filled as -1
| Pixel properties | Quadrant properties | ||||||
|---|---|---|---|---|---|---|---|
| Quadrant | DetID | PixID | Counts | Sigma | Mean | Median | Sigma |
| A | 0 | 13 | 16276910 | 48626.31 | 1669 | 1632 | 334.7 |
| A | 15 | 174 | 33534 | 95.31 | 1669 | 1632 | 334.7 |
| A | 13 | 254 | 28113 | 79.12 | 1669 | 1632 | 334.7 |
| B | 6 | 159 | 5154234 | 12790.47 | 2123 | 2070 | 402.8 |
| B | 10 | 245 | 879584 | 2178.47 | 2123 | 2070 | 402.8 |
| B | 5 | 172 | 376123 | 928.6 | 2123 | 2070 | 402.8 |
| C | 3 | 233 | 3055915 | 6287.4 | 2062 | 2078 | 485.7 |
| C | 14 | 238 | 338262 | 692.15 | 2062 | 2078 | 485.7 |
| C | 10 | 22 | 215335 | 439.06 | 2062 | 2078 | 485.7 |
| D | 8 | 195 | 4216344 | 8423.62 | 2087 | 2030 | 500.3 |
| D | 13 | 249 | 828969 | 1652.89 | 2087 | 2030 | 500.3 |
| D | 2 | 250 | 540092 | 1075.48 | 2087 | 2030 | 500.3 |
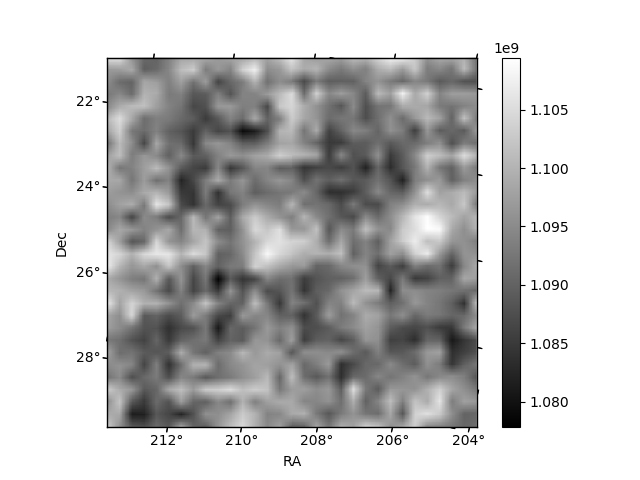
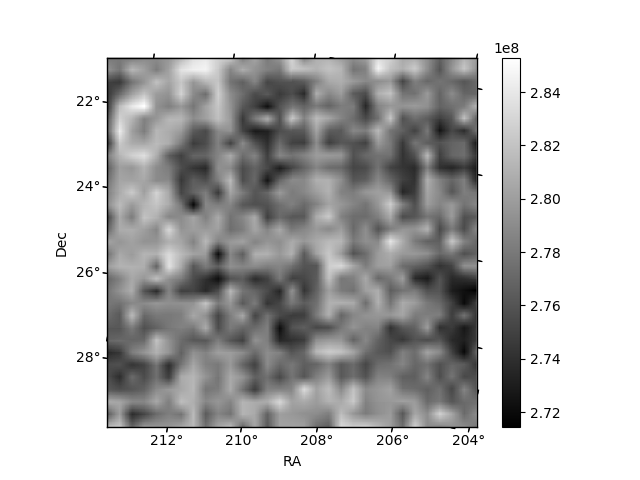
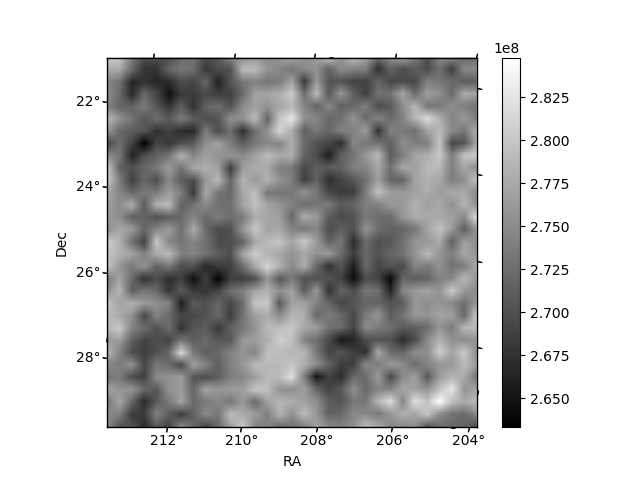
Histogram calculated using DETX and DETY for each event in the final _common_clean file
| Quadrant A | 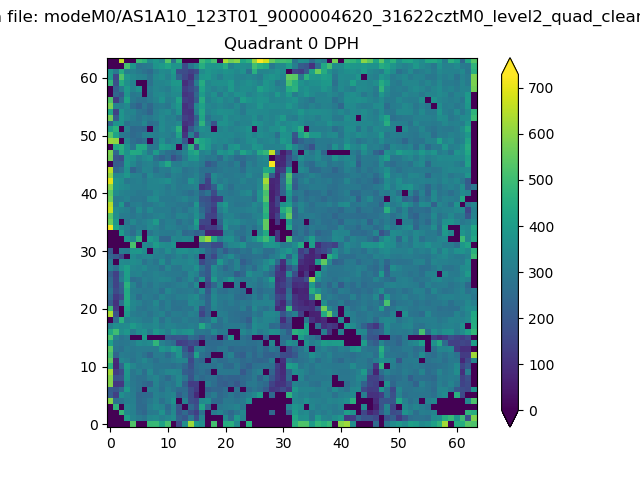 |
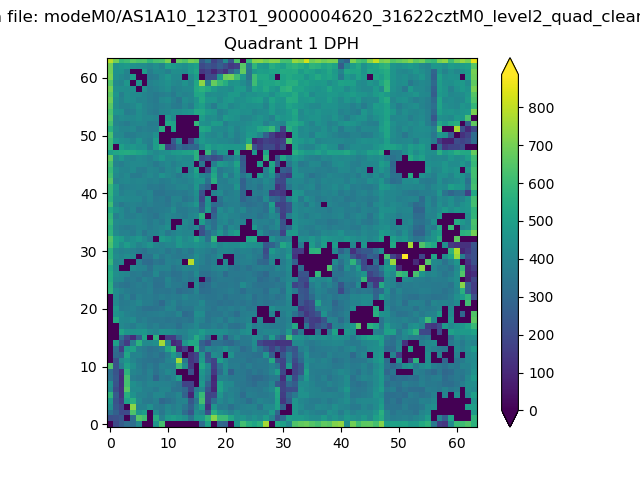 |
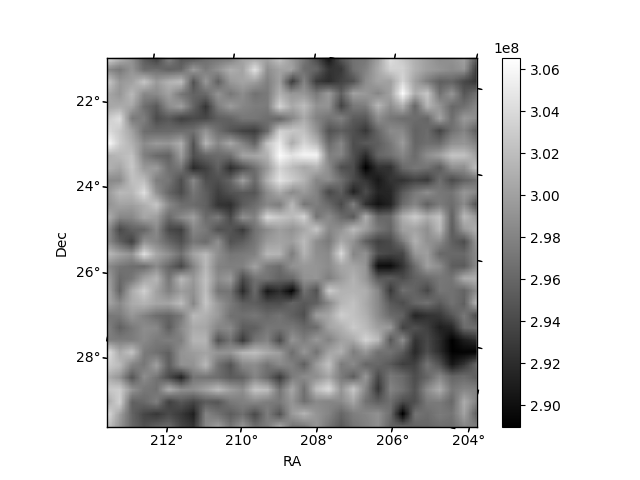
Quadrant B |
|---|---|---|---|
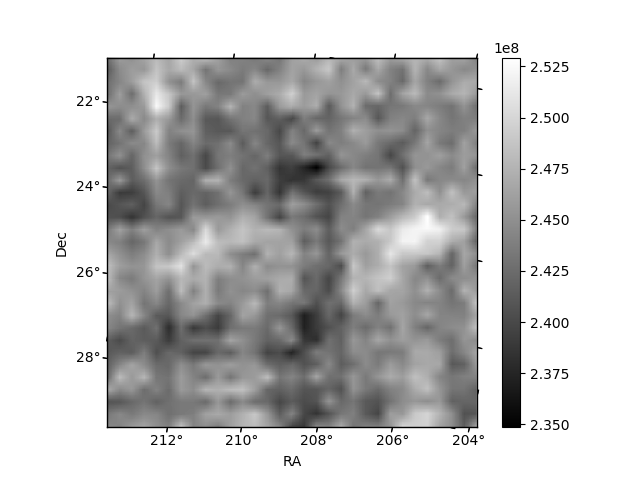
| Quadrant D | 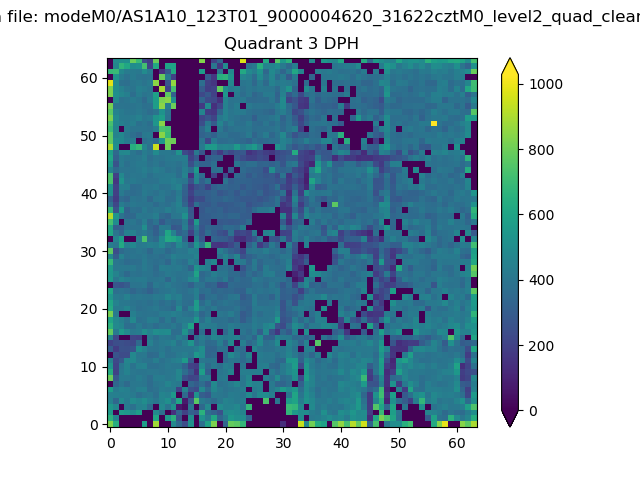 |
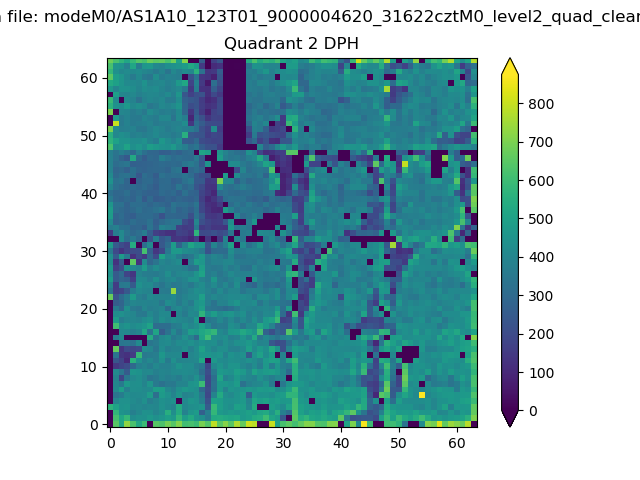 |
Quadrant C |
| Plot type | Count rate plots | Images |
|---|---|---|
| Comparison with Poisson distribution Blue bars denote a histogram of data divided into 1 sec bins. Red curve is a Poisson curve with rate = median count rate of data. |
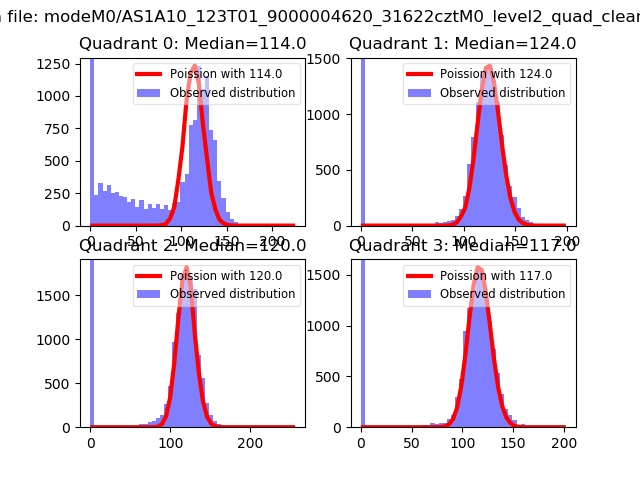 |
 |
| Quadrant-wise count rates Data is divided into 100 sec bins |
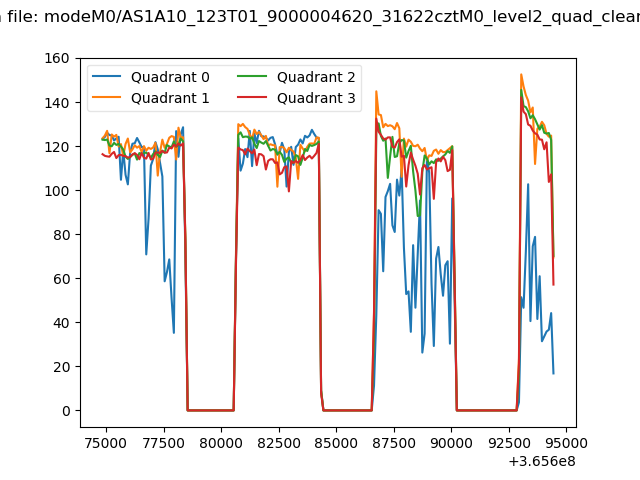 |
|
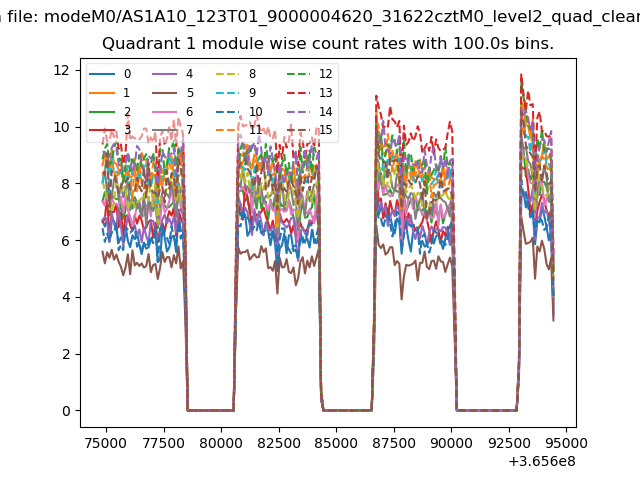
| Module-wise count rates for Quadrant A Data is divided into 100 sec bins |
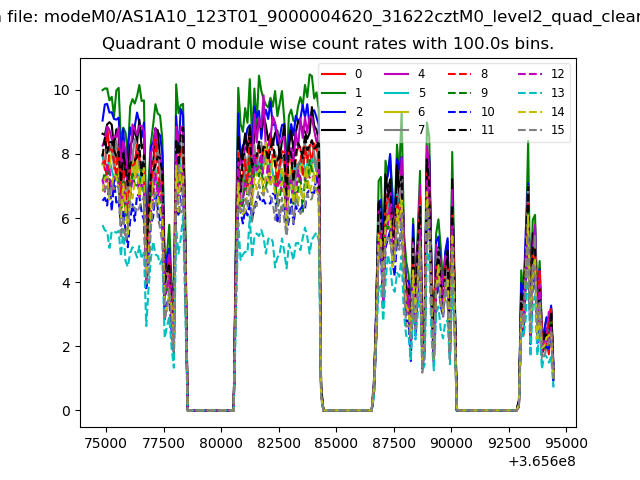 |
 |
| Module-wise count rates for Quadrant B Data is divided into 100 sec bins |
 |
 |
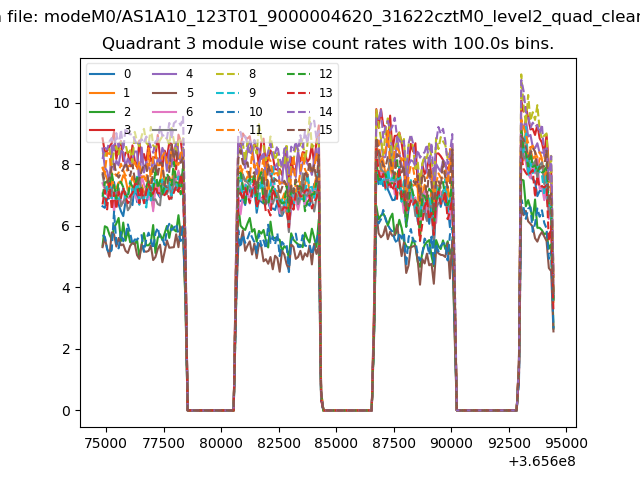
| Module-wise count rates for Quadrant C Data is divided into 100 sec bins |
 |
 |
| Module-wise count rates for Quadrant D Data is divided into 100 sec bins |
 |
 |
| Parameter | Plot |
|---|---|
| CZT HV Monitor |  |
| D_VDD | 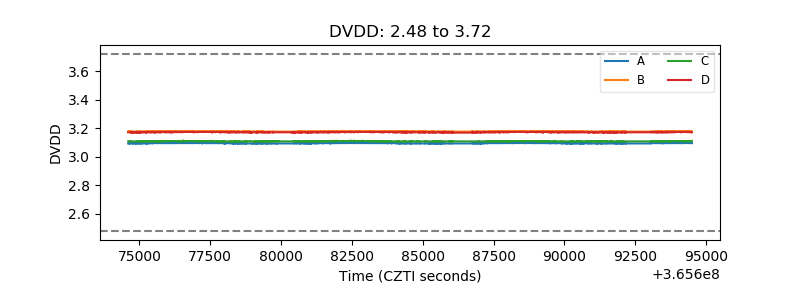 |
| Temperature 1 | 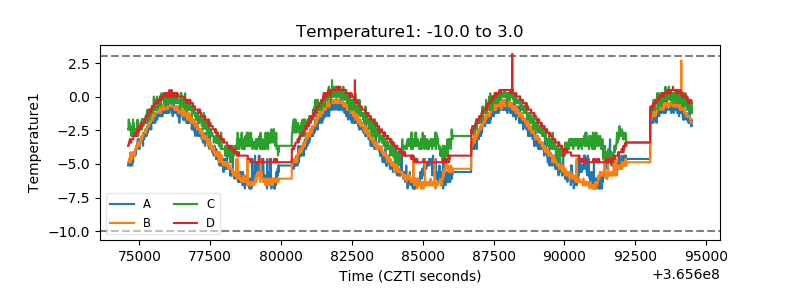 |
| Veto HV Monitor | 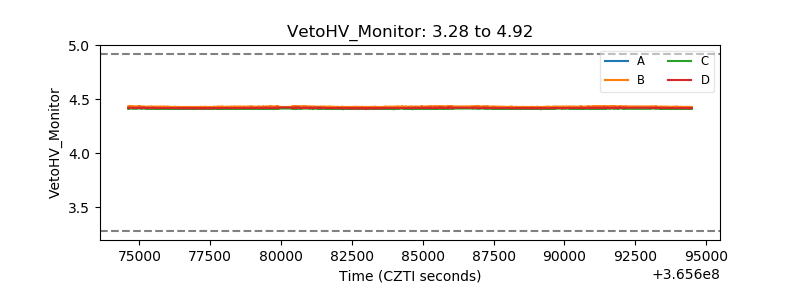 |
| Veto LLD | 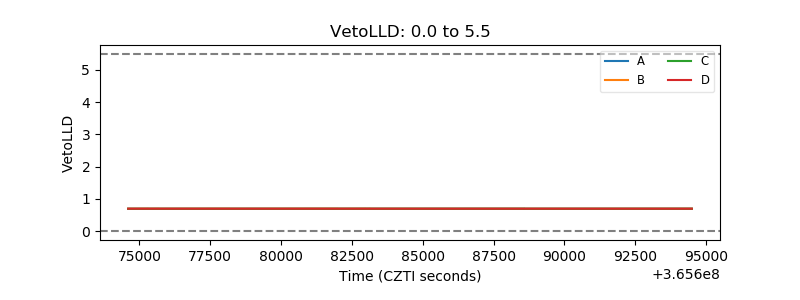 |
| Alpha Counter | 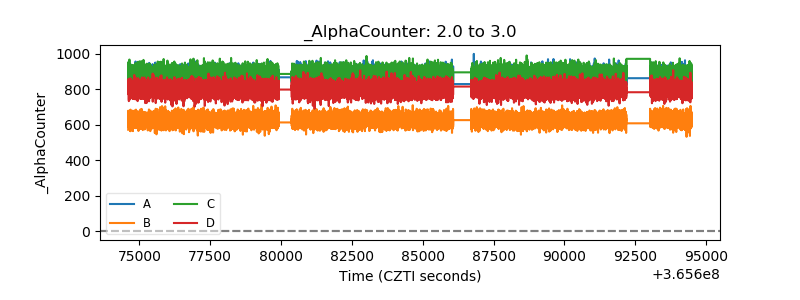 |
| _CPM_Rate | 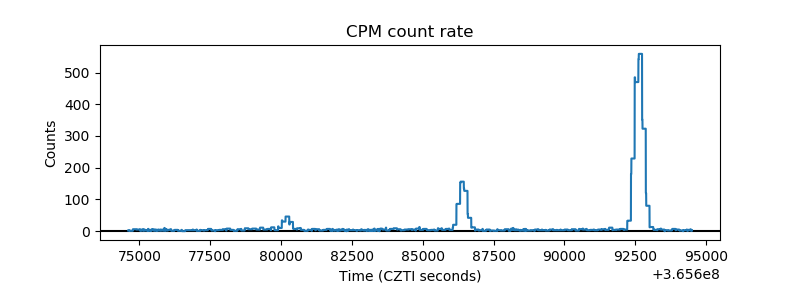 |
| CZT Counter | 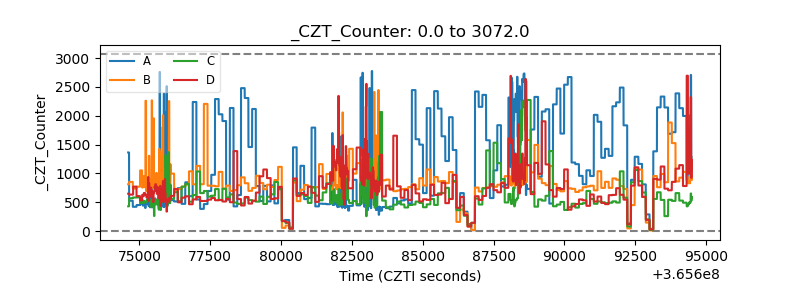 |
| +2.5 Volts monitor |  |
| +5 Volts monitor |  |
| _ROLL_ROT | 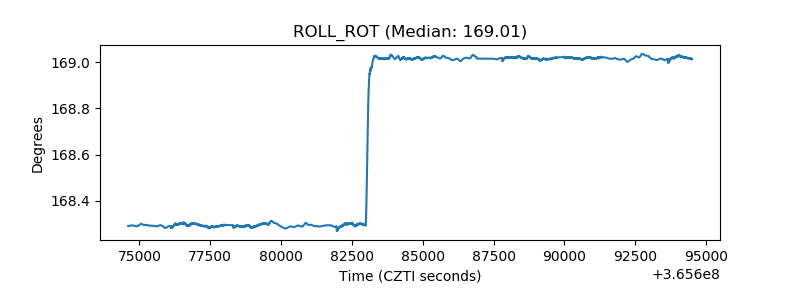 |
| _Roll_DEC | 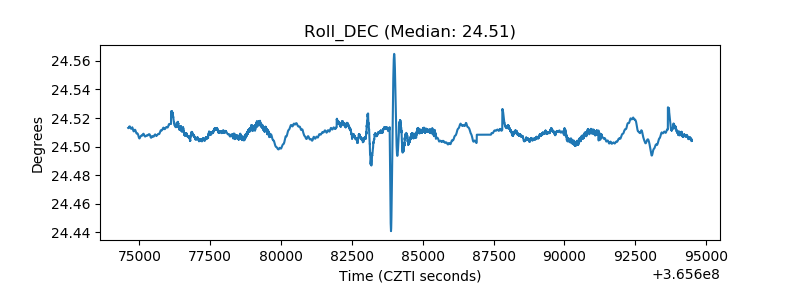 |
| _Roll_RA | 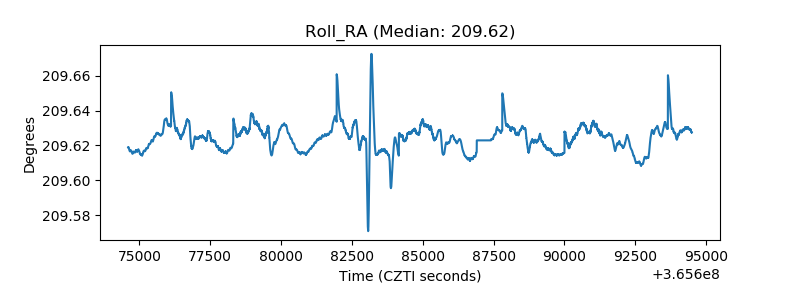 |
| Veto Counter | 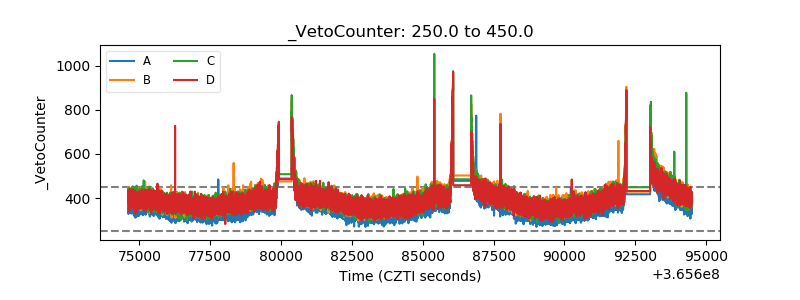 |