| Param | Original file | Final file |
|---|---|---|
| Filename | modeM0/AS1A10_123T01_9000004620_31623cztM0_level2.evt | modeM0/AS1A10_123T01_9000004620_31623cztM0_level2_quad_clean.evt |
| Size (bytes) | 827,038,080 | 74,661,120 |
| Size | 788.7 MB | 71.2 MB |
| Events in quadrant A | 8,246,165 | 357,295 |
| Events in quadrant B | 6,287,149 | 510,135 |
| Events in quadrant C | 3,640,413 | 512,385 |
| Events in quadrant D | 6,455,867 | 446,948 |
| Mode M0 | |||
|---|---|---|---|
| Quadrant | BADHDUFLAG | Total packets | Discarded packets |
| A | 0 | 28660 | 4 |
| B | 0 | 22905 | 1 |
| C | 0 | 14767 | 1 |
| D | 0 | 23300 | 7 |
| Mode M9 | |||
|---|---|---|---|
| Quadrant | BADHDUFLAG | Total packets | Discarded packets |
| A | 0 | 10 | 0 |
| B | 0 | 10 | 0 |
| C | 0 | 10 | 0 |
| D | 0 | 10 | 0 |
| Mode SS | |||
|---|---|---|---|
| Quadrant | BADHDUFLAG | Total packets | Discarded packets |
| A | 0 | 126 | 0 |
| B | 0 | 126 | 0 |
| C | 0 | 126 | 0 |
| D | 0 | 126 | 0 |
| Quadrant | Total seconds | Saturated seconds | Saturation percentage |
|---|---|---|---|
| A | 6191 | 2531 | 40.881925% |
| B | 6193 | 495 | 7.992895% |
| C | 6193 | 196 | 3.164864% |
| D | 6192 | 828 | 13.372093% |
Noise dominated data is calculated using 1-second bins in cleaned event files. If a bin has >2000 counts, and if more than 50% of those come from <1% of pixels, then it is considered to be noise-dominated and hence unusable.
| Quadrant | # 1 sec bins | Bins with >0 counts | Bins with >2000 counts | High rate bins dominated by noise | Noise dominated (total time) | Noise dominated (detector-on time) | Marked lightcurve |
|---|---|---|---|---|---|---|---|
| A | 7172 | 6193 | 1674 | 1674 | 23.34% | 27.03% | 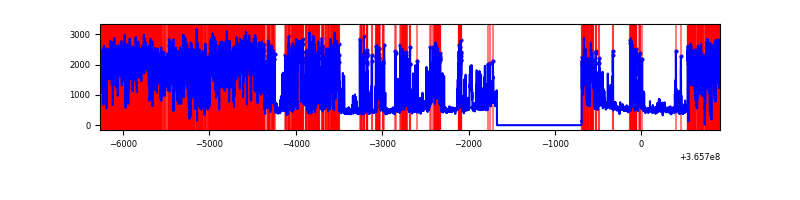 |
| B | 7173 | 6194 | 235 | 235 | 3.28% | 3.79% | 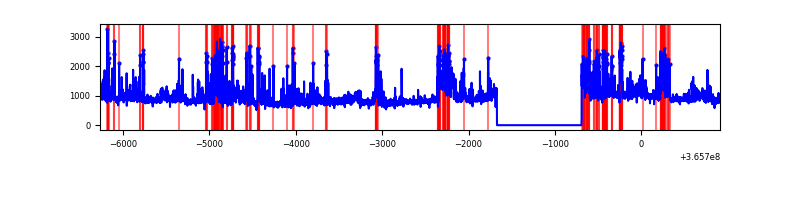 |
| C | 7173 | 6194 | 85 | 85 | 1.18% | 1.37% | 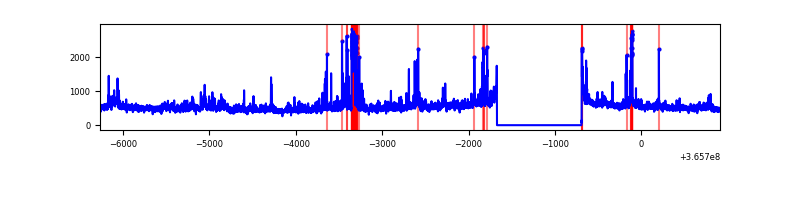 |
| D | 7172 | 6193 | 815 | 815 | 11.36% | 13.16% | 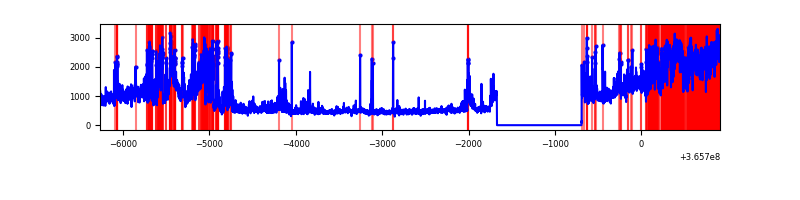 |
Top three noisy pixels from each quadrant. If the there are fewer than three noisy pixels in the level2.evt file, extra rows are filled as -1
| Pixel properties | Quadrant properties | ||||||
|---|---|---|---|---|---|---|---|
| Quadrant | DetID | PixID | Counts | Sigma | Mean | Median | Sigma |
| A | 0 | 13 | 5972769 | 50342.07 | 587 | 575 | 118.6 |
| A | 13 | 254 | 10135 | 80.59 | 587 | 575 | 118.6 |
| A | 3 | 137 | 5591 | 42.28 | 587 | 575 | 118.6 |
| B | 6 | 159 | 1953658 | 14175.2 | 721 | 702 | 137.8 |
| B | 10 | 245 | 498094 | 3610.24 | 721 | 702 | 137.8 |
| B | 5 | 172 | 440023 | 3188.74 | 721 | 702 | 137.8 |
| C | 3 | 233 | 607420 | 3613.15 | 712 | 717 | 167.9 |
| C | 14 | 238 | 113016 | 668.78 | 712 | 717 | 167.9 |
| C | 0 | 207 | 51020 | 299.57 | 712 | 717 | 167.9 |
| D | 8 | 195 | 1728468 | 10387.66 | 688 | 668 | 166.3 |
| D | 13 | 249 | 1487747 | 8940.43 | 688 | 668 | 166.3 |
| D | 11 | 176 | 168165 | 1007.0 | 688 | 668 | 166.3 |
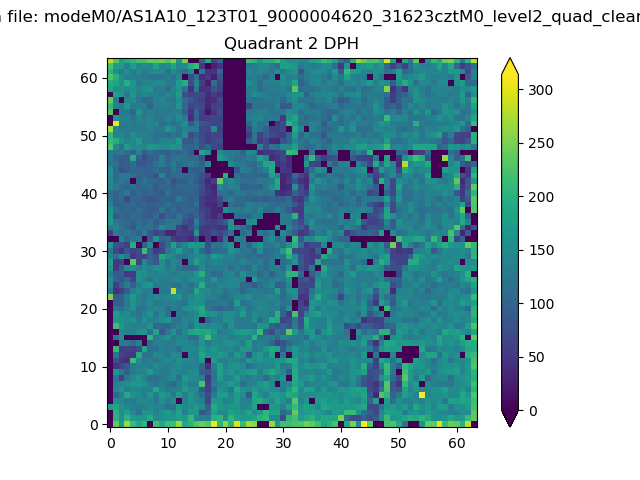
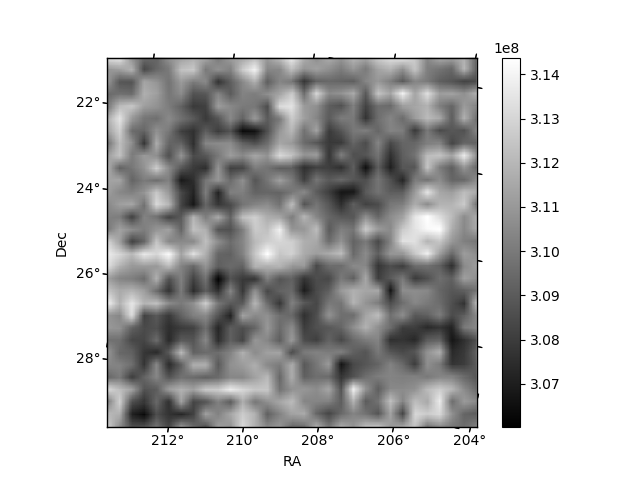
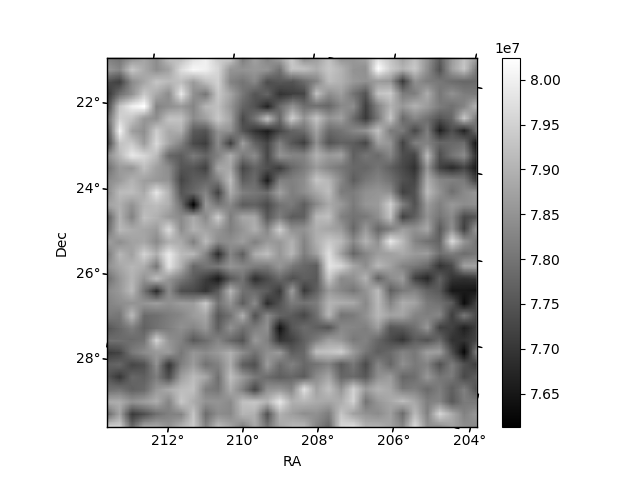
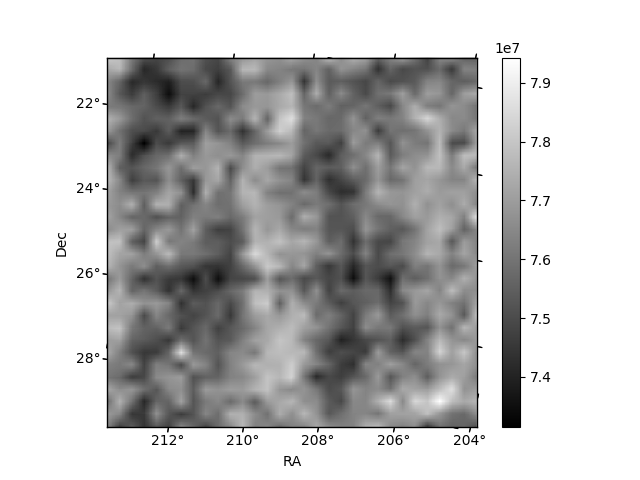
Histogram calculated using DETX and DETY for each event in the final _common_clean file
| Quadrant A | 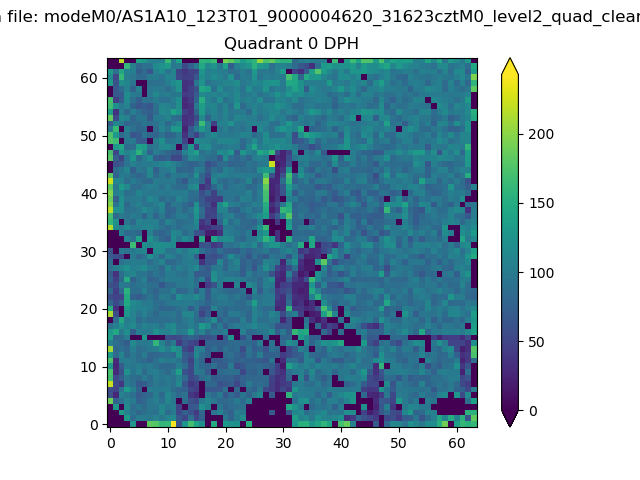 |
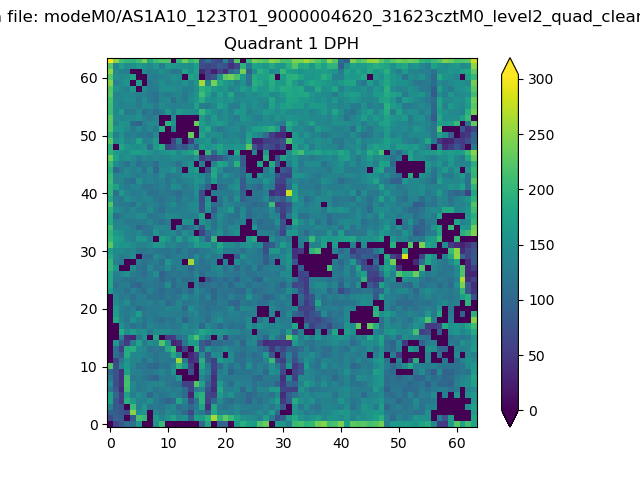 |
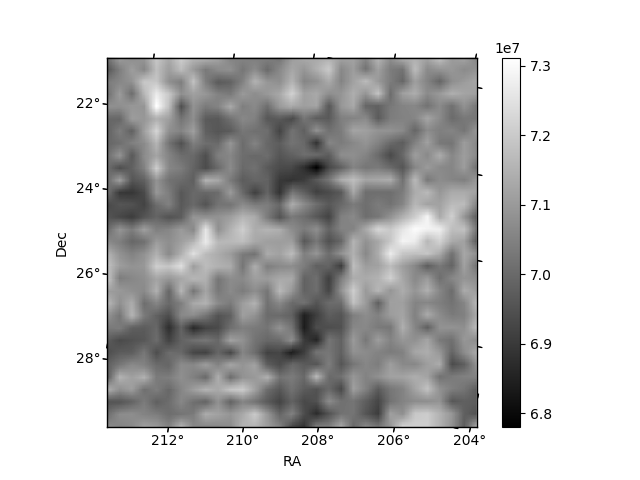
Quadrant B |
|---|---|---|---|
| Quadrant D | 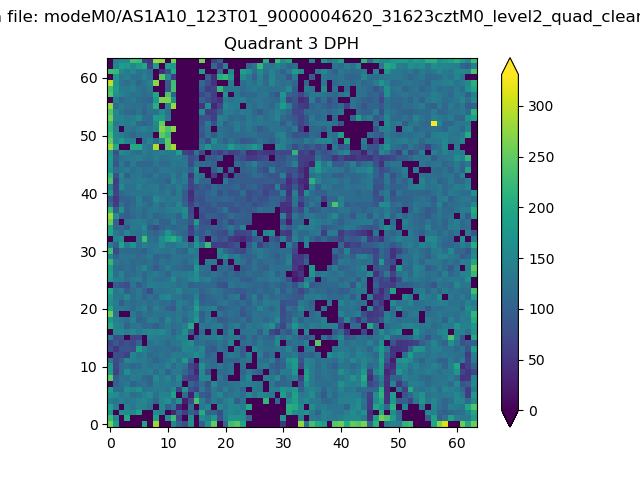 |
 |
Quadrant C |
| Plot type | Count rate plots | Images |
|---|---|---|
| Comparison with Poisson distribution Blue bars denote a histogram of data divided into 1 sec bins. Red curve is a Poisson curve with rate = median count rate of data. |
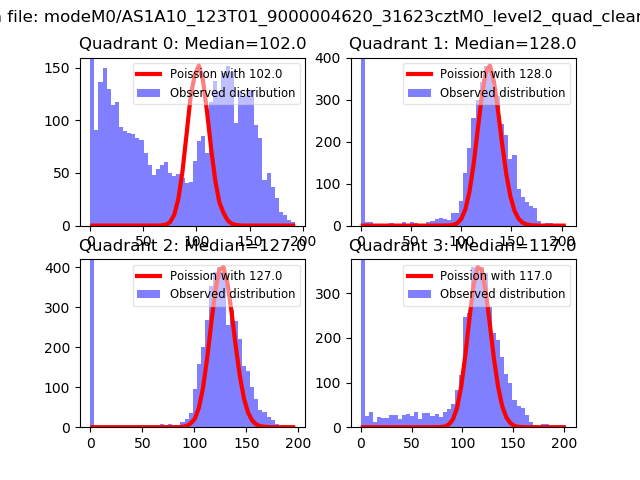 |
 |
| Quadrant-wise count rates Data is divided into 100 sec bins |
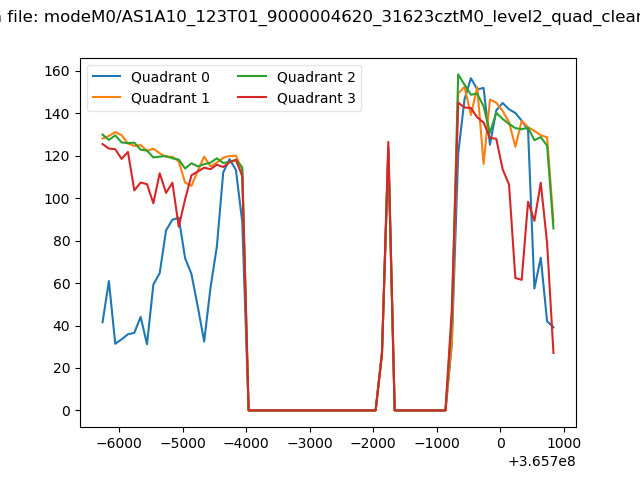 |
|
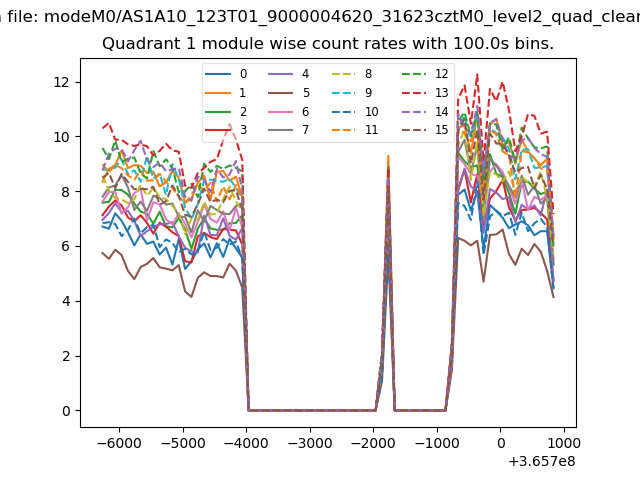
| Module-wise count rates for Quadrant A Data is divided into 100 sec bins |
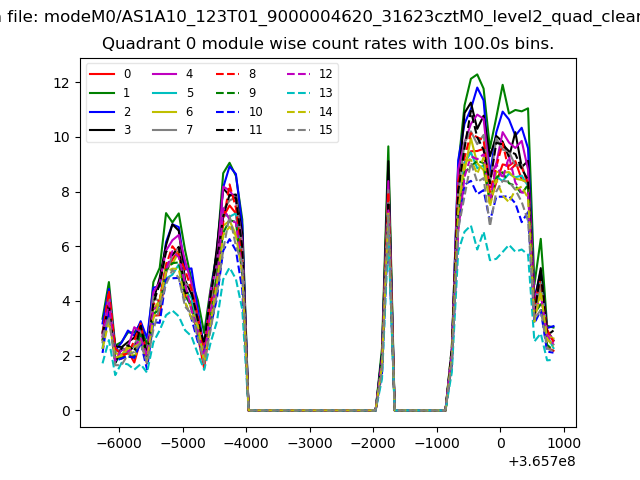 |
 |
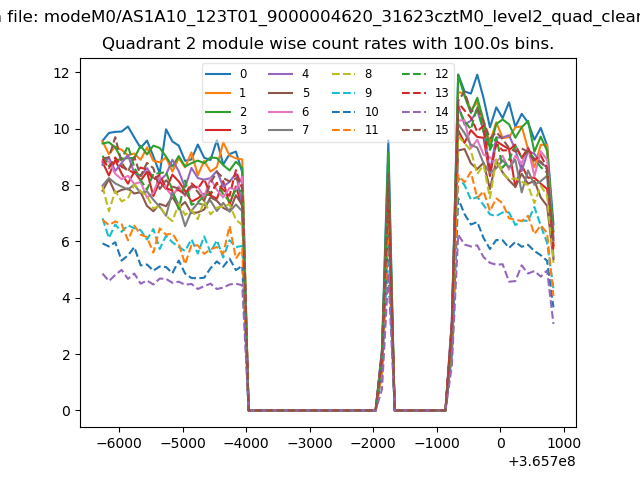
| Module-wise count rates for Quadrant B Data is divided into 100 sec bins |
 |
 |
| Module-wise count rates for Quadrant C Data is divided into 100 sec bins |
 |
 |
| Module-wise count rates for Quadrant D Data is divided into 100 sec bins |
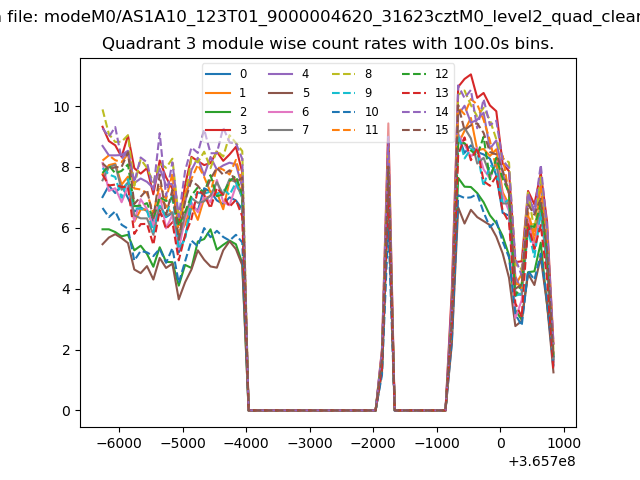 |
 |
| Parameter | Plot |
|---|---|
| CZT HV Monitor | 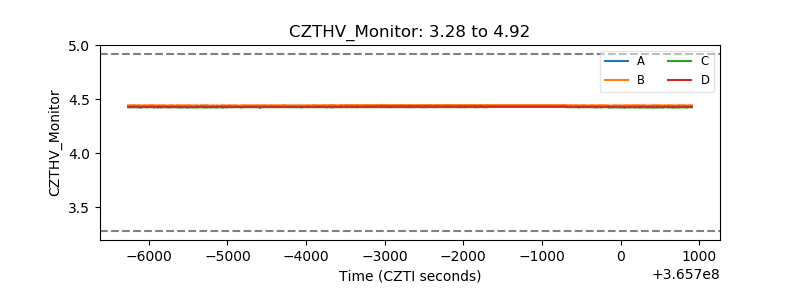 |
| D_VDD |  |
| Temperature 1 | 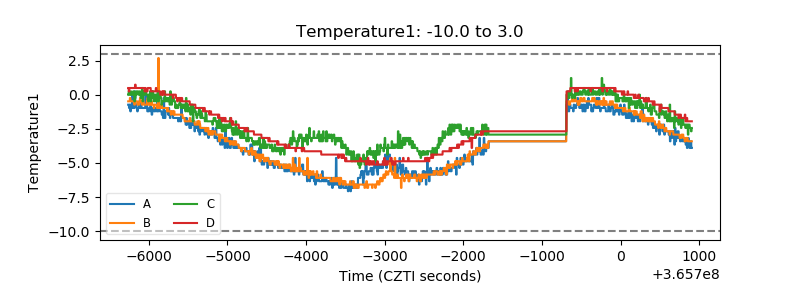 |
| Veto HV Monitor | 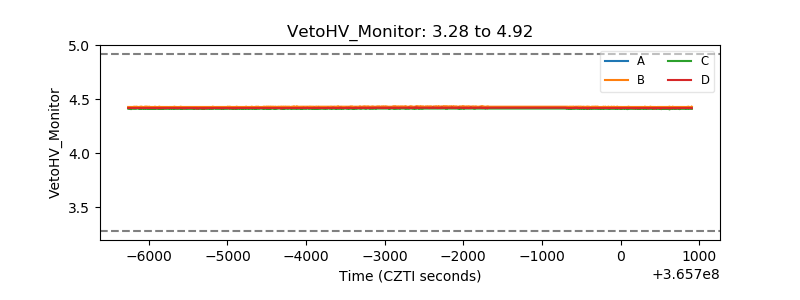 |
| Veto LLD | 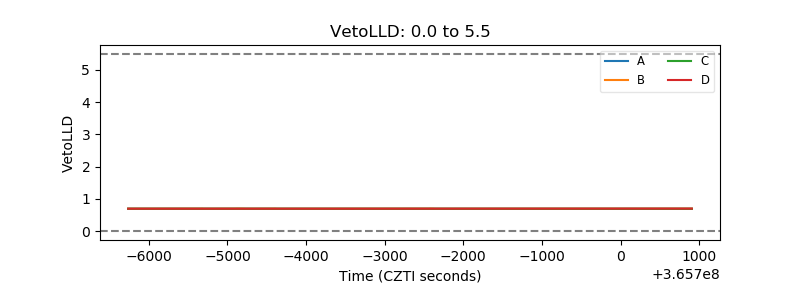 |
| Alpha Counter | 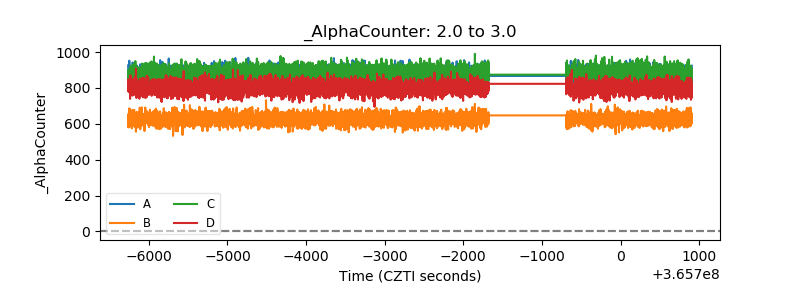 |
| _CPM_Rate | 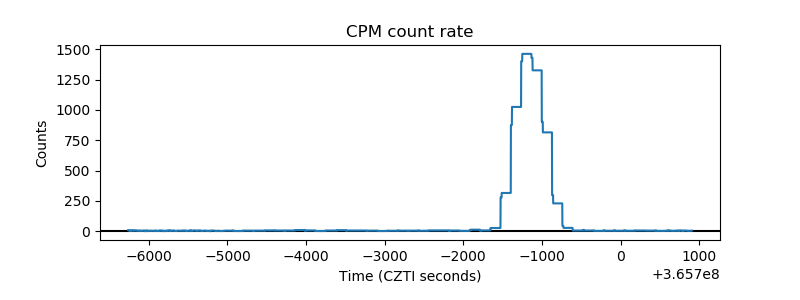 |
| CZT Counter | 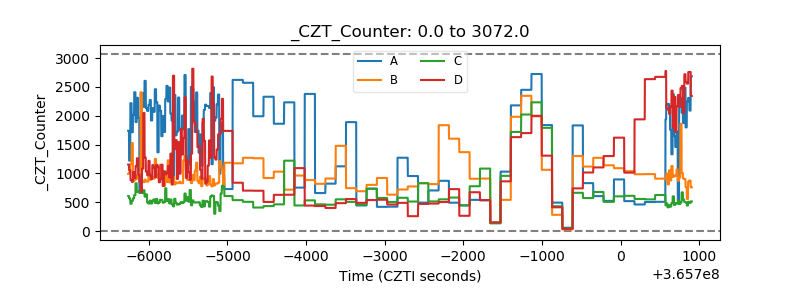 |
| +2.5 Volts monitor |  |
| +5 Volts monitor |  |
| _ROLL_ROT | 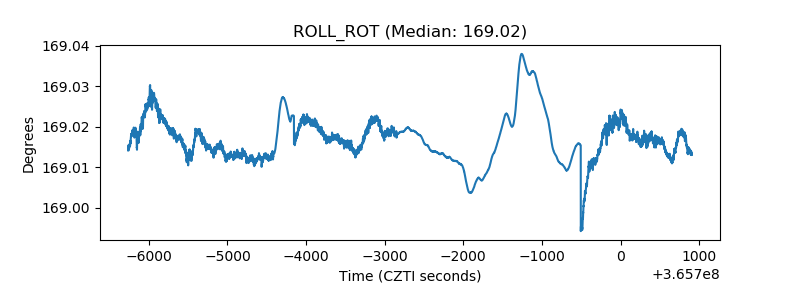 |
| _Roll_DEC | 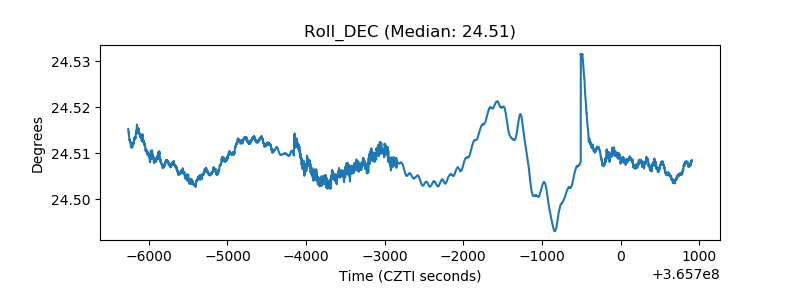 |
| _Roll_RA | 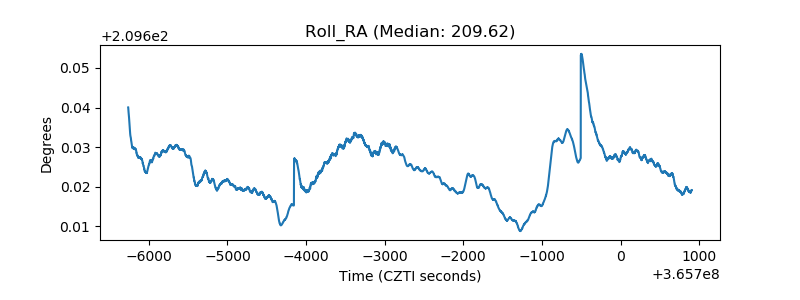 |
| Veto Counter | 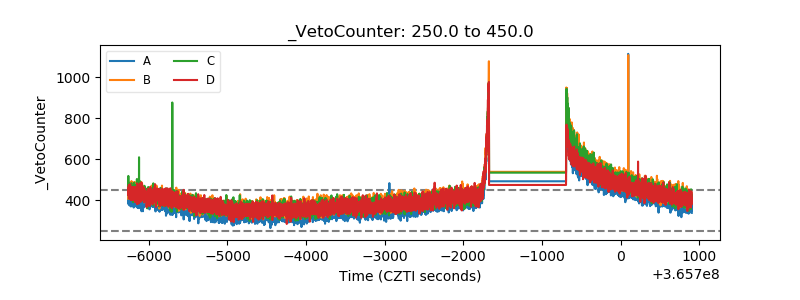 |