| Param | Original file | Final file |
|---|---|---|
| Filename | modeM0/AS1A10_123T01_9000004620_31625cztM0_level2.evt | modeM0/AS1A10_123T01_9000004620_31625cztM0_level2_quad_clean.evt |
| Size (bytes) | 2,597,077,440 | 294,984,000 |
| Size | 2.4 GB | 281.3 MB |
| Events in quadrant A | 21,451,966 | 1,787,264 |
| Events in quadrant B | 21,288,528 | 1,889,072 |
| Events in quadrant C | 14,861,155 | 1,880,423 |
| Events in quadrant D | 19,480,207 | 1,764,461 |
| Mode M0 | |||
|---|---|---|---|
| Quadrant | BADHDUFLAG | Total packets | Discarded packets |
| A | 0 | 79130 | 4 |
| B | 0 | 79724 | 4 |
| C | 0 | 58928 | 8 |
| D | 0 | 74221 | 6 |
| Mode M9 | |||
|---|---|---|---|
| Quadrant | BADHDUFLAG | Total packets | Discarded packets |
| A | 0 | 25 | 0 |
| B | 0 | 25 | 0 |
| C | 0 | 25 | 0 |
| D | 0 | 25 | 0 |
| Mode SS | |||
|---|---|---|---|
| Quadrant | BADHDUFLAG | Total packets | Discarded packets |
| A | 0 | 478 | 0 |
| B | 0 | 478 | 0 |
| C | 0 | 478 | 0 |
| D | 0 | 478 | 0 |
| Quadrant | Total seconds | Saturated seconds | Saturation percentage |
|---|---|---|---|
| A | 23417 | 4419 | 18.870906% |
| B | 23416 | 1619 | 6.914076% |
| C | 23415 | 958 | 4.091394% |
| D | 23417 | 1395 | 5.957211% |
Noise dominated data is calculated using 1-second bins in cleaned event files. If a bin has >2000 counts, and if more than 50% of those come from <1% of pixels, then it is considered to be noise-dominated and hence unusable.
| Quadrant | # 1 sec bins | Bins with >0 counts | Bins with >2000 counts | High rate bins dominated by noise | Noise dominated (total time) | Noise dominated (detector-on time) | Marked lightcurve |
|---|---|---|---|---|---|---|---|
| A | 38534 | 23424 | 2817 | 2817 | 7.31% | 12.03% |  |
| B | 38534 | 23423 | 759 | 759 | 1.97% | 3.24% | 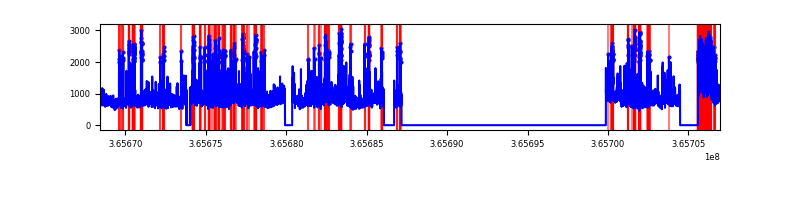 |
| C | 38534 | 23422 | 234 | 234 | 0.61% | 1.00% | 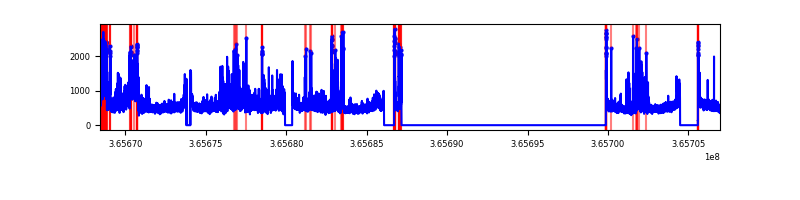 |
| D | 38534 | 23424 | 1142 | 1142 | 2.96% | 4.88% | 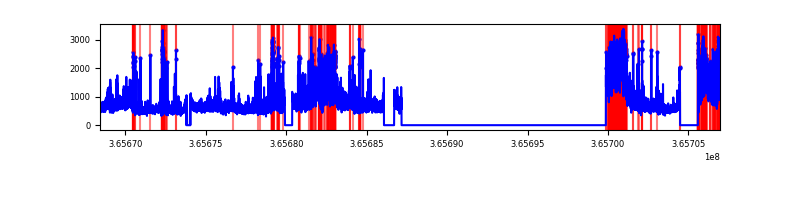 |
Top three noisy pixels from each quadrant. If the there are fewer than three noisy pixels in the level2.evt file, extra rows are filled as -1
| Pixel properties | Quadrant properties | ||||||
|---|---|---|---|---|---|---|---|
| Quadrant | DetID | PixID | Counts | Sigma | Mean | Median | Sigma |
| A | 0 | 13 | 11397535 | 21980.9 | 2591 | 2535 | 518.4 |
| A | 13 | 254 | 43155 | 78.36 | 2591 | 2535 | 518.4 |
| A | 15 | 174 | 41620 | 75.39 | 2591 | 2535 | 518.4 |
| B | 6 | 159 | 6716643 | 12799.11 | 2756 | 2684 | 524.6 |
| B | 5 | 172 | 1336773 | 2543.23 | 2756 | 2684 | 524.6 |
| B | 10 | 245 | 1143896 | 2175.54 | 2756 | 2684 | 524.6 |
| C | 3 | 233 | 3480052 | 5448.8 | 2713 | 2729 | 638.2 |
| C | 14 | 238 | 448097 | 697.87 | 2713 | 2729 | 638.2 |
| C | 10 | 22 | 89145 | 135.41 | 2713 | 2729 | 638.2 |
| D | 8 | 195 | 5664912 | 8698.95 | 2705 | 2631 | 650.9 |
| D | 13 | 249 | 1758971 | 2698.26 | 2705 | 2631 | 650.9 |
| D | 2 | 250 | 537484 | 821.69 | 2705 | 2631 | 650.9 |
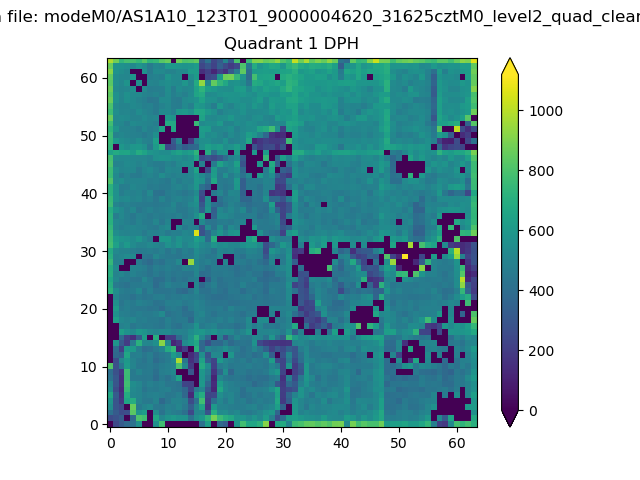
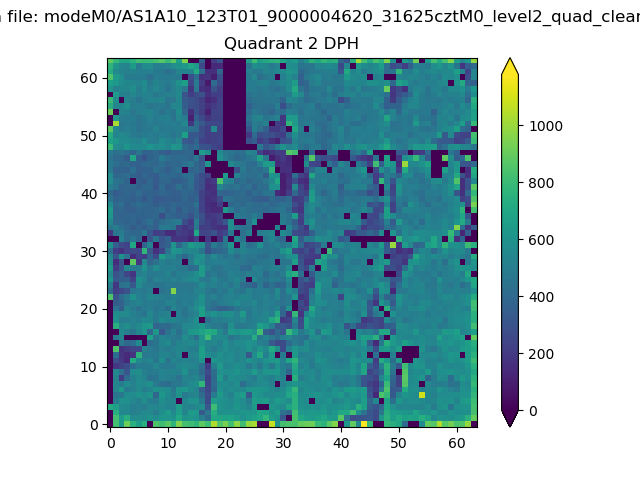
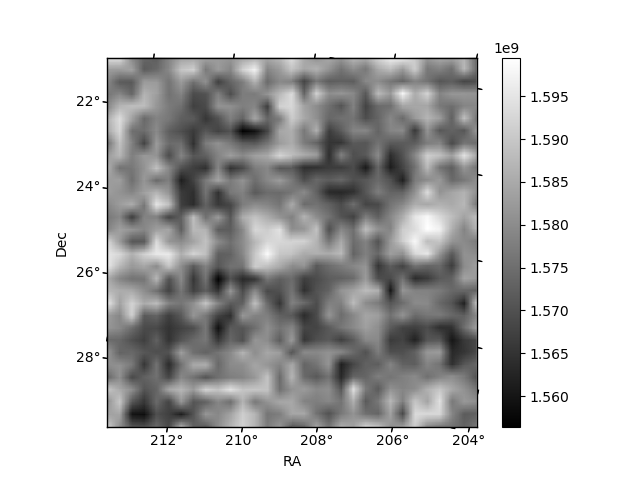
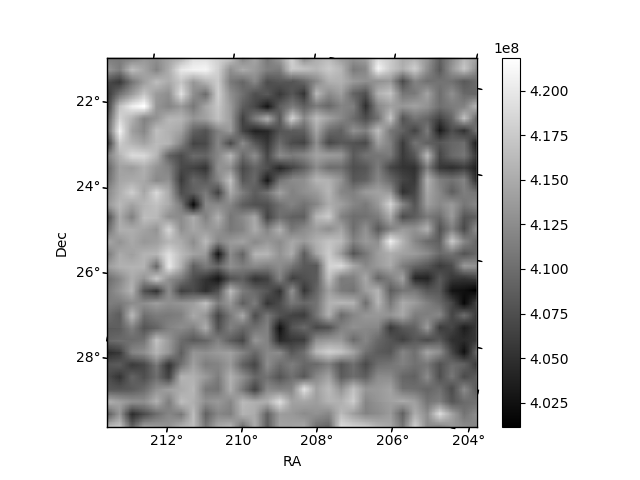
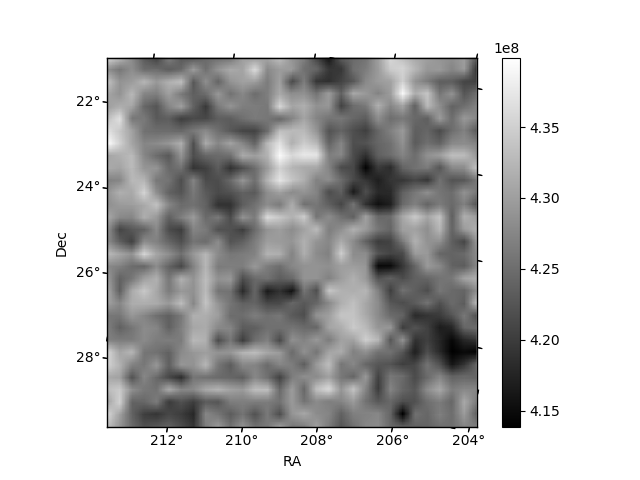
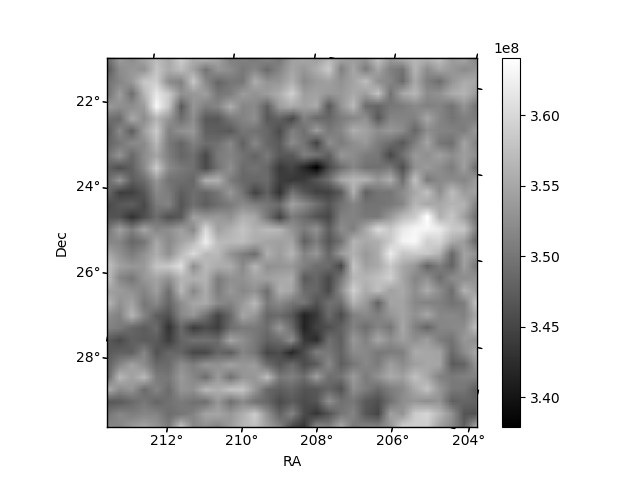
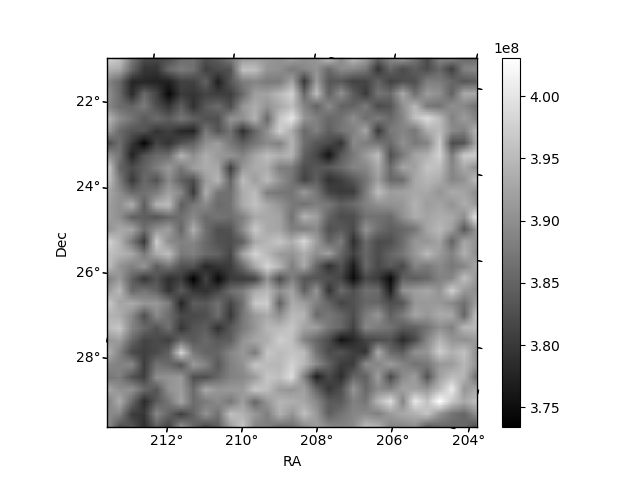
Histogram calculated using DETX and DETY for each event in the final _common_clean file
| Quadrant A | 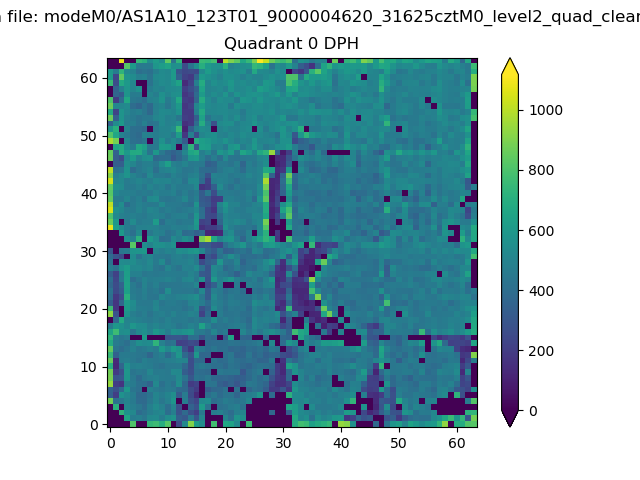 |
 |
Quadrant B |
|---|---|---|---|
| Quadrant D | 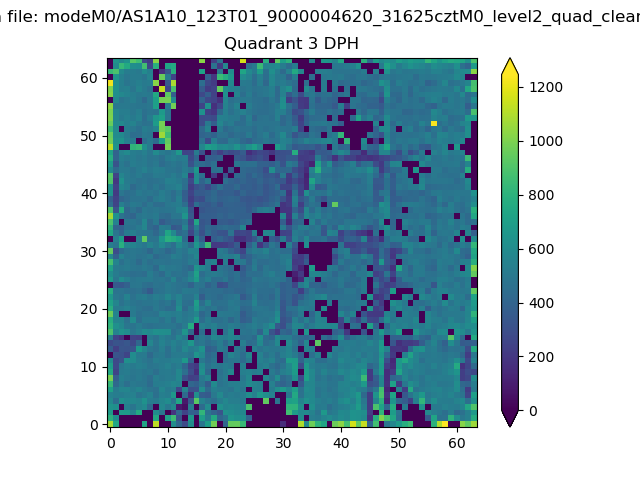 |
 |
Quadrant C |
| Plot type | Count rate plots | Images |
|---|---|---|
| Comparison with Poisson distribution Blue bars denote a histogram of data divided into 1 sec bins. Red curve is a Poisson curve with rate = median count rate of data. |
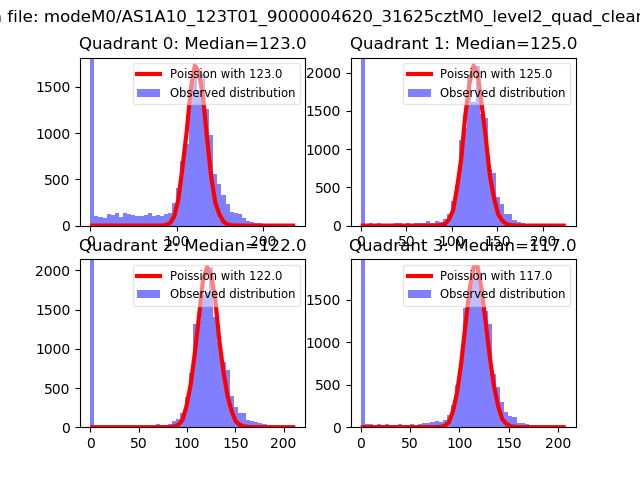 |
 |
| Quadrant-wise count rates Data is divided into 100 sec bins |
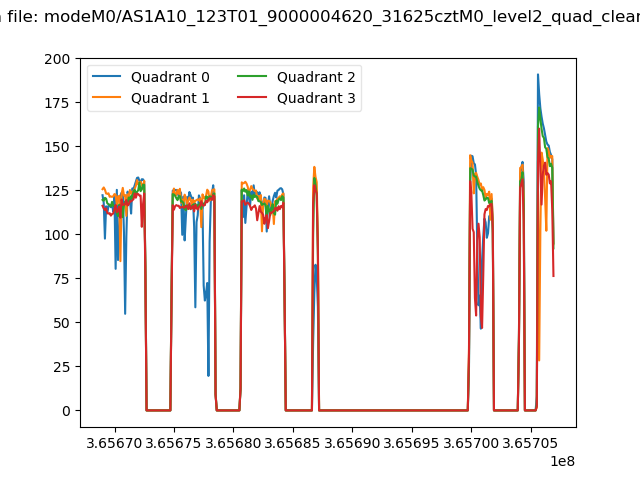 |
|
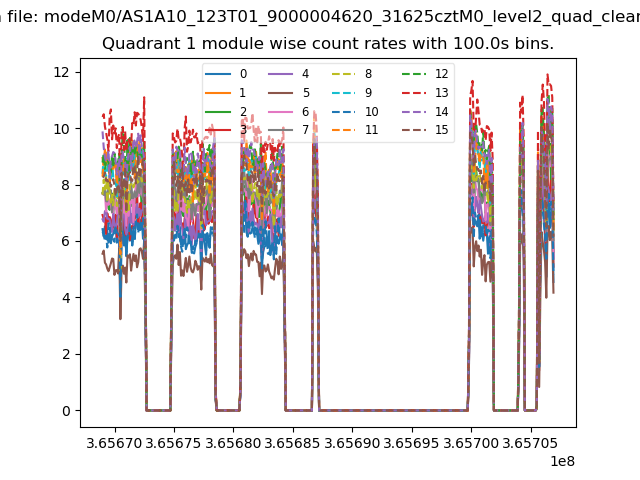
| Module-wise count rates for Quadrant A Data is divided into 100 sec bins |
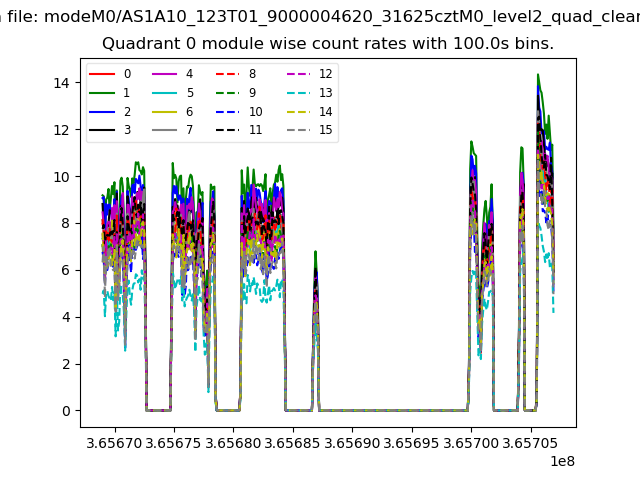 |
 |
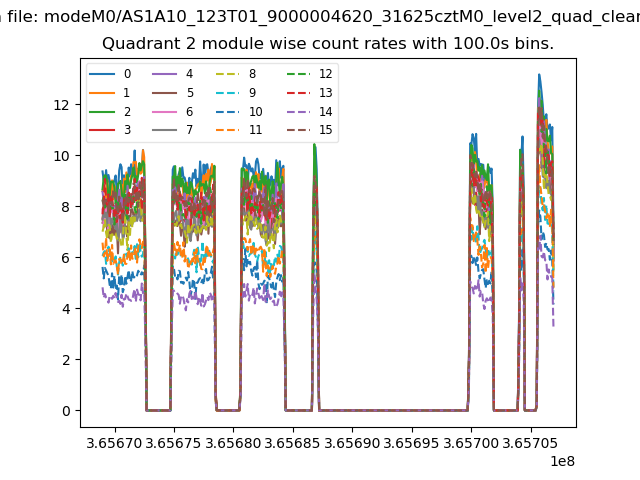
| Module-wise count rates for Quadrant B Data is divided into 100 sec bins |
 |
 |
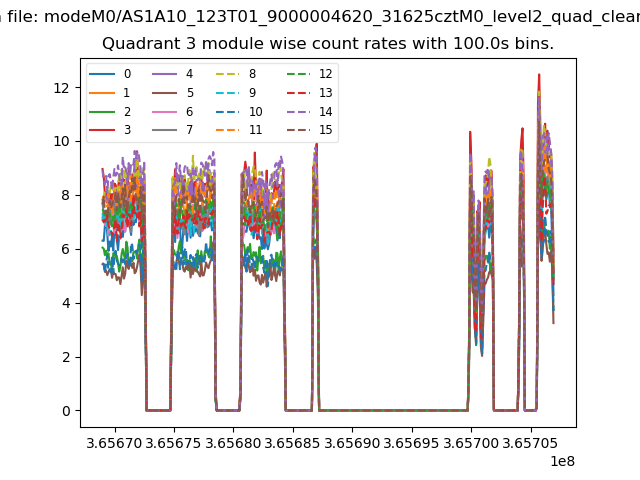
| Module-wise count rates for Quadrant C Data is divided into 100 sec bins |
 |
 |
| Module-wise count rates for Quadrant D Data is divided into 100 sec bins |
 |
 |
| Parameter | Plot |
|---|---|
| CZT HV Monitor | 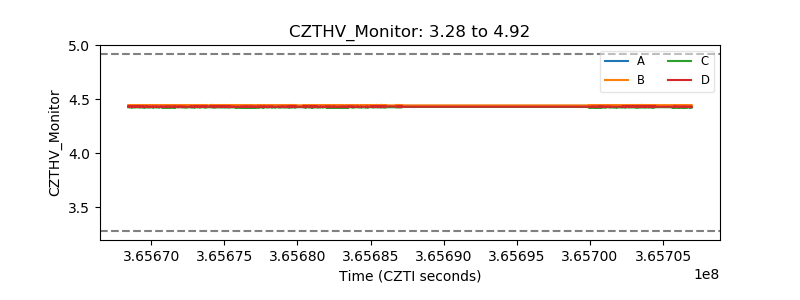 |
| D_VDD | 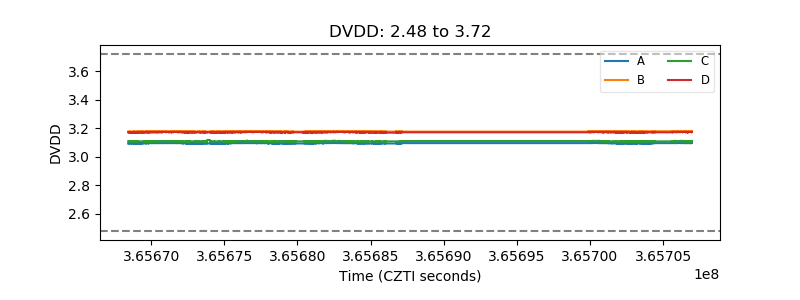 |
| Temperature 1 | 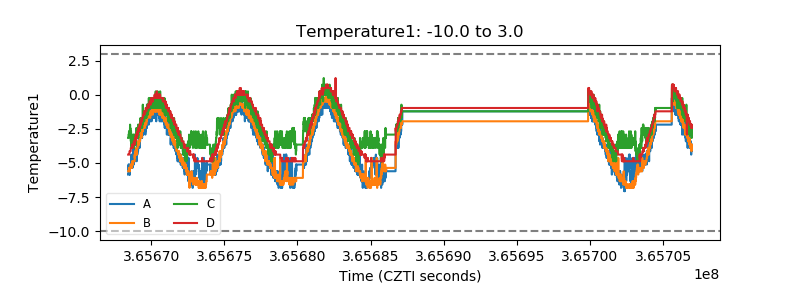 |
| Veto HV Monitor |  |
| Veto LLD | 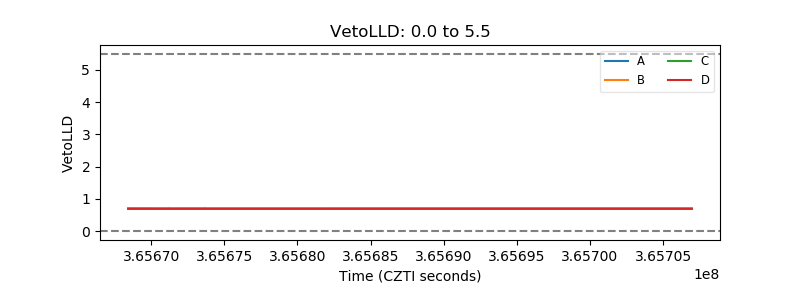 |
| Alpha Counter | 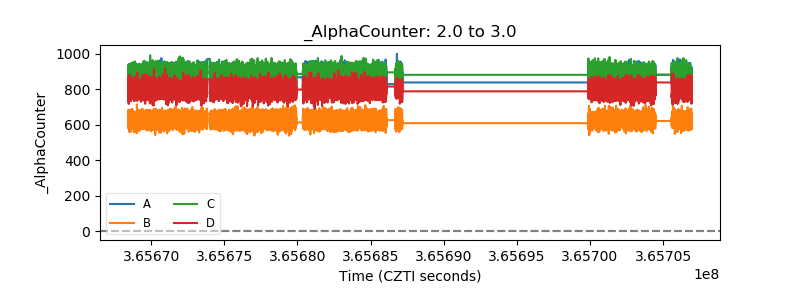 |
| _CPM_Rate | 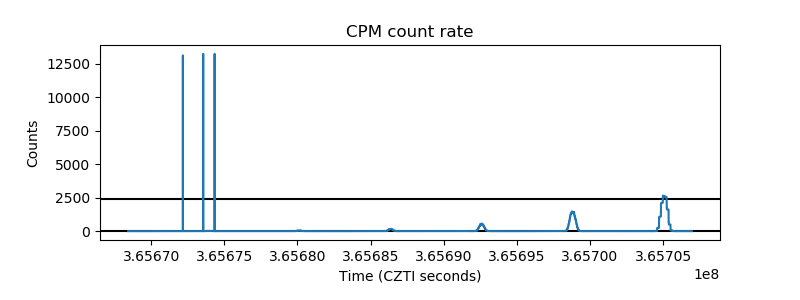 |
| CZT Counter | 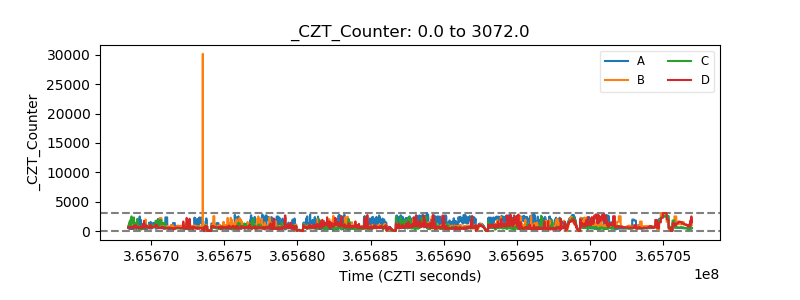 |
| +2.5 Volts monitor |  |
| +5 Volts monitor |  |
| _ROLL_ROT | 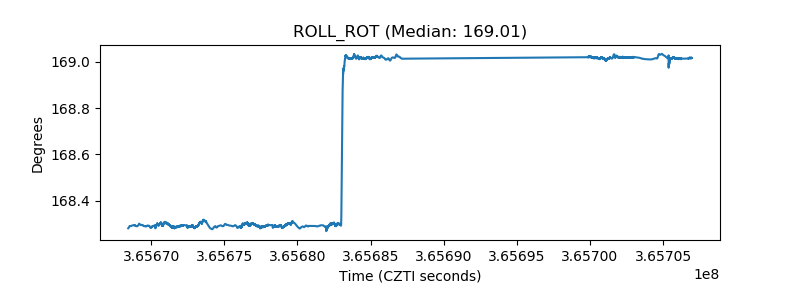 |
| _Roll_DEC | 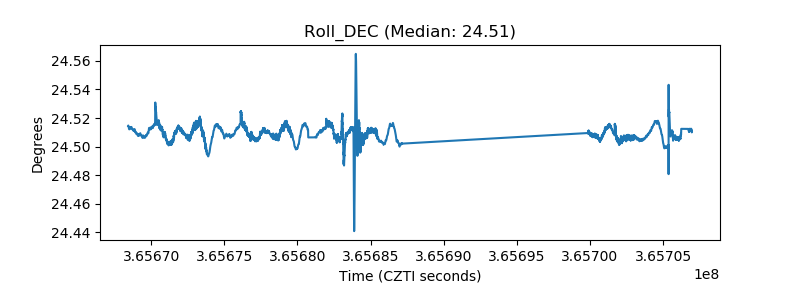 |
| _Roll_RA | 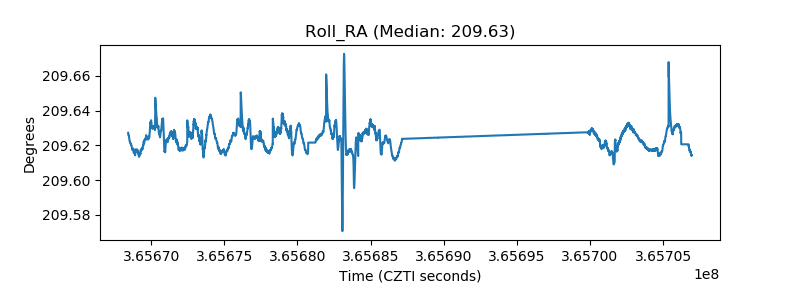 |
| Veto Counter | 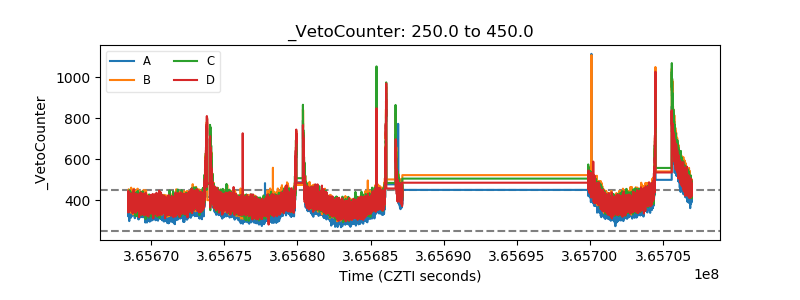 |