| Param | Original file | Final file |
|---|---|---|
| Filename | modeM0/AS1A10_123T01_9000004620_31627cztM0_level2.evt | modeM0/AS1A10_123T01_9000004620_31627cztM0_level2_quad_clean.evt |
| Size (bytes) | 719,925,120 | 93,818,880 |
| Size | 686.6 MB | 89.5 MB |
| Events in quadrant A | 3,197,839 | 651,700 |
| Events in quadrant B | 5,739,424 | 650,744 |
| Events in quadrant C | 6,106,567 | 567,559 |
| Events in quadrant D | 6,339,206 | 535,479 |
| Mode M0 | |||
|---|---|---|---|
| Quadrant | BADHDUFLAG | Total packets | Discarded packets |
| A | 0 | 13305 | 2 |
| B | 0 | 21449 | 2 |
| C | 0 | 22337 | 2 |
| D | 0 | 23569 | 2 |
| Mode M9 | |||
|---|---|---|---|
| Quadrant | BADHDUFLAG | Total packets | Discarded packets |
| A | 0 | 13 | 0 |
| B | 0 | 13 | 0 |
| C | 0 | 13 | 0 |
| D | 0 | 13 | 0 |
| Mode SS | |||
|---|---|---|---|
| Quadrant | BADHDUFLAG | Total packets | Discarded packets |
| A | 0 | 126 | 0 |
| B | 0 | 126 | 0 |
| C | 0 | 126 | 0 |
| D | 0 | 126 | 0 |
| Quadrant | Total seconds | Saturated seconds | Saturation percentage |
|---|---|---|---|
| A | 6236 | 22 | 0.352790% |
| B | 6236 | 237 | 3.800513% |
| C | 6236 | 880 | 14.111610% |
| D | 6236 | 653 | 10.471456% |
Noise dominated data is calculated using 1-second bins in cleaned event files. If a bin has >2000 counts, and if more than 50% of those come from <1% of pixels, then it is considered to be noise-dominated and hence unusable.
| Quadrant | # 1 sec bins | Bins with >0 counts | Bins with >2000 counts | High rate bins dominated by noise | Noise dominated (total time) | Noise dominated (detector-on time) | Marked lightcurve |
|---|---|---|---|---|---|---|---|
| A | 7546 | 6237 | 0 | 0 | 0.00% | 0.00% | 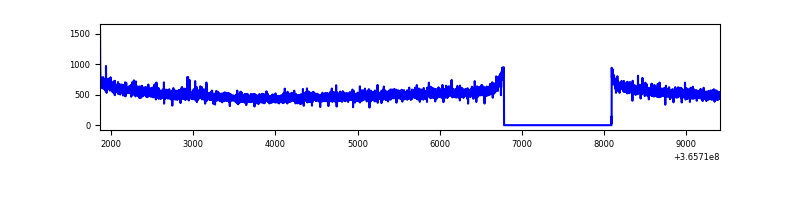 |
| B | 7546 | 6237 | 102 | 102 | 1.35% | 1.64% | 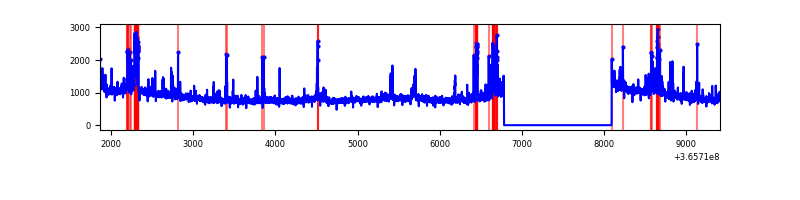 |
| C | 7546 | 6237 | 321 | 321 | 4.25% | 5.15% |  |
| D | 7546 | 6237 | 615 | 615 | 8.15% | 9.86% | 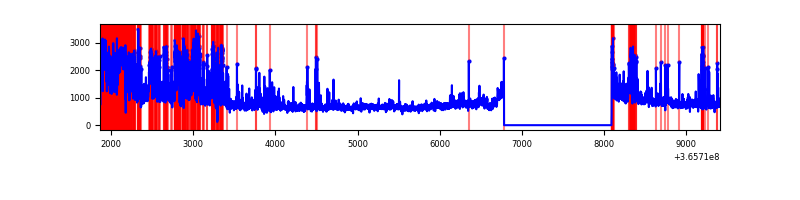 |
Top three noisy pixels from each quadrant. If the there are fewer than three noisy pixels in the level2.evt file, extra rows are filled as -1
| Pixel properties | Quadrant properties | ||||||
|---|---|---|---|---|---|---|---|
| Quadrant | DetID | PixID | Counts | Sigma | Mean | Median | Sigma |
| A | 13 | 254 | 13592 | 78.83 | 822 | 809 | 162.2 |
| A | 14 | 238 | 11769 | 67.58 | 822 | 809 | 162.2 |
| A | 3 | 137 | 7431 | 40.83 | 822 | 809 | 162.2 |
| B | 6 | 159 | 1935212 | 12714.67 | 819 | 802 | 152.1 |
| B | 5 | 172 | 225886 | 1479.45 | 819 | 802 | 152.1 |
| B | 10 | 245 | 91336 | 595.07 | 819 | 802 | 152.1 |
| C | 3 | 233 | 2724104 | 15645.57 | 748 | 756 | 174.1 |
| C | 14 | 238 | 165261 | 945.07 | 748 | 756 | 174.1 |
| C | 0 | 10 | 153380 | 876.82 | 748 | 756 | 174.1 |
| D | 8 | 195 | 1593177 | 8987.85 | 746 | 729 | 177.2 |
| D | 12 | 218 | 1255314 | 7080.94 | 746 | 729 | 177.2 |
| D | 13 | 249 | 241359 | 1358.13 | 746 | 729 | 177.2 |
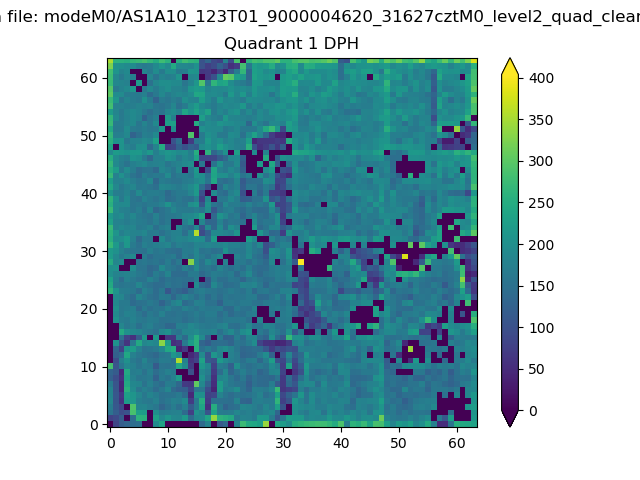
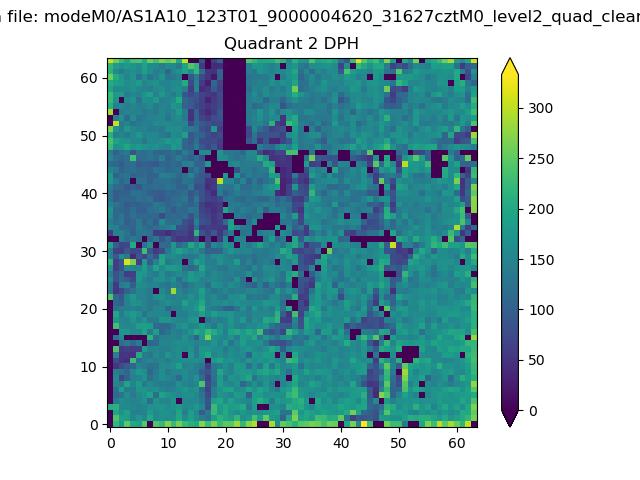
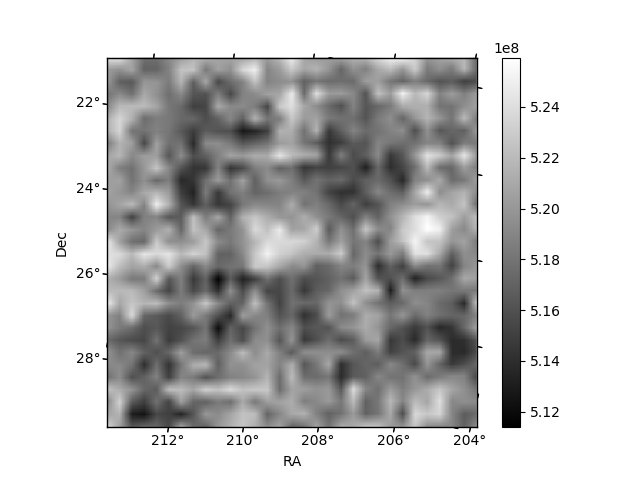
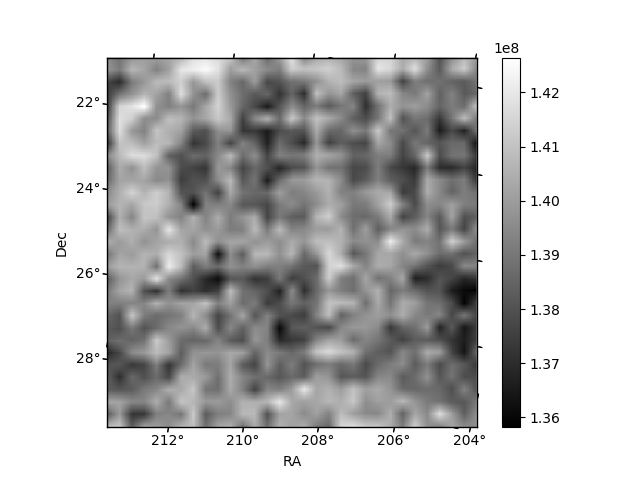
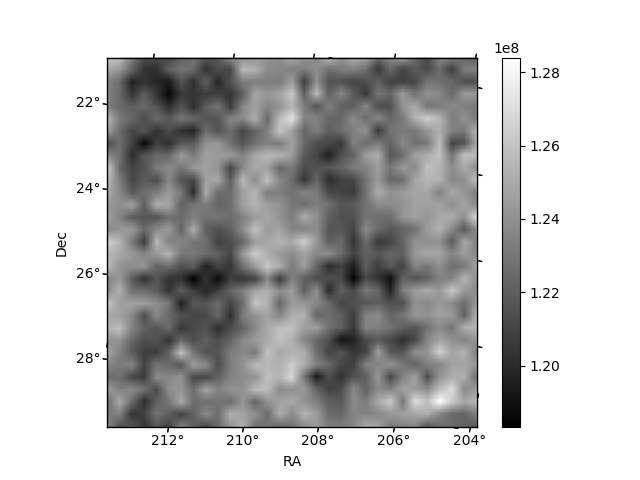
Histogram calculated using DETX and DETY for each event in the final _common_clean file
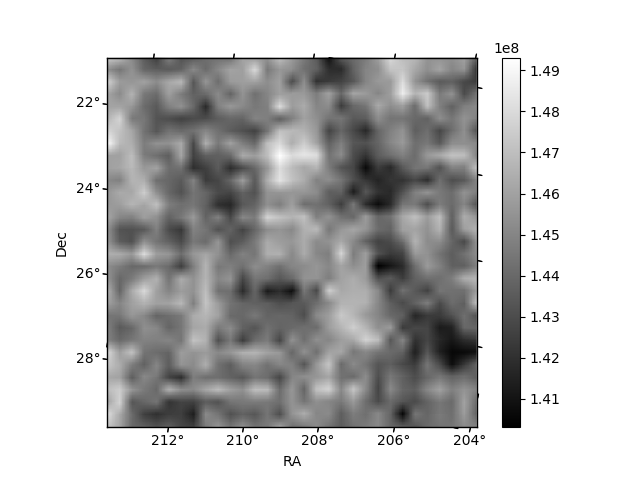
| Quadrant A | 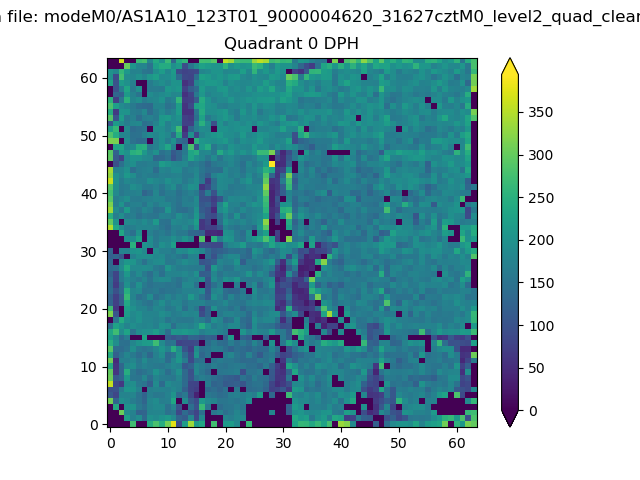 |
 |
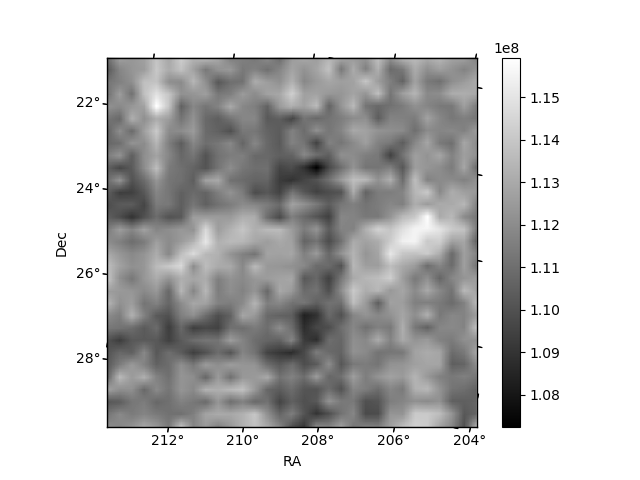
Quadrant B |
|---|---|---|---|
| Quadrant D | 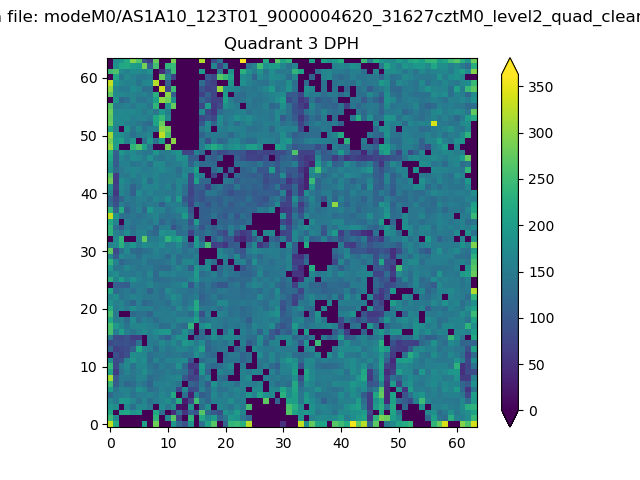 |
 |
Quadrant C |
| Plot type | Count rate plots | Images |
|---|---|---|
| Comparison with Poisson distribution Blue bars denote a histogram of data divided into 1 sec bins. Red curve is a Poisson curve with rate = median count rate of data. |
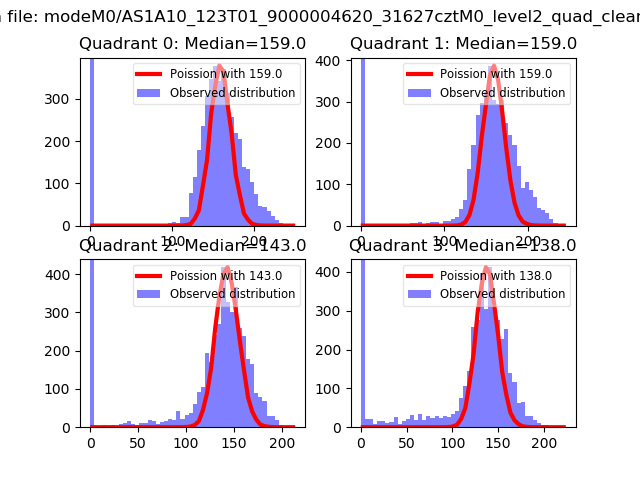 |
 |
| Quadrant-wise count rates Data is divided into 100 sec bins |
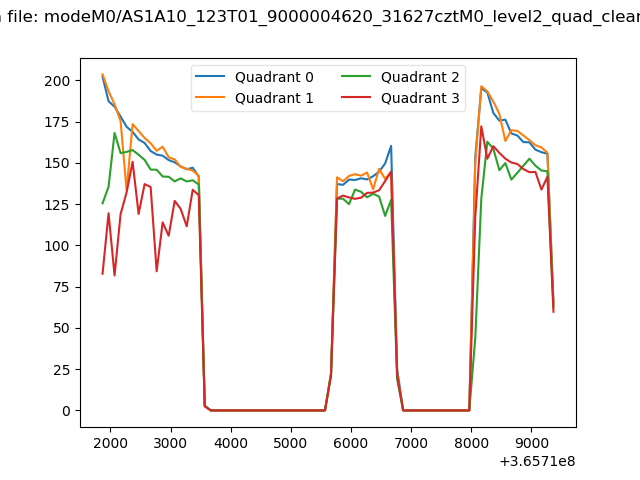 |
|
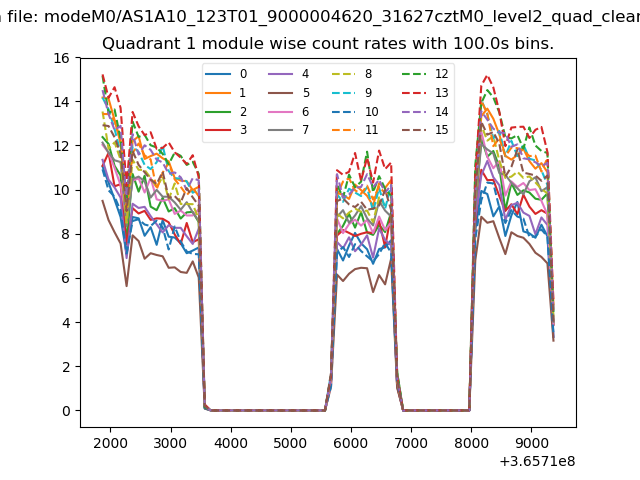
| Module-wise count rates for Quadrant A Data is divided into 100 sec bins |
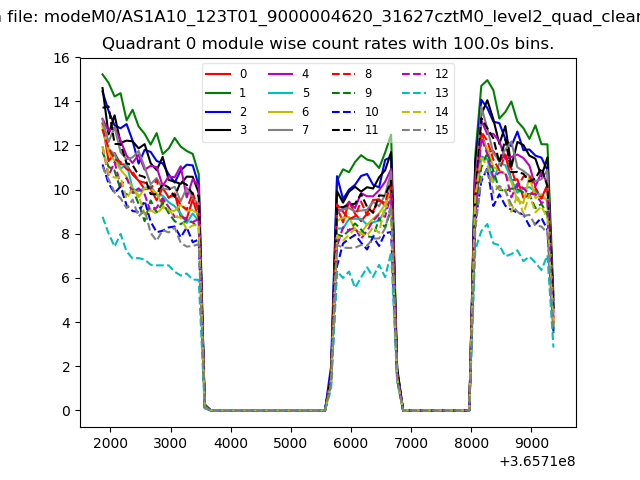 |
 |
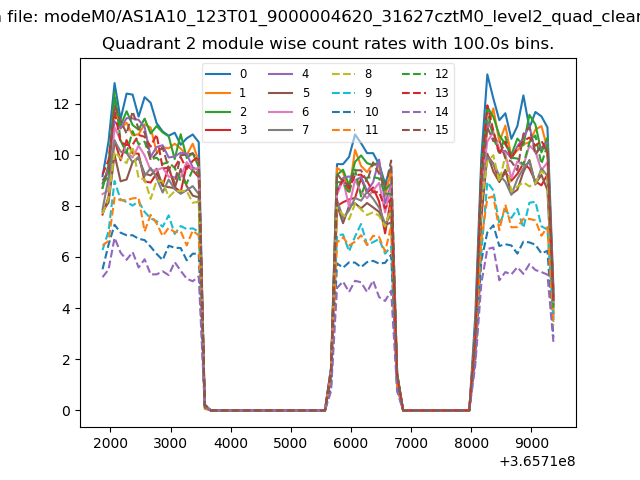
| Module-wise count rates for Quadrant B Data is divided into 100 sec bins |
 |
 |
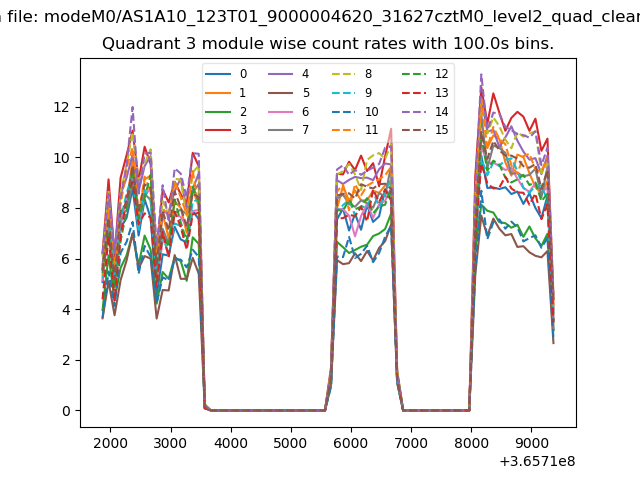
| Module-wise count rates for Quadrant C Data is divided into 100 sec bins |
 |
 |
| Module-wise count rates for Quadrant D Data is divided into 100 sec bins |
 |
 |
| Parameter | Plot |
|---|---|
| CZT HV Monitor |  |
| D_VDD | 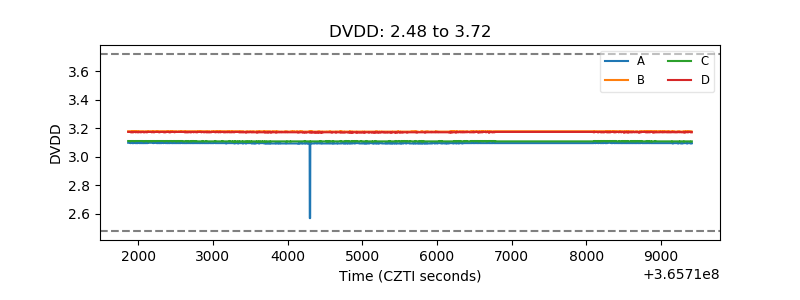 |
| Temperature 1 | 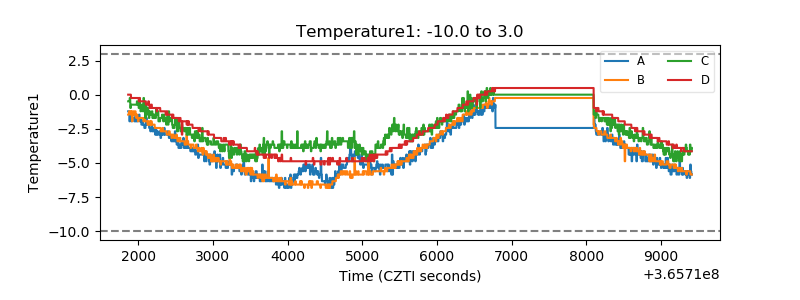 |
| Veto HV Monitor | 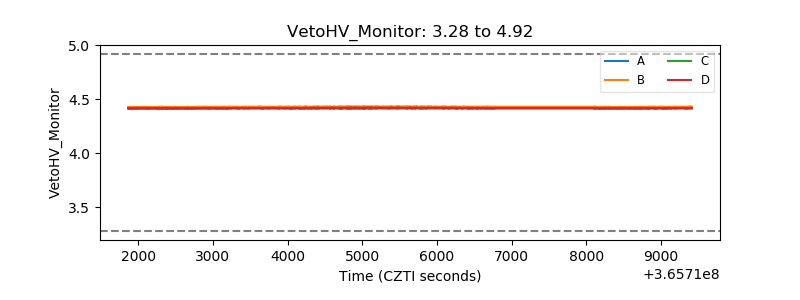 |
| Veto LLD | 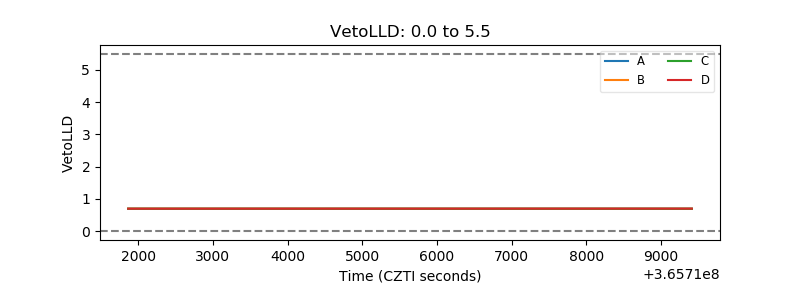 |
| Alpha Counter | 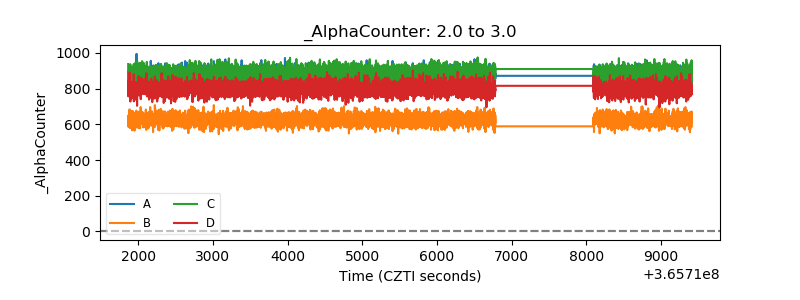 |
| _CPM_Rate | 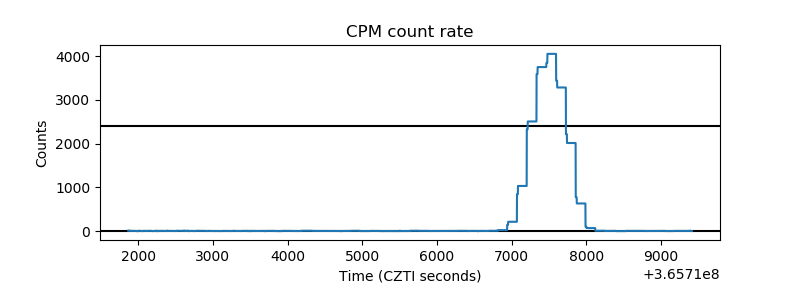 |
| CZT Counter | 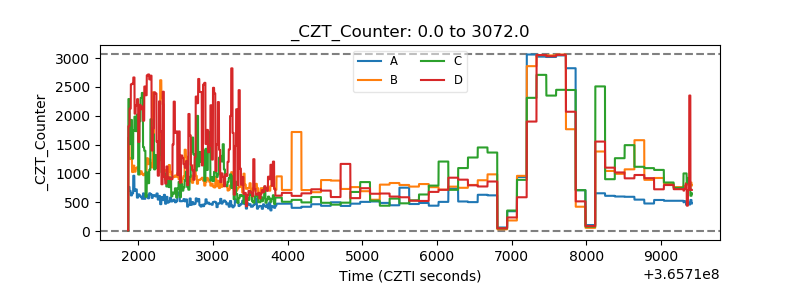 |
| +2.5 Volts monitor |  |
| +5 Volts monitor |  |
| _ROLL_ROT |  |
| _Roll_DEC | 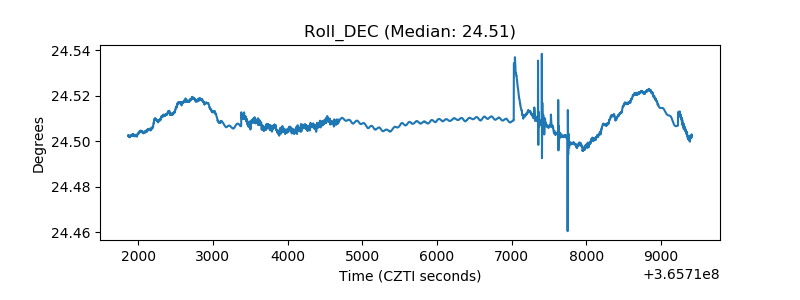 |
| _Roll_RA | 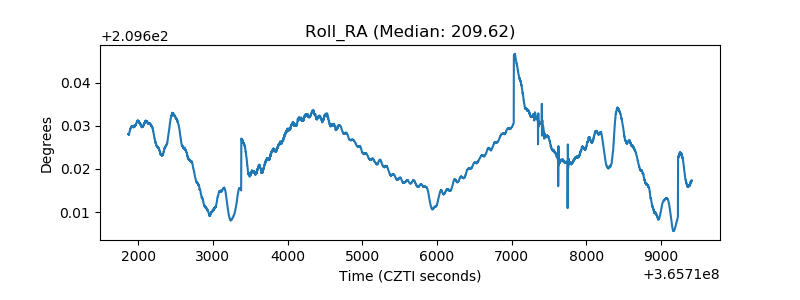 |
| Veto Counter | 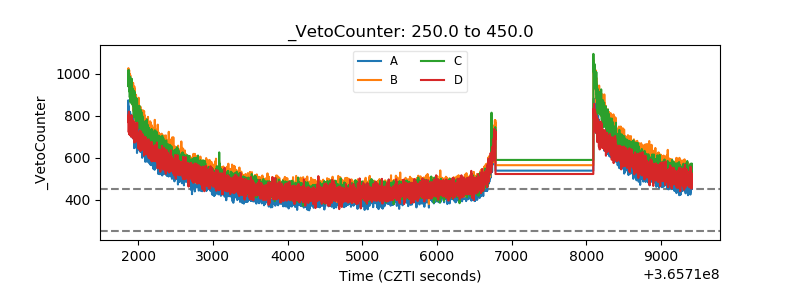 |