| Param | Original file | Final file |
|---|---|---|
| Filename | modeM0/AS1A10_123T01_9000004620_31628cztM0_level2.evt | modeM0/AS1A10_123T01_9000004620_31628cztM0_level2_quad_clean.evt |
| Size (bytes) | 638,668,800 | 83,473,920 |
| Size | 609.1 MB | 79.6 MB |
| Events in quadrant A | 3,124,260 | 556,745 |
| Events in quadrant B | 5,810,382 | 543,392 |
| Events in quadrant C | 4,715,508 | 508,758 |
| Events in quadrant D | 5,280,802 | 493,089 |
| Mode M0 | |||
|---|---|---|---|
| Quadrant | BADHDUFLAG | Total packets | Discarded packets |
| A | 0 | 12835 | 1 |
| B | 0 | 21424 | 1 |
| C | 0 | 17985 | 1 |
| D | 0 | 19891 | 1 |
| Mode M9 | |||
|---|---|---|---|
| Quadrant | BADHDUFLAG | Total packets | Discarded packets |
| A | 0 | 13 | 0 |
| B | 0 | 13 | 0 |
| C | 0 | 13 | 0 |
| D | 0 | 13 | 0 |
| Mode SS | |||
|---|---|---|---|
| Quadrant | BADHDUFLAG | Total packets | Discarded packets |
| A | 0 | 124 | 0 |
| B | 0 | 124 | 0 |
| C | 0 | 124 | 0 |
| D | 0 | 124 | 0 |
| Quadrant | Total seconds | Saturated seconds | Saturation percentage |
|---|---|---|---|
| A | 6092 | 31 | 0.508864% |
| B | 6092 | 354 | 5.810900% |
| C | 6092 | 385 | 6.319764% |
| D | 6093 | 257 | 4.217955% |
Noise dominated data is calculated using 1-second bins in cleaned event files. If a bin has >2000 counts, and if more than 50% of those come from <1% of pixels, then it is considered to be noise-dominated and hence unusable.
| Quadrant | # 1 sec bins | Bins with >0 counts | Bins with >2000 counts | High rate bins dominated by noise | Noise dominated (total time) | Noise dominated (detector-on time) | Marked lightcurve |
|---|---|---|---|---|---|---|---|
| A | 7412 | 6093 | 0 | 0 | 0.00% | 0.00% | 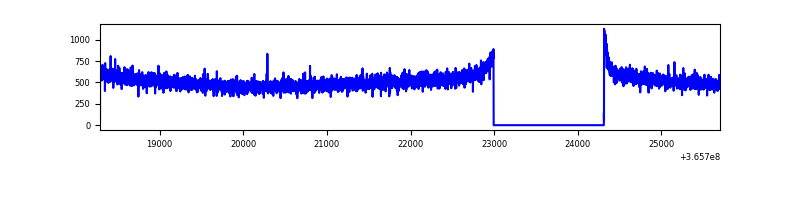 |
| B | 7412 | 6093 | 194 | 194 | 2.62% | 3.18% | 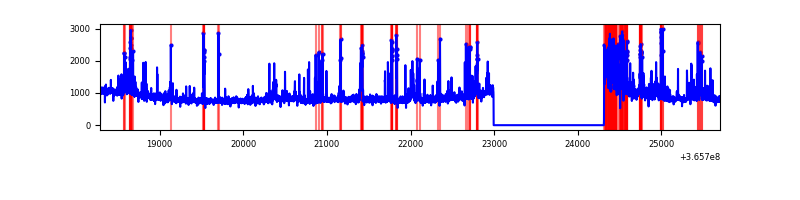 |
| C | 7412 | 6093 | 129 | 129 | 1.74% | 2.12% | 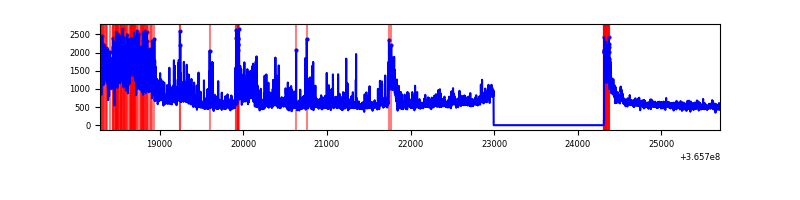 |
| D | 7413 | 6094 | 246 | 246 | 3.32% | 4.04% | 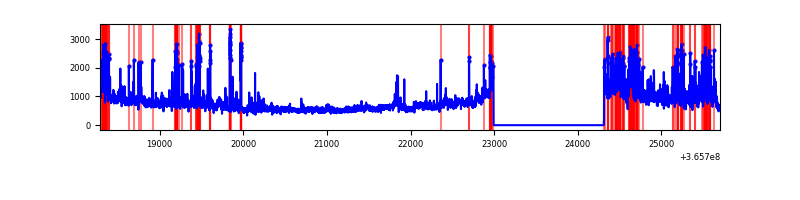 |
Top three noisy pixels from each quadrant. If the there are fewer than three noisy pixels in the level2.evt file, extra rows are filled as -1
| Pixel properties | Quadrant properties | ||||||
|---|---|---|---|---|---|---|---|
| Quadrant | DetID | PixID | Counts | Sigma | Mean | Median | Sigma |
| A | 13 | 254 | 13378 | 78.13 | 808 | 794 | 161.1 |
| A | 3 | 137 | 7380 | 40.89 | 808 | 794 | 161.1 |
| A | 0 | 226 | 6829 | 37.47 | 808 | 794 | 161.1 |
| B | 6 | 159 | 1769594 | 11842.02 | 795 | 778 | 149.4 |
| B | 10 | 245 | 545303 | 3645.53 | 795 | 778 | 149.4 |
| B | 5 | 172 | 129613 | 862.54 | 795 | 778 | 149.4 |
| C | 3 | 233 | 1437066 | 8116.11 | 760 | 766 | 177.0 |
| C | 14 | 238 | 142934 | 803.35 | 760 | 766 | 177.0 |
| C | 0 | 10 | 90542 | 507.3 | 760 | 766 | 177.0 |
| D | 8 | 195 | 1352478 | 7429.48 | 756 | 734 | 181.9 |
| D | 12 | 218 | 426309 | 2339.05 | 756 | 734 | 181.9 |
| D | 2 | 250 | 208467 | 1141.75 | 756 | 734 | 181.9 |
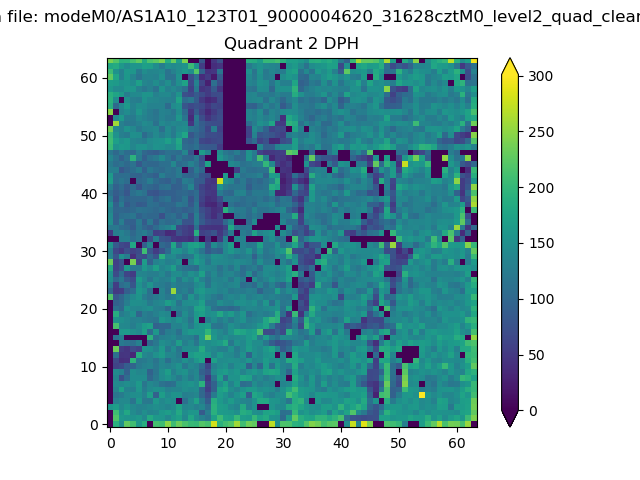
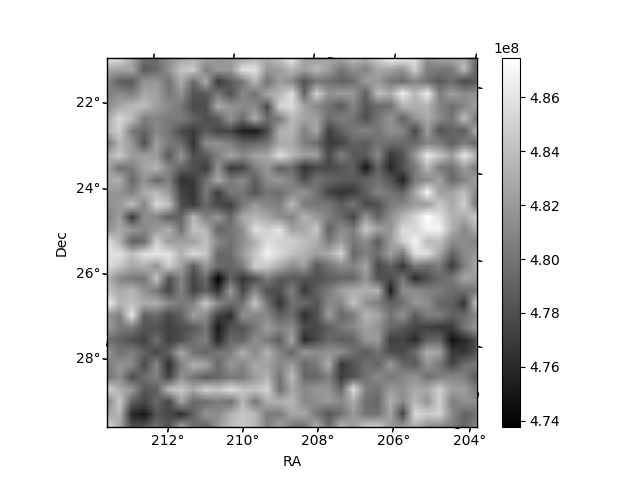
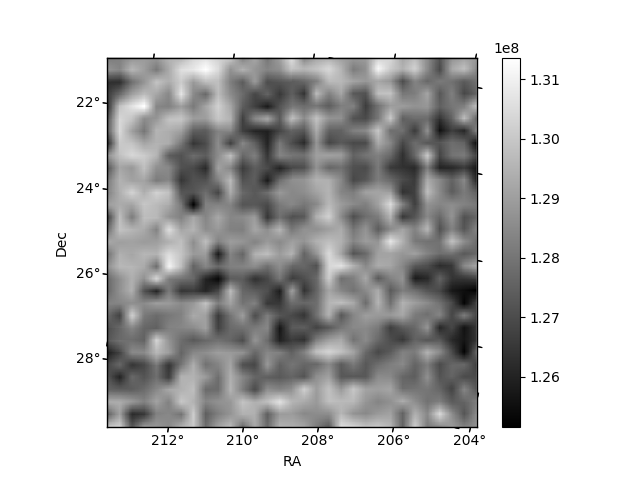
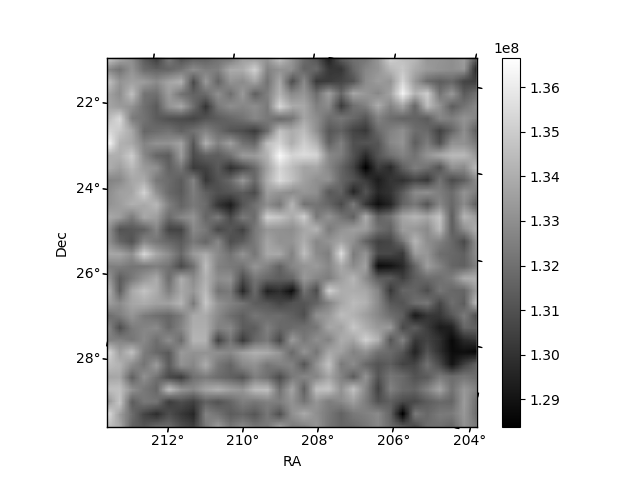
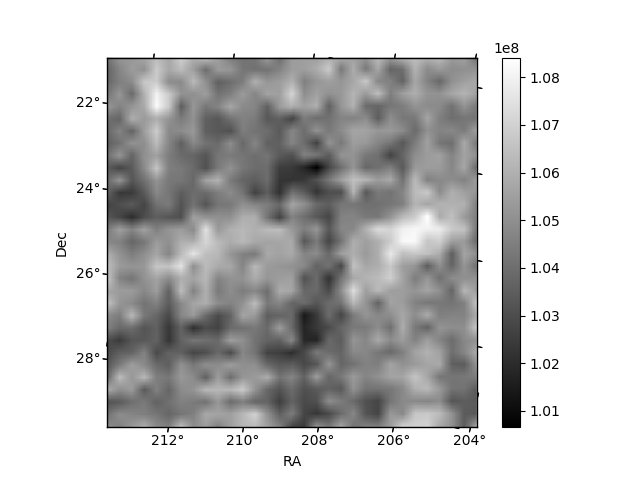
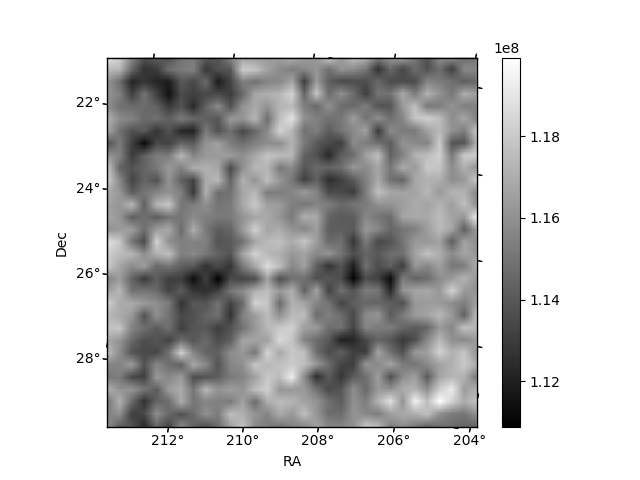
Histogram calculated using DETX and DETY for each event in the final _common_clean file
| Quadrant A | 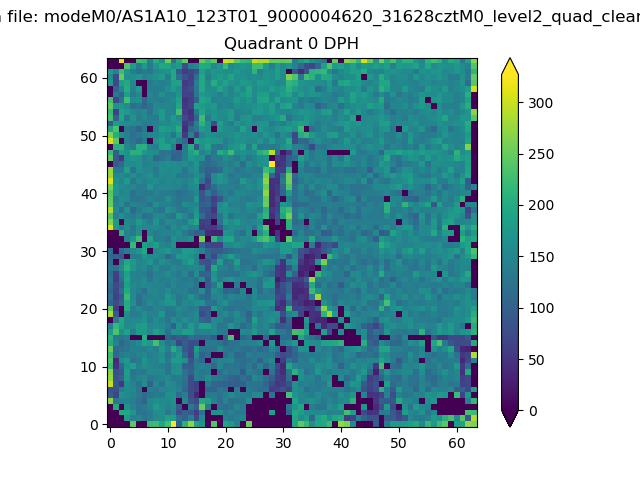 |
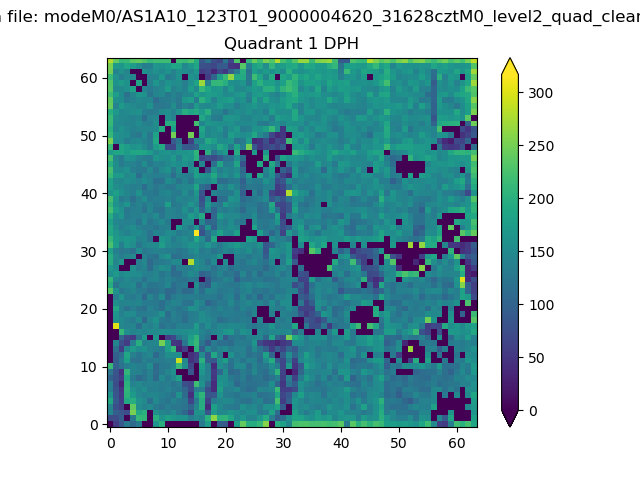 |
Quadrant B |
|---|---|---|---|
| Quadrant D | 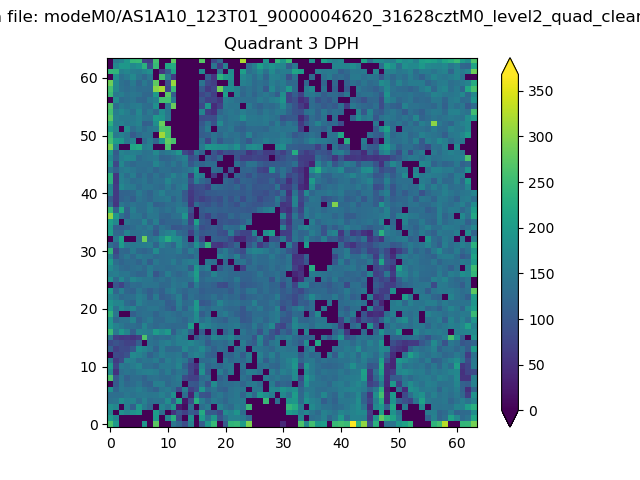 |
 |
Quadrant C |
| Plot type | Count rate plots | Images |
|---|---|---|
| Comparison with Poisson distribution Blue bars denote a histogram of data divided into 1 sec bins. Red curve is a Poisson curve with rate = median count rate of data. |
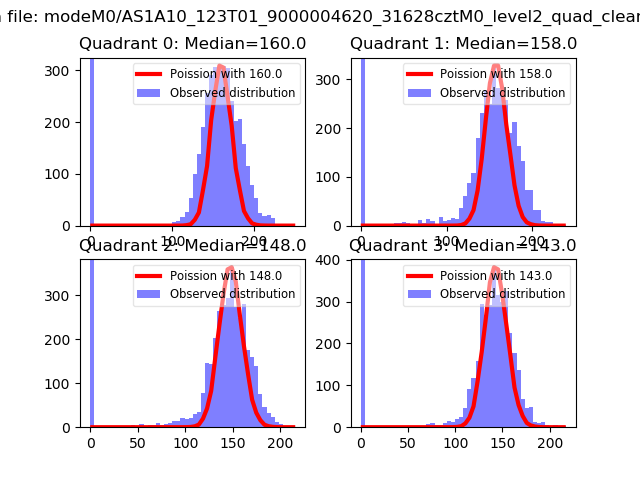 |
 |
| Quadrant-wise count rates Data is divided into 100 sec bins |
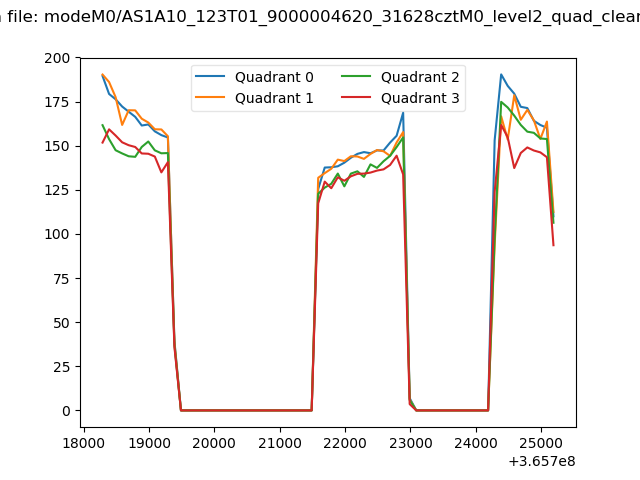 |
|
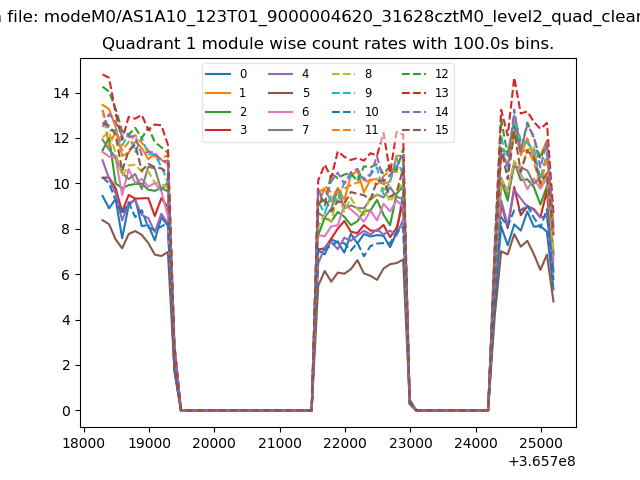
| Module-wise count rates for Quadrant A Data is divided into 100 sec bins |
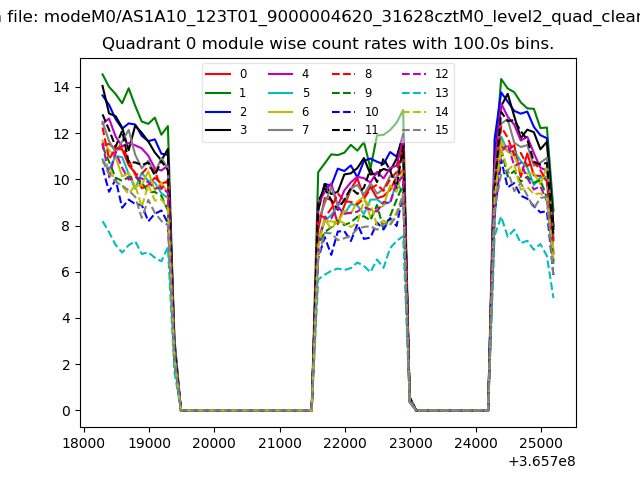 |
 |
| Module-wise count rates for Quadrant B Data is divided into 100 sec bins |
 |
 |
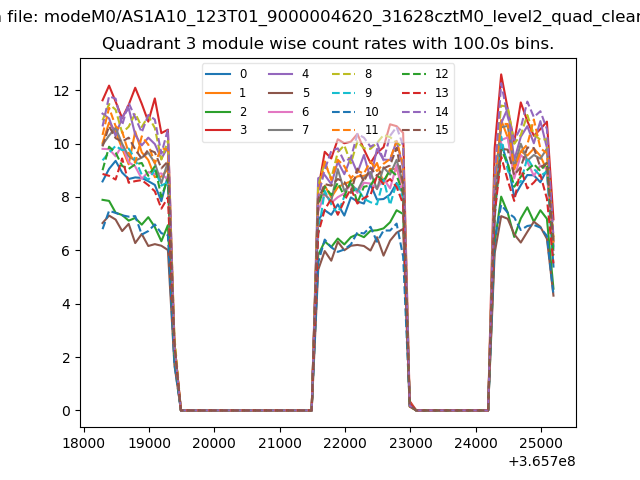
| Module-wise count rates for Quadrant C Data is divided into 100 sec bins |
 |
 |
| Module-wise count rates for Quadrant D Data is divided into 100 sec bins |
 |
 |
| Parameter | Plot |
|---|---|
| CZT HV Monitor |  |
| D_VDD | 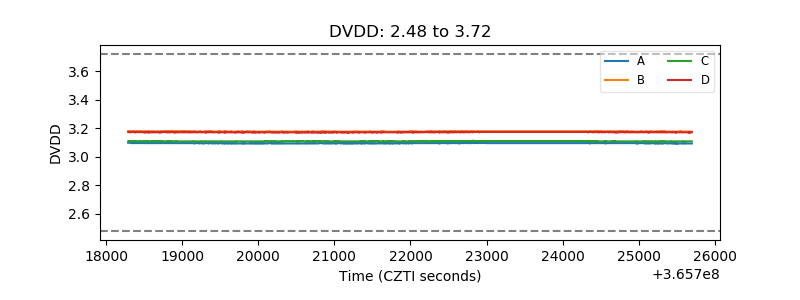 |
| Temperature 1 | 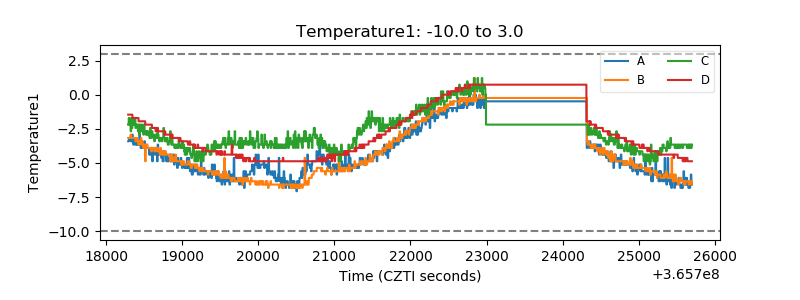 |
| Veto HV Monitor | 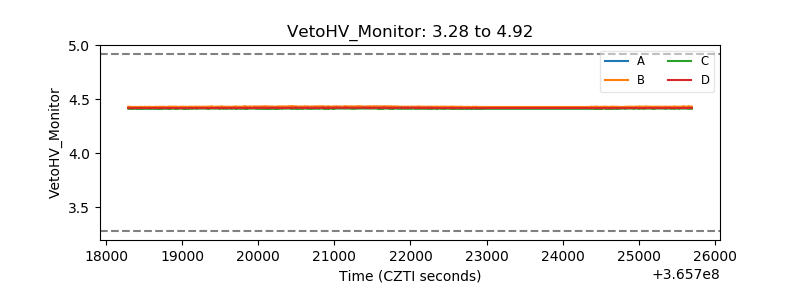 |
| Veto LLD | 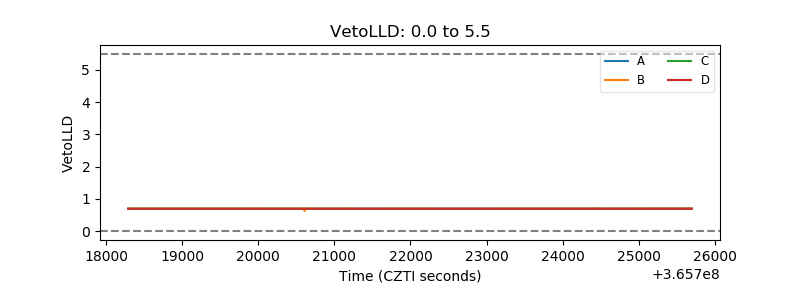 |
| Alpha Counter | 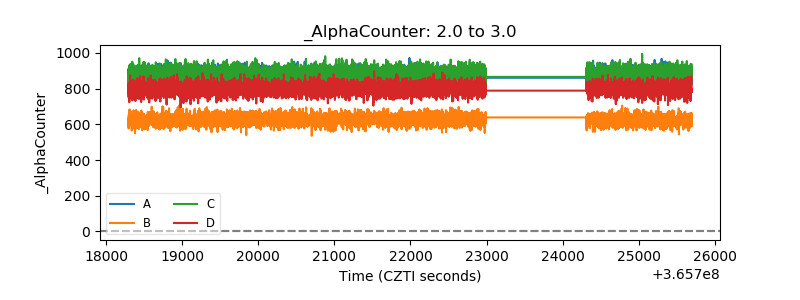 |
| _CPM_Rate | 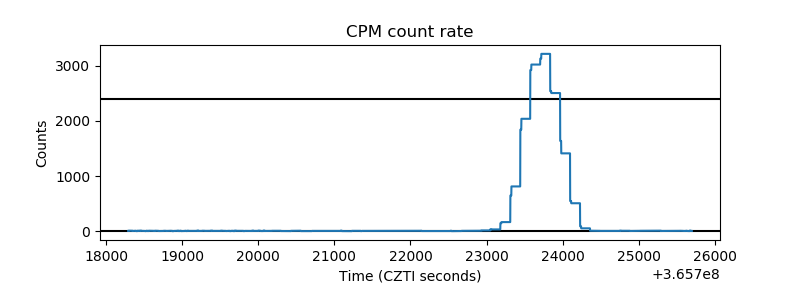 |
| CZT Counter | 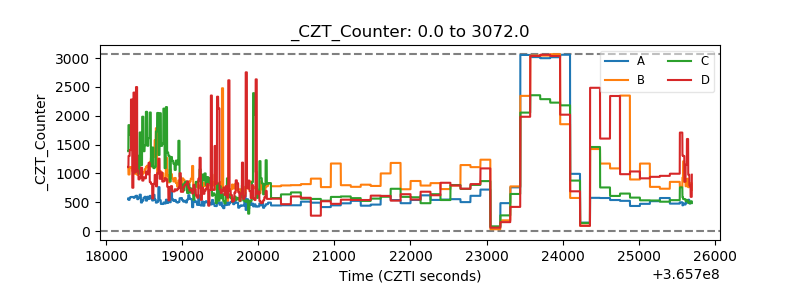 |
| +2.5 Volts monitor |  |
| +5 Volts monitor |  |
| _ROLL_ROT | 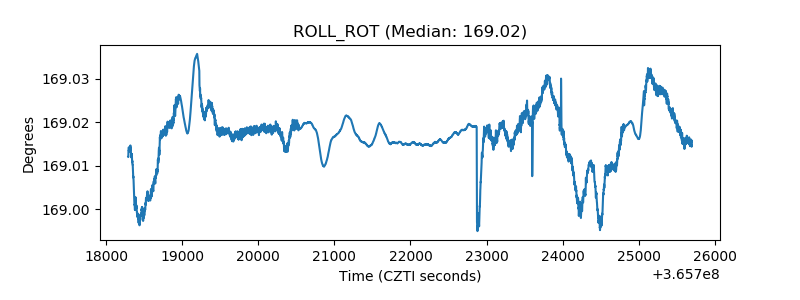 |
| _Roll_DEC | 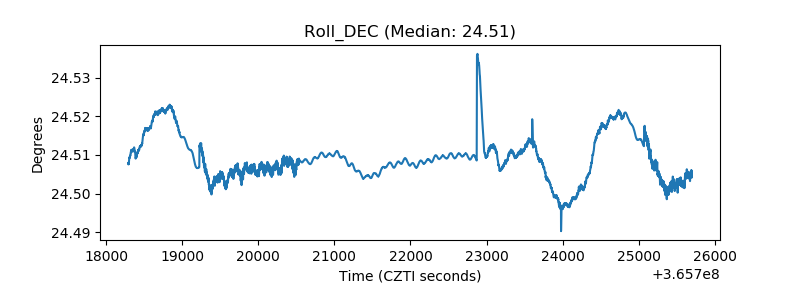 |
| _Roll_RA | 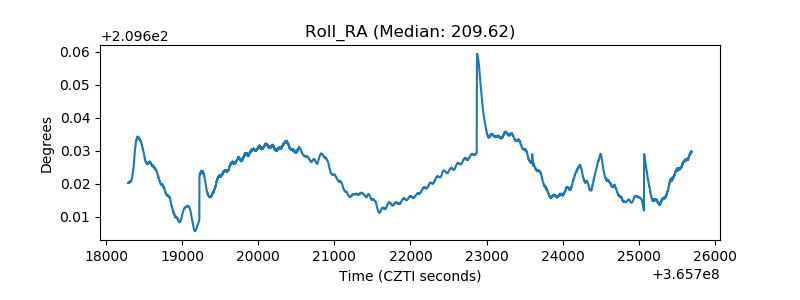 |
| Veto Counter | 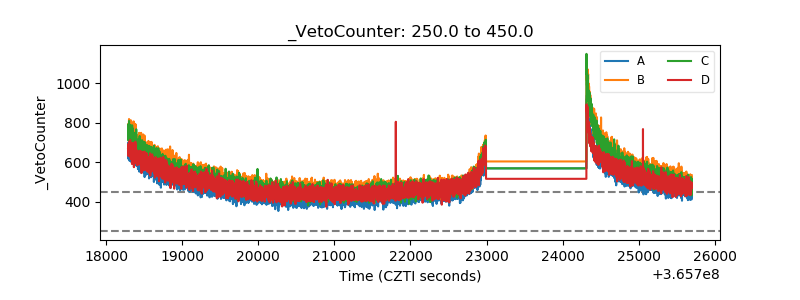 |