| Param | Original file | Final file |
|---|---|---|
| Filename | modeM0/AS1A10_123T01_9000004620_31629cztM0_level2.evt | modeM0/AS1A10_123T01_9000004620_31629cztM0_level2_quad_clean.evt |
| Size (bytes) | 577,578,240 | 66,553,920 |
| Size | 550.8 MB | 63.5 MB |
| Events in quadrant A | 2,952,420 | 425,952 |
| Events in quadrant B | 5,154,786 | 421,750 |
| Events in quadrant C | 3,425,514 | 398,009 |
| Events in quadrant D | 5,568,863 | 365,125 |
| Mode M0 | |||
|---|---|---|---|
| Quadrant | BADHDUFLAG | Total packets | Discarded packets |
| A | 0 | 12116 | 1 |
| B | 0 | 19115 | 1 |
| C | 0 | 13593 | 1 |
| D | 0 | 20670 | 1 |
| Mode M9 | |||
|---|---|---|---|
| Quadrant | BADHDUFLAG | Total packets | Discarded packets |
| A | 0 | 13 | 0 |
| B | 0 | 13 | 0 |
| C | 0 | 13 | 0 |
| D | 0 | 13 | 0 |
| Mode SS | |||
|---|---|---|---|
| Quadrant | BADHDUFLAG | Total packets | Discarded packets |
| A | 0 | 118 | 0 |
| B | 0 | 118 | 0 |
| C | 0 | 118 | 0 |
| D | 0 | 118 | 0 |
| Quadrant | Total seconds | Saturated seconds | Saturation percentage |
|---|---|---|---|
| A | 5777 | 48 | 0.830881% |
| B | 5777 | 224 | 3.877445% |
| C | 5778 | 185 | 3.201800% |
| D | 5778 | 422 | 7.303565% |
Noise dominated data is calculated using 1-second bins in cleaned event files. If a bin has >2000 counts, and if more than 50% of those come from <1% of pixels, then it is considered to be noise-dominated and hence unusable.
| Quadrant | # 1 sec bins | Bins with >0 counts | Bins with >2000 counts | High rate bins dominated by noise | Noise dominated (total time) | Noise dominated (detector-on time) | Marked lightcurve |
|---|---|---|---|---|---|---|---|
| A | 7052 | 5778 | 4 | 4 | 0.06% | 0.07% |  |
| B | 7052 | 5778 | 58 | 58 | 0.82% | 1.00% |  |
| C | 7053 | 5779 | 8 | 8 | 0.11% | 0.14% |  |
| D | 7053 | 5779 | 317 | 317 | 4.49% | 5.49% |  |
Top three noisy pixels from each quadrant. If the there are fewer than three noisy pixels in the level2.evt file, extra rows are filled as -1
| Pixel properties | Quadrant properties | ||||||
|---|---|---|---|---|---|---|---|
| Quadrant | DetID | PixID | Counts | Sigma | Mean | Median | Sigma |
| A | 12 | 96 | 24919 | 160.7 | 753 | 739 | 150.5 |
| A | 15 | 174 | 15433 | 97.66 | 753 | 739 | 150.5 |
| A | 13 | 254 | 11623 | 72.34 | 753 | 739 | 150.5 |
| B | 6 | 159 | 1665936 | 11981.02 | 745 | 729 | 139.0 |
| B | 10 | 245 | 230111 | 1650.38 | 745 | 729 | 139.0 |
| B | 5 | 172 | 139340 | 997.29 | 745 | 729 | 139.0 |
| C | 3 | 233 | 335100 | 2005.3 | 712 | 719 | 166.7 |
| C | 14 | 238 | 138914 | 828.76 | 712 | 719 | 166.7 |
| C | 0 | 10 | 91963 | 547.19 | 712 | 719 | 166.7 |
| D | 8 | 195 | 1487900 | 8830.45 | 699 | 679 | 168.4 |
| D | 11 | 176 | 700245 | 4153.71 | 699 | 679 | 168.4 |
| D | 12 | 218 | 194436 | 1150.44 | 699 | 679 | 168.4 |
Histogram calculated using DETX and DETY for each event in the final _common_clean file
| Quadrant A |  |
 |
Quadrant B |
|---|---|---|---|
| Quadrant D |  |
 |
Quadrant C |
| Plot type | Count rate plots | Images |
|---|---|---|
| Comparison with Poisson distribution Blue bars denote a histogram of data divided into 1 sec bins. Red curve is a Poisson curve with rate = median count rate of data. |
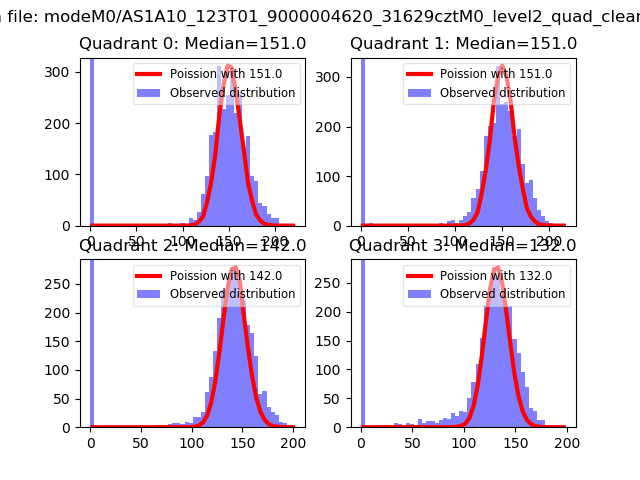 |
 |
| Quadrant-wise count rates Data is divided into 100 sec bins |
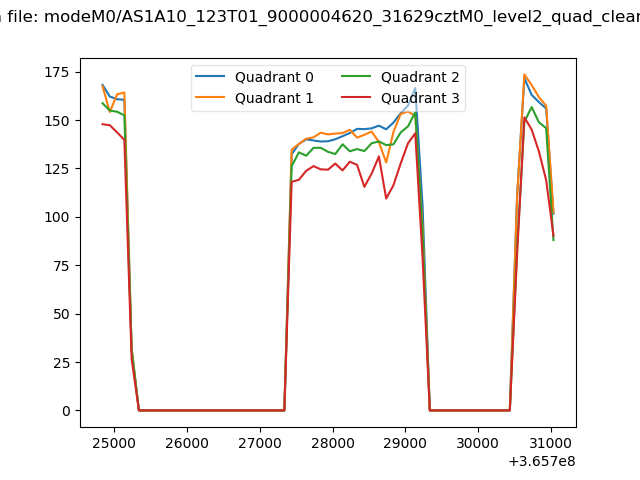 |
|
| Module-wise count rates for Quadrant A Data is divided into 100 sec bins |
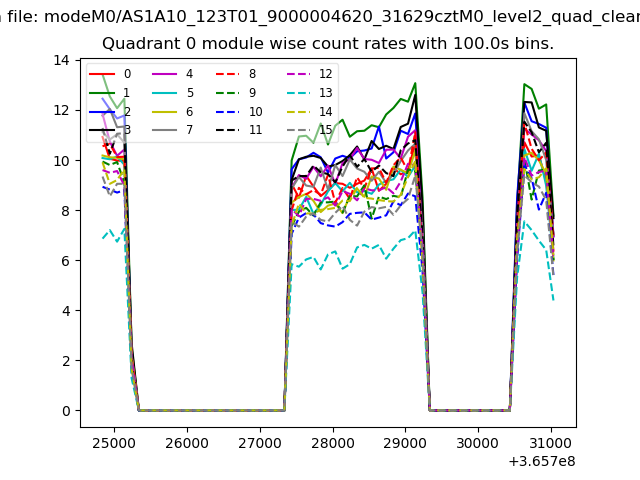 |
 |
| Module-wise count rates for Quadrant B Data is divided into 100 sec bins |
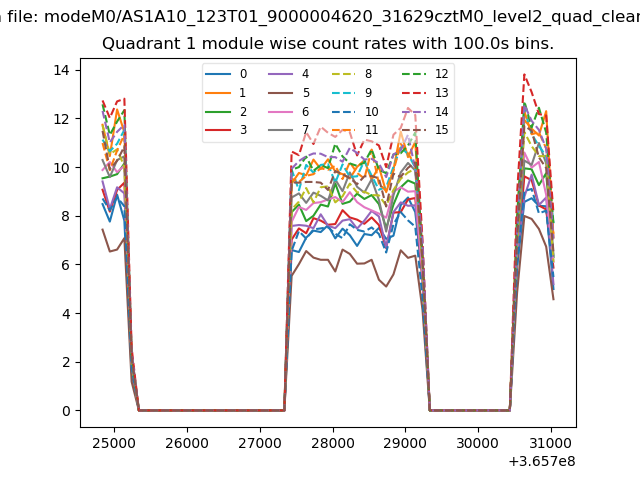 |
 |
| Module-wise count rates for Quadrant C Data is divided into 100 sec bins |
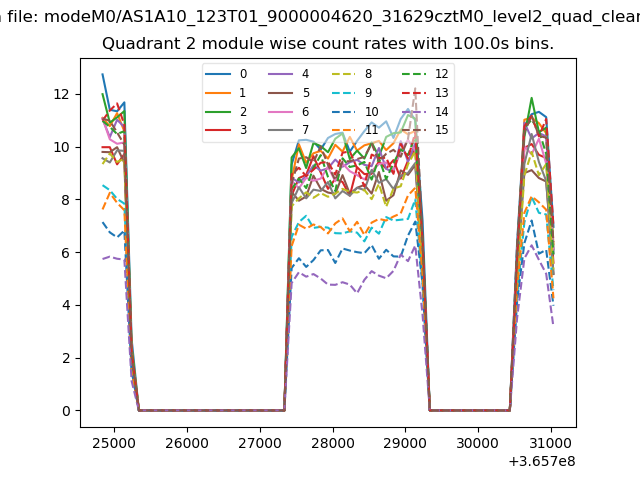 |
 |
| Module-wise count rates for Quadrant D Data is divided into 100 sec bins |
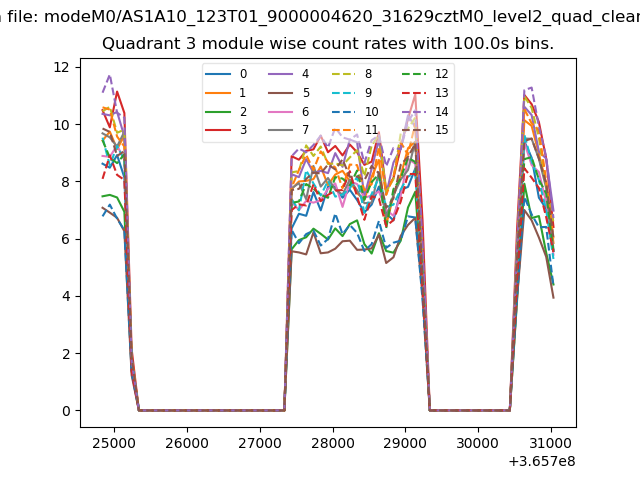 |
 |
| Parameter | Plot |
|---|---|
| CZT HV Monitor | 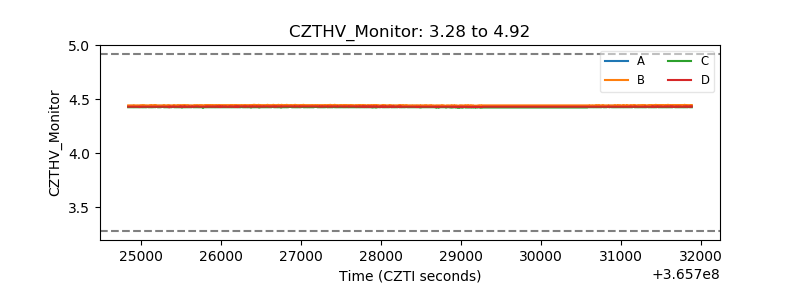 |
| D_VDD |  |
| Temperature 1 |  |
| Veto HV Monitor |  |
| Veto LLD |  |
| Alpha Counter | 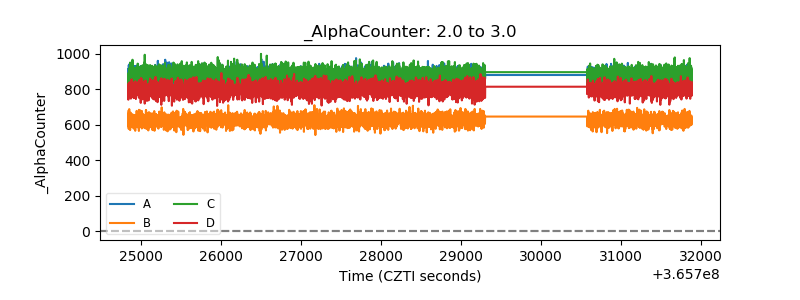 |
| _CPM_Rate | 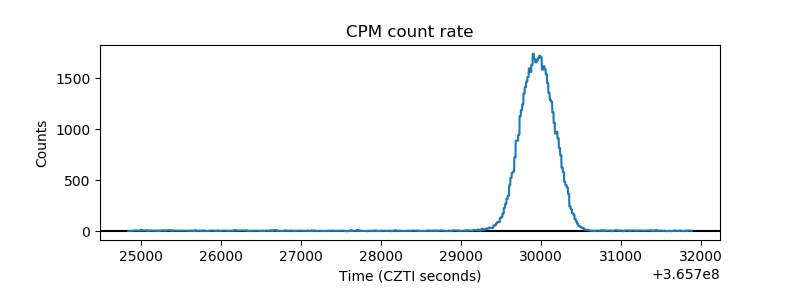 |
| CZT Counter |  |
| +2.5 Volts monitor |  |
| +5 Volts monitor |  |
| _ROLL_ROT | 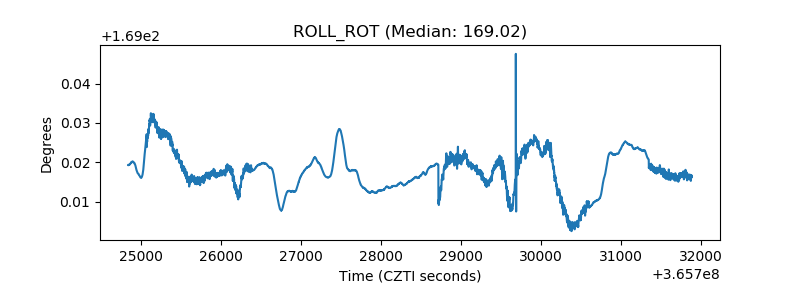 |
| _Roll_DEC | 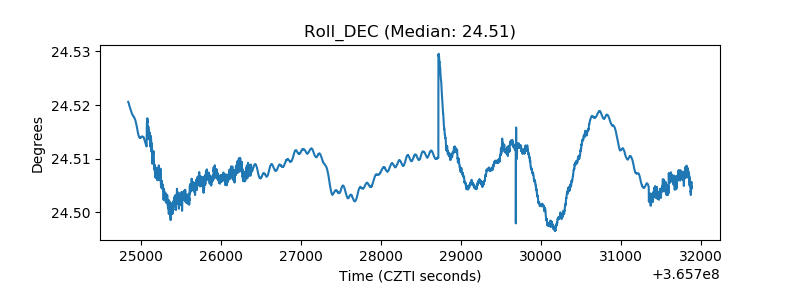 |
| _Roll_RA |  |
| Veto Counter | 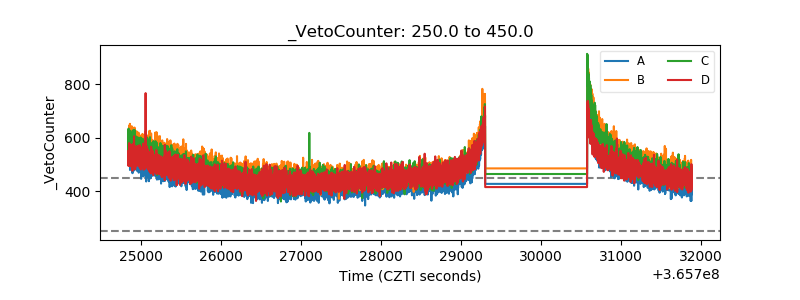 |