| Param | Original file | Final file |
|---|---|---|
| Filename | modeM0/AS1A10_123T01_9000004620_31631cztM0_level2.evt | modeM0/AS1A10_123T01_9000004620_31631cztM0_level2_quad_clean.evt |
| Size (bytes) | 725,973,120 | 70,568,640 |
| Size | 692.3 MB | 67.3 MB |
| Events in quadrant A | 3,413,404 | 435,888 |
| Events in quadrant B | 6,251,834 | 418,957 |
| Events in quadrant C | 4,823,298 | 412,816 |
| Events in quadrant D | 7,024,513 | 380,113 |
| Mode M0 | |||
|---|---|---|---|
| Quadrant | BADHDUFLAG | Total packets | Discarded packets |
| A | 0 | 14520 | 1 |
| B | 0 | 23530 | 1 |
| C | 0 | 18935 | 1 |
| D | 0 | 25885 | 1 |
| Mode M9 | |||
|---|---|---|---|
| Quadrant | BADHDUFLAG | Total packets | Discarded packets |
| A | 0 | 6 | 0 |
| B | 0 | 6 | 0 |
| C | 0 | 6 | 0 |
| D | 0 | 6 | 0 |
| Mode SS | |||
|---|---|---|---|
| Quadrant | BADHDUFLAG | Total packets | Discarded packets |
| A | 0 | 144 | 0 |
| B | 0 | 144 | 0 |
| C | 0 | 144 | 0 |
| D | 0 | 144 | 0 |
| Quadrant | Total seconds | Saturated seconds | Saturation percentage |
|---|---|---|---|
| A | 7006 | 138 | 1.969740% |
| B | 7007 | 502 | 7.164264% |
| C | 7007 | 416 | 5.936920% |
| D | 7007 | 579 | 8.263165% |
Noise dominated data is calculated using 1-second bins in cleaned event files. If a bin has >2000 counts, and if more than 50% of those come from <1% of pixels, then it is considered to be noise-dominated and hence unusable.
| Quadrant | # 1 sec bins | Bins with >0 counts | Bins with >2000 counts | High rate bins dominated by noise | Noise dominated (total time) | Noise dominated (detector-on time) | Marked lightcurve |
|---|---|---|---|---|---|---|---|
| A | 7641 | 7007 | 1 | 1 | 0.01% | 0.01% | 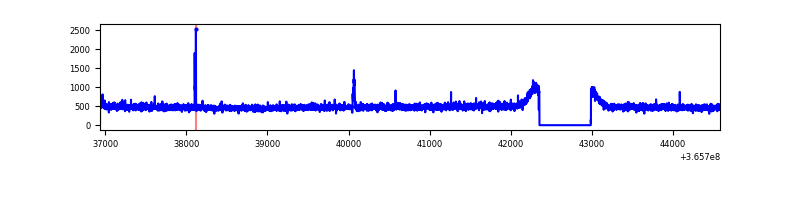 |
| B | 7642 | 7008 | 205 | 205 | 2.68% | 2.93% | 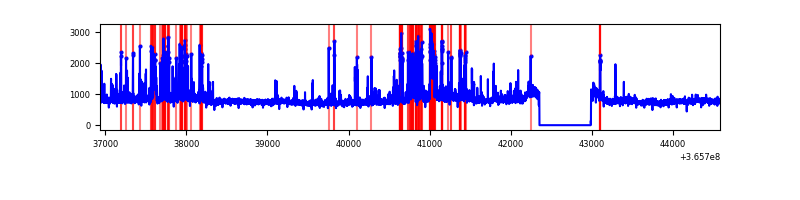 |
| C | 7642 | 7008 | 133 | 133 | 1.74% | 1.90% | 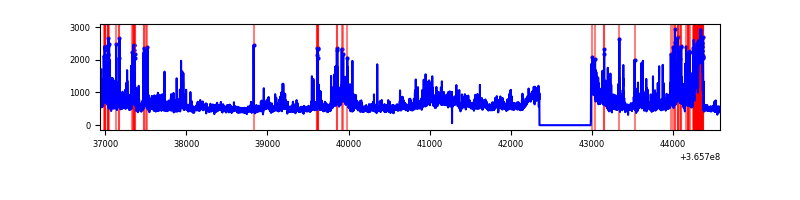 |
| D | 7642 | 7008 | 435 | 435 | 5.69% | 6.21% | 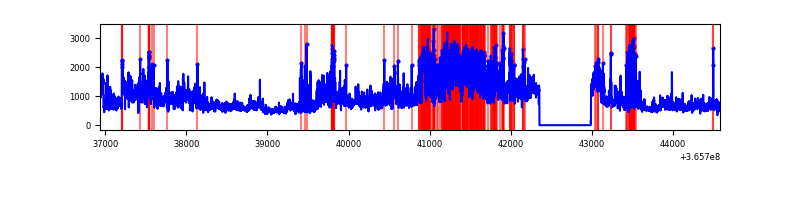 |
Top three noisy pixels from each quadrant. If the there are fewer than three noisy pixels in the level2.evt file, extra rows are filled as -1
| Pixel properties | Quadrant properties | ||||||
|---|---|---|---|---|---|---|---|
| Quadrant | DetID | PixID | Counts | Sigma | Mean | Median | Sigma |
| A | 14 | 218 | 16533 | 88.84 | 875 | 856 | 176.5 |
| A | 13 | 254 | 13068 | 69.21 | 875 | 856 | 176.5 |
| A | 15 | 174 | 10647 | 55.49 | 875 | 856 | 176.5 |
| B | 6 | 159 | 1966314 | 11950.19 | 855 | 833 | 164.5 |
| B | 10 | 245 | 540800 | 3283.02 | 855 | 833 | 164.5 |
| B | 5 | 172 | 197577 | 1196.21 | 855 | 833 | 164.5 |
| C | 3 | 233 | 1271104 | 6498.49 | 826 | 829 | 195.5 |
| C | 14 | 238 | 146074 | 743.05 | 826 | 829 | 195.5 |
| C | 0 | 10 | 63701 | 321.64 | 826 | 829 | 195.5 |
| D | 8 | 195 | 2347439 | 11756.16 | 821 | 799 | 199.6 |
| D | 11 | 176 | 720011 | 3603.1 | 821 | 799 | 199.6 |
| D | 12 | 218 | 305299 | 1525.48 | 821 | 799 | 199.6 |
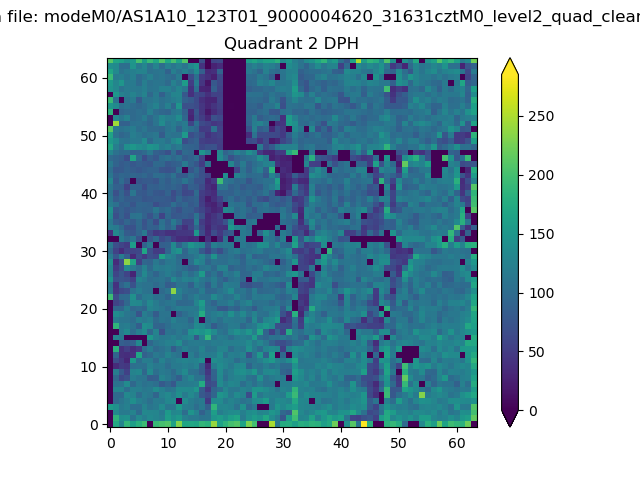
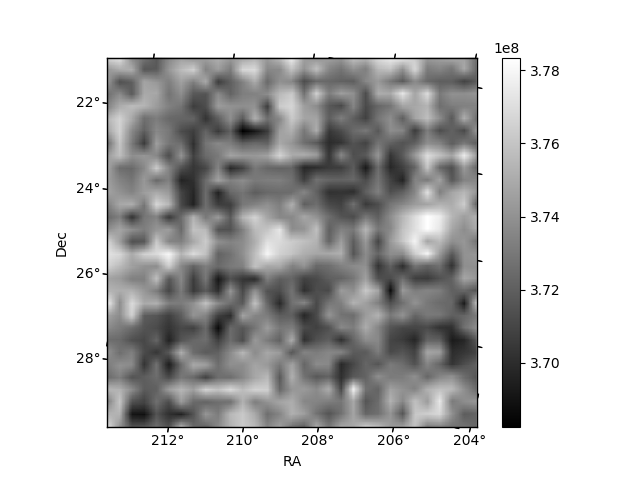
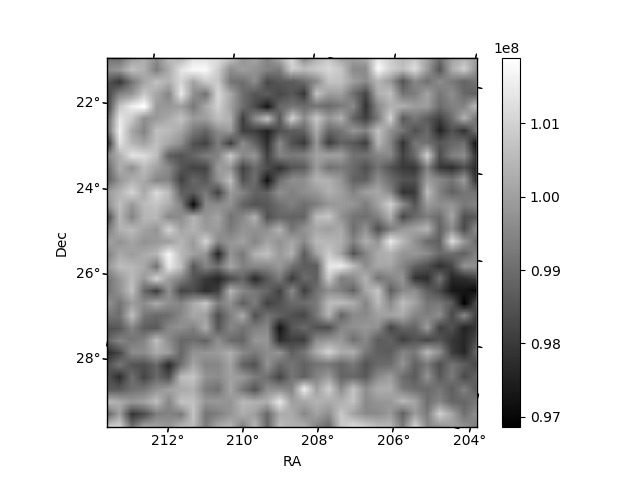
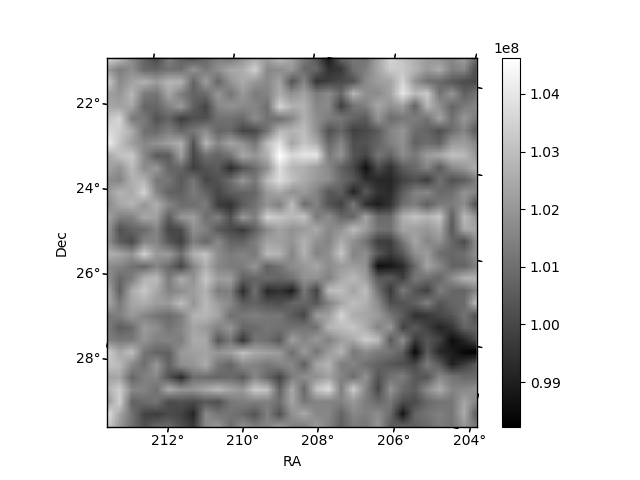
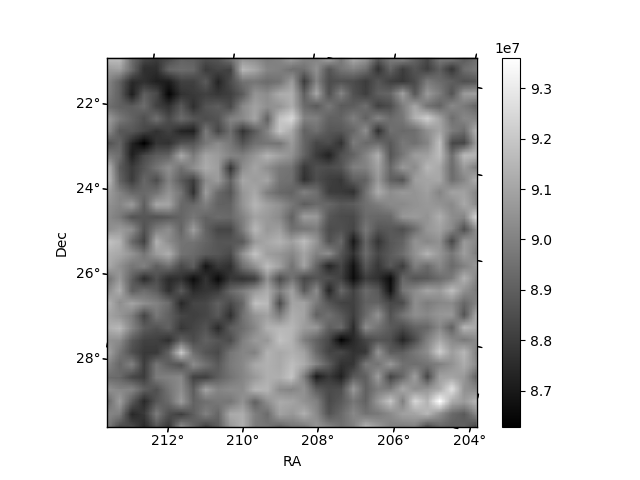
Histogram calculated using DETX and DETY for each event in the final _common_clean file
| Quadrant A | 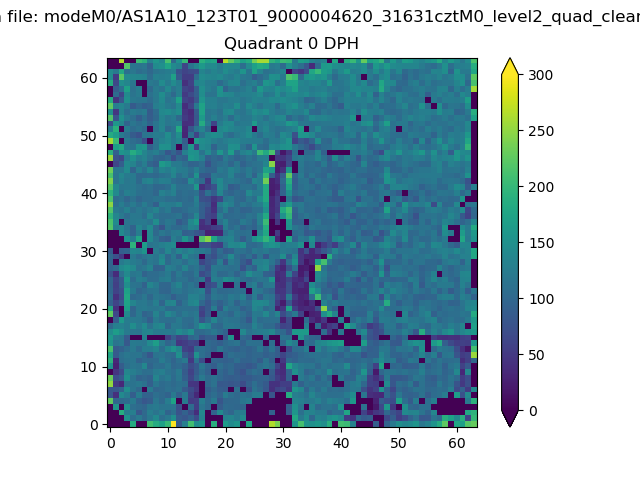 |
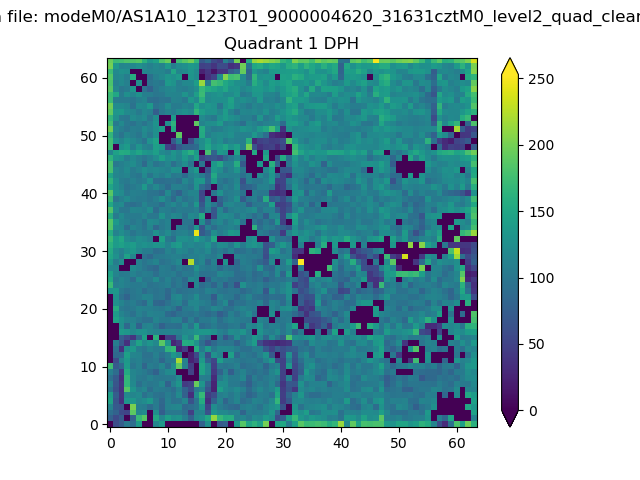 |
Quadrant B |
|---|---|---|---|
| Quadrant D | 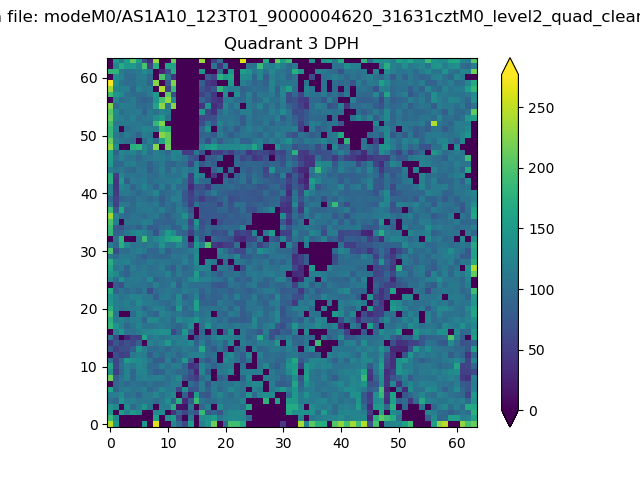 |
 |
Quadrant C |
| Plot type | Count rate plots | Images |
|---|---|---|
| Comparison with Poisson distribution Blue bars denote a histogram of data divided into 1 sec bins. Red curve is a Poisson curve with rate = median count rate of data. |
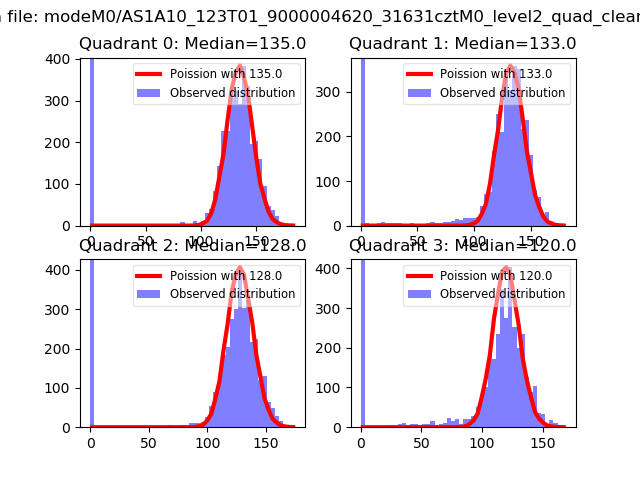 |
 |
| Quadrant-wise count rates Data is divided into 100 sec bins |
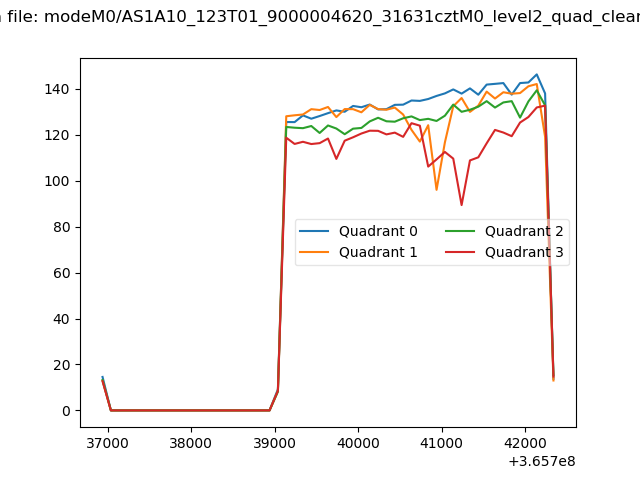 |
|
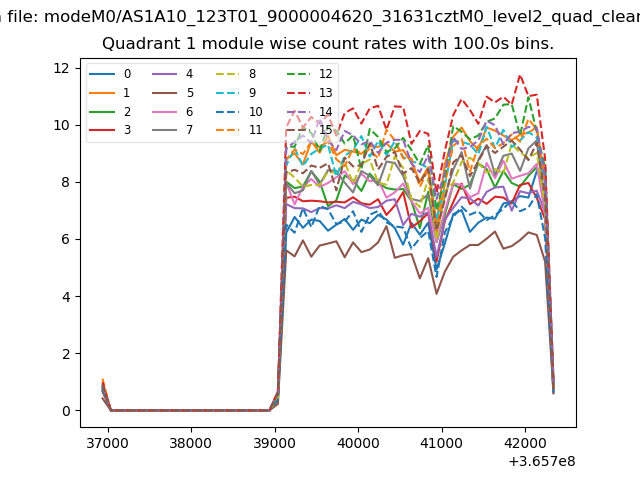
| Module-wise count rates for Quadrant A Data is divided into 100 sec bins |
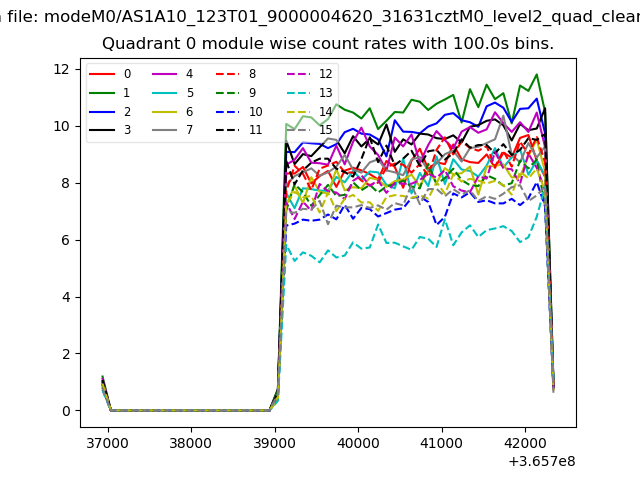 |
 |
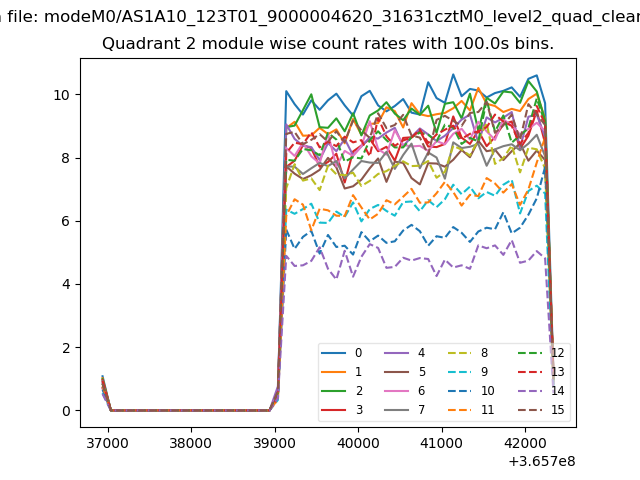
| Module-wise count rates for Quadrant B Data is divided into 100 sec bins |
 |
 |
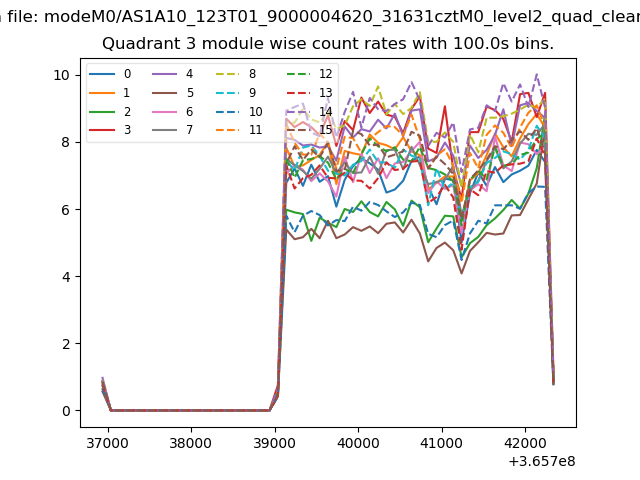
| Module-wise count rates for Quadrant C Data is divided into 100 sec bins |
 |
 |
| Module-wise count rates for Quadrant D Data is divided into 100 sec bins |
 |
 |
| Parameter | Plot |
|---|---|
| CZT HV Monitor | 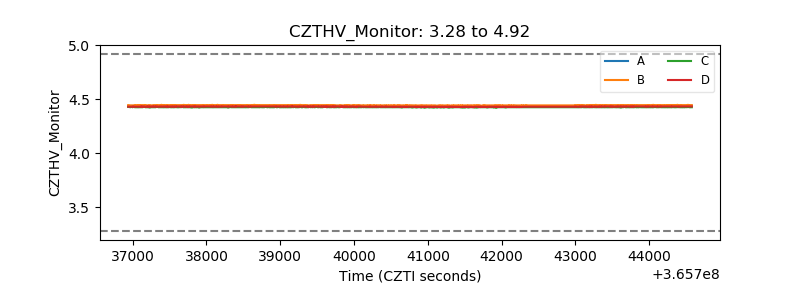 |
| D_VDD | 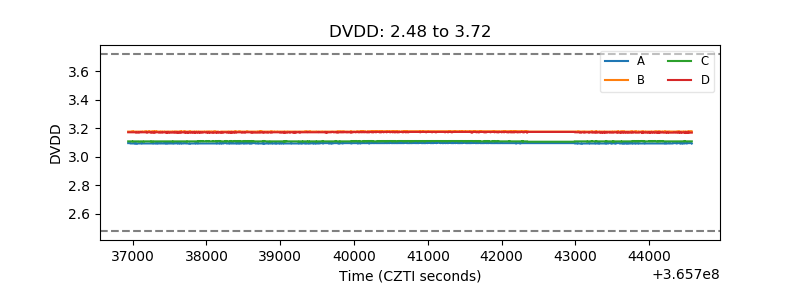 |
| Temperature 1 |  |
| Veto HV Monitor | 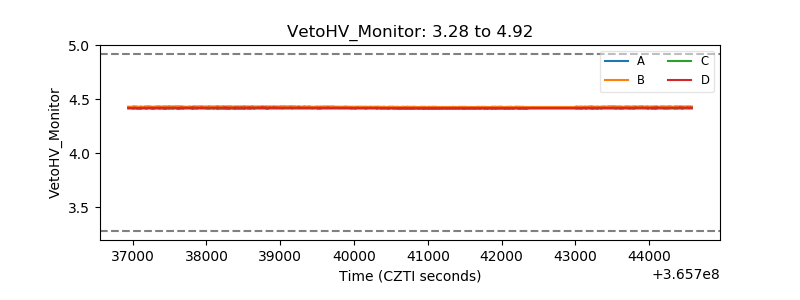 |
| Veto LLD | 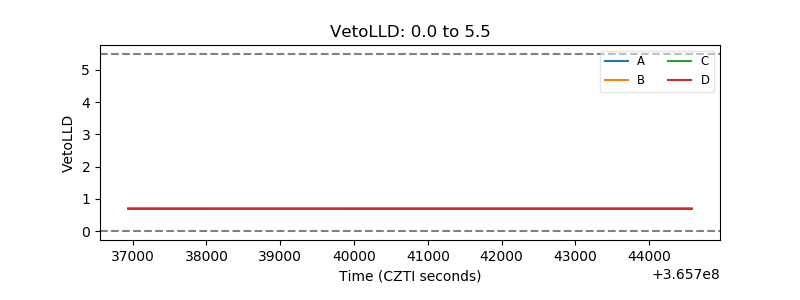 |
| Alpha Counter | 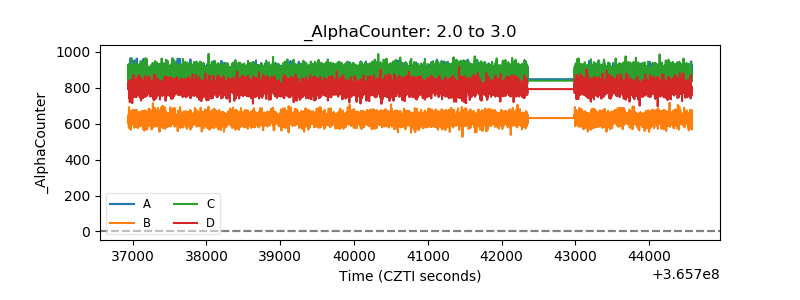 |
| _CPM_Rate | 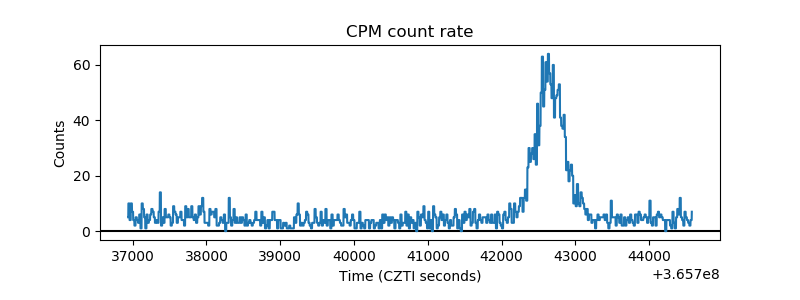 |
| CZT Counter | 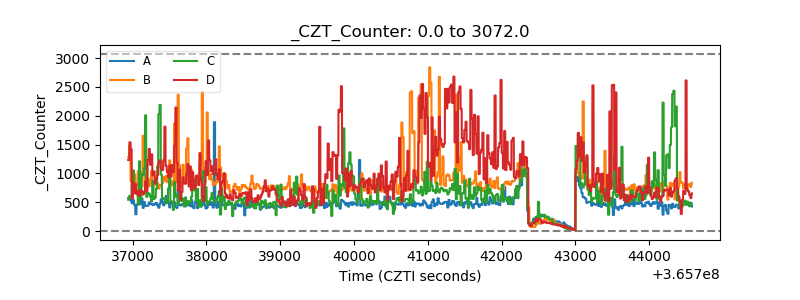 |
| +2.5 Volts monitor |  |
| +5 Volts monitor |  |
| _ROLL_ROT |  |
| _Roll_DEC | 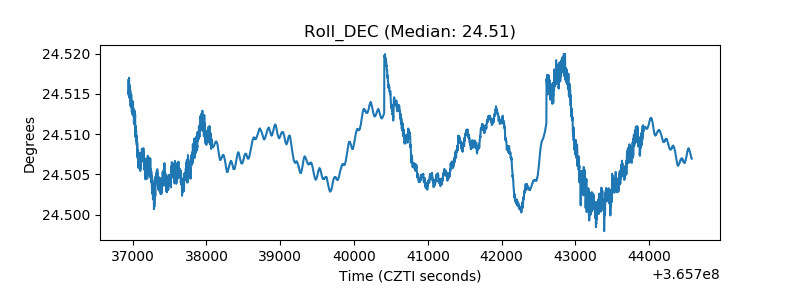 |
| _Roll_RA | 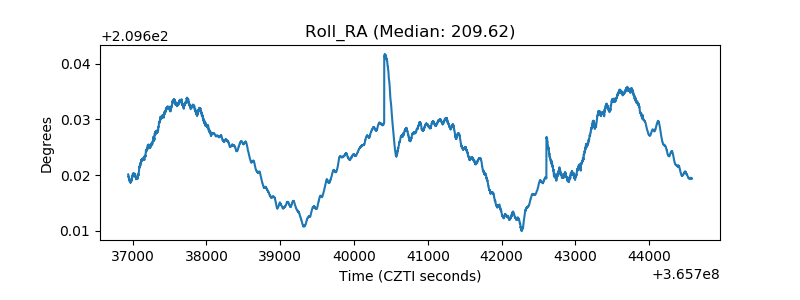 |
| Veto Counter | 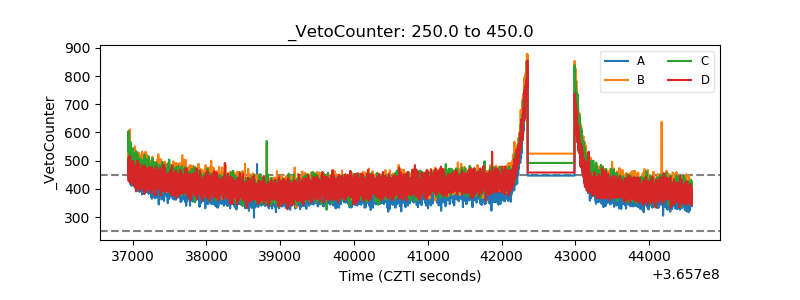 |