| Param | Original file | Final file |
|---|---|---|
| Filename | modeM0/AS1A10_123T01_9000004620_31636cztM0_level2.evt | modeM0/AS1A10_123T01_9000004620_31636cztM0_level2_quad_clean.evt |
| Size (bytes) | 404,087,040 | 55,232,640 |
| Size | 385.4 MB | 52.7 MB |
| Events in quadrant A | 1,751,942 | 379,201 |
| Events in quadrant B | 3,162,943 | 370,754 |
| Events in quadrant C | 2,053,354 | 362,169 |
| Events in quadrant D | 5,015,325 | 295,307 |
| Mode M0 | |||
|---|---|---|---|
| Quadrant | BADHDUFLAG | Total packets | Discarded packets |
| A | 0 | 7721 | 1 |
| B | 0 | 12024 | 1 |
| C | 0 | 8336 | 1 |
| D | 0 | 17529 | 1 |
| Mode SS | |||
|---|---|---|---|
| Quadrant | BADHDUFLAG | Total packets | Discarded packets |
| A | 0 | 76 | 0 |
| B | 0 | 76 | 0 |
| C | 0 | 76 | 0 |
| D | 0 | 76 | 0 |
| Quadrant | Total seconds | Saturated seconds | Saturation percentage |
|---|---|---|---|
| A | 3736 | 67 | 1.793362% |
| B | 3737 | 184 | 4.923736% |
| C | 3737 | 111 | 2.970297% |
| D | 3737 | 861 | 23.039872% |
Noise dominated data is calculated using 1-second bins in cleaned event files. If a bin has >2000 counts, and if more than 50% of those come from <1% of pixels, then it is considered to be noise-dominated and hence unusable.
| Quadrant | # 1 sec bins | Bins with >0 counts | Bins with >2000 counts | High rate bins dominated by noise | Noise dominated (total time) | Noise dominated (detector-on time) | Marked lightcurve |
|---|---|---|---|---|---|---|---|
| A | 3736 | 3736 | 5 | 5 | 0.13% | 0.13% | 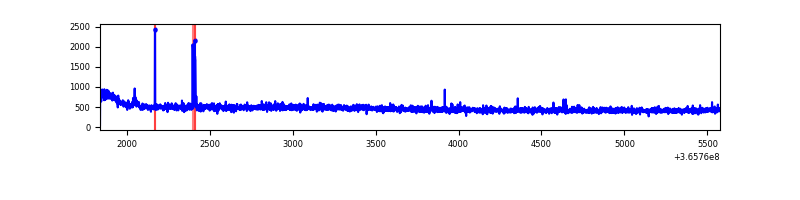 |
| B | 3737 | 3737 | 82 | 82 | 2.19% | 2.19% | 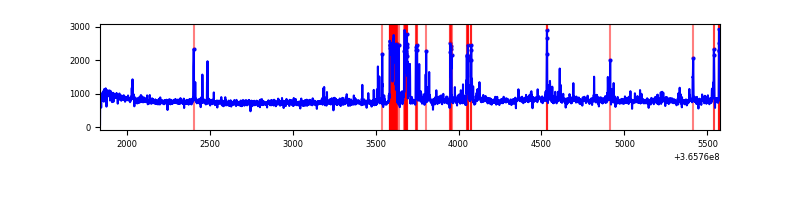 |
| C | 3737 | 3737 | 14 | 14 | 0.37% | 0.37% | 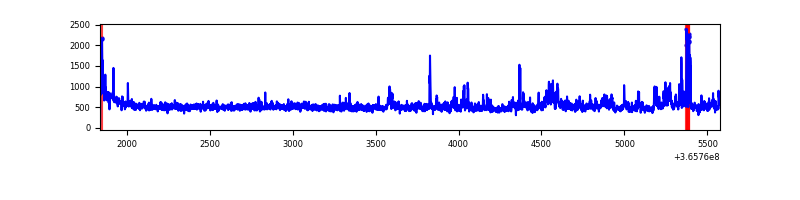 |
| D | 3737 | 3737 | 752 | 752 | 20.12% | 20.12% | 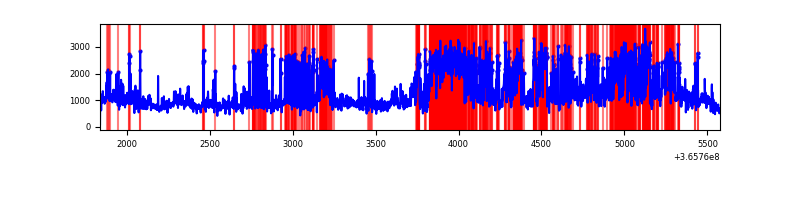 |
Top three noisy pixels from each quadrant. If the there are fewer than three noisy pixels in the level2.evt file, extra rows are filled as -1
| Pixel properties | Quadrant properties | ||||||
|---|---|---|---|---|---|---|---|
| Quadrant | DetID | PixID | Counts | Sigma | Mean | Median | Sigma |
| A | 15 | 174 | 27166 | 293.2 | 446 | 435 | 91.2 |
| A | 13 | 254 | 7426 | 76.68 | 446 | 435 | 91.2 |
| A | 3 | 137 | 4404 | 43.53 | 446 | 435 | 91.2 |
| B | 6 | 159 | 1090182 | 12926.01 | 432 | 422 | 84.3 |
| B | 5 | 172 | 217702 | 2577.23 | 432 | 422 | 84.3 |
| B | 10 | 245 | 38790 | 455.1 | 432 | 422 | 84.3 |
| C | 3 | 233 | 229306 | 2273.8 | 420 | 423 | 100.7 |
| C | 14 | 238 | 89350 | 883.43 | 420 | 423 | 100.7 |
| C | 14 | 254 | 31257 | 306.32 | 420 | 423 | 100.7 |
| D | 8 | 195 | 1373222 | 14690.74 | 383 | 372 | 93.5 |
| D | 13 | 249 | 1125196 | 12036.64 | 383 | 372 | 93.5 |
| D | 11 | 176 | 850332 | 9095.34 | 383 | 372 | 93.5 |
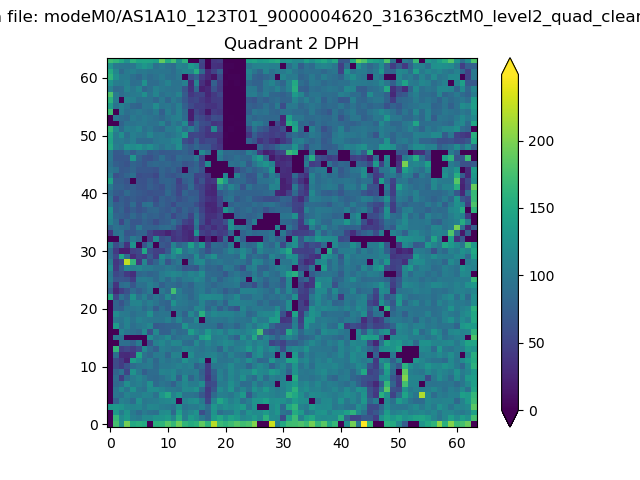
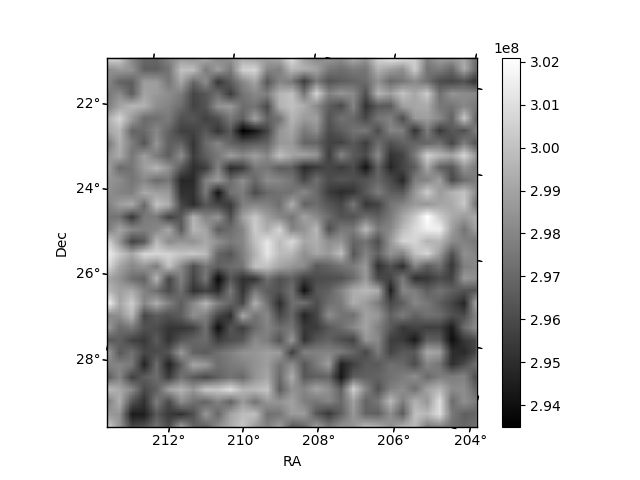
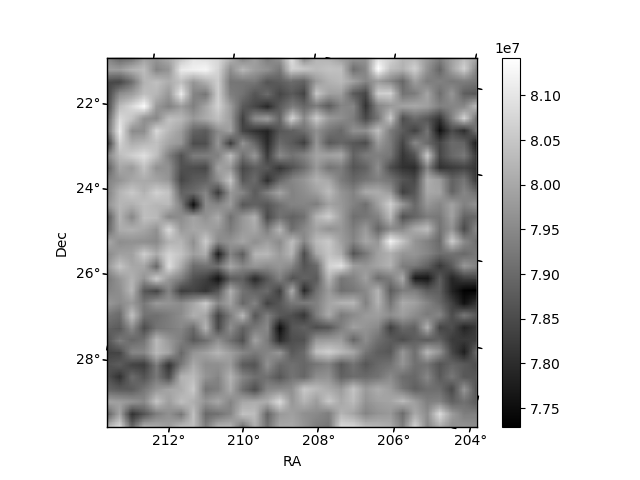
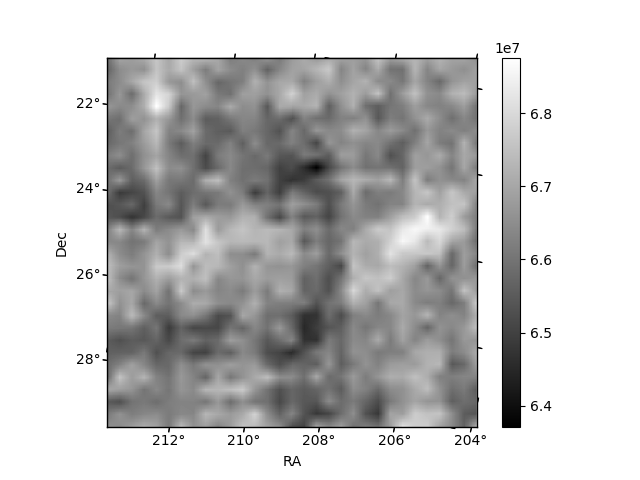
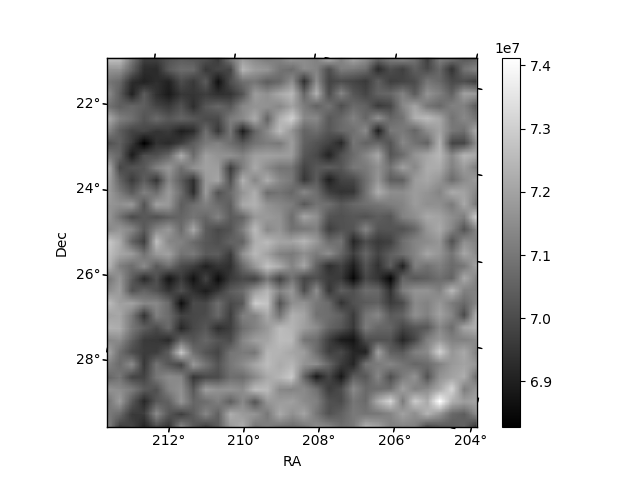
Histogram calculated using DETX and DETY for each event in the final _common_clean file
| Quadrant A | 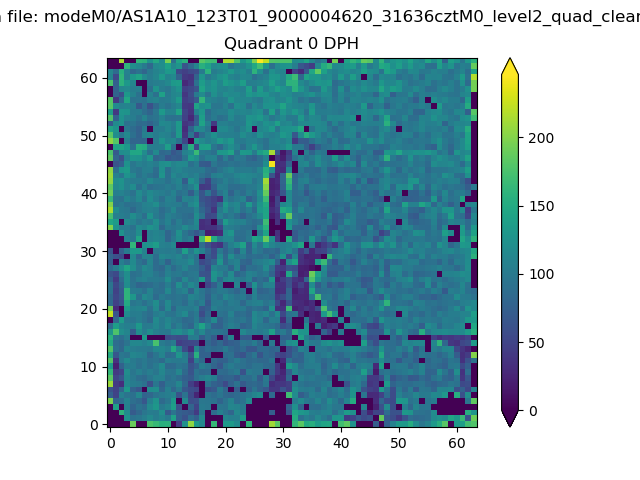 |
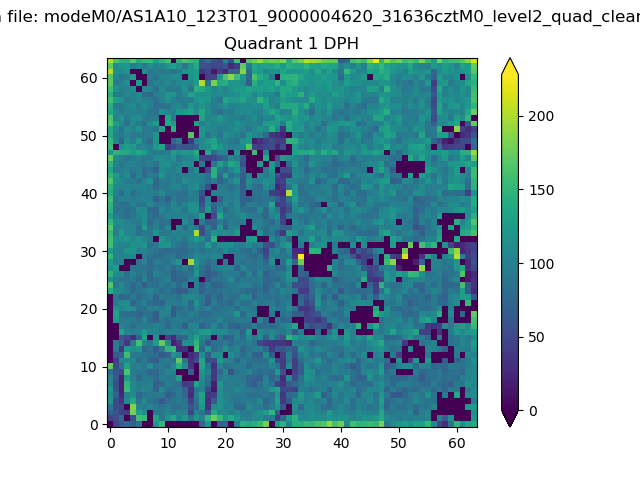 |
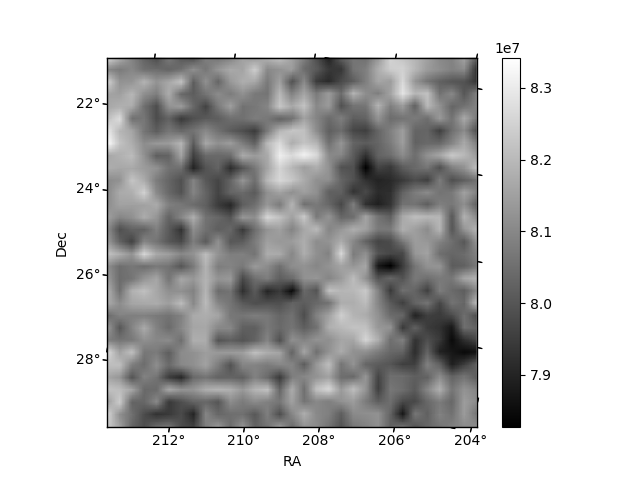
Quadrant B |
|---|---|---|---|
| Quadrant D | 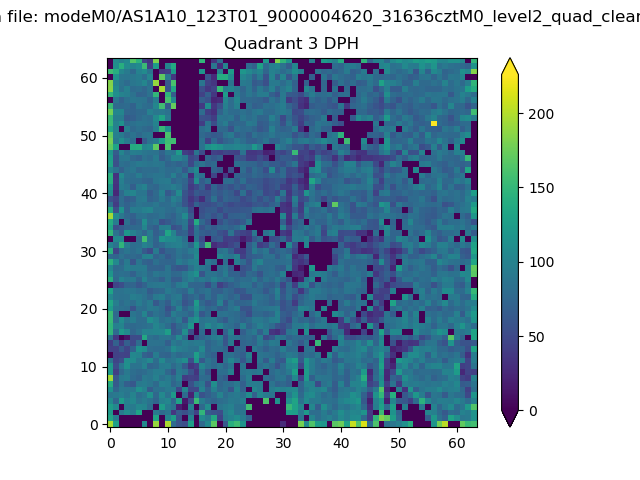 |
 |
Quadrant C |
| Plot type | Count rate plots | Images |
|---|---|---|
| Comparison with Poisson distribution Blue bars denote a histogram of data divided into 1 sec bins. Red curve is a Poisson curve with rate = median count rate of data. |
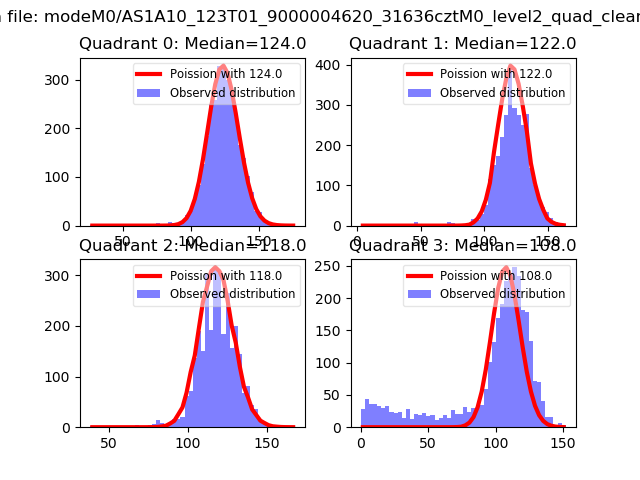 |
 |
| Quadrant-wise count rates Data is divided into 100 sec bins |
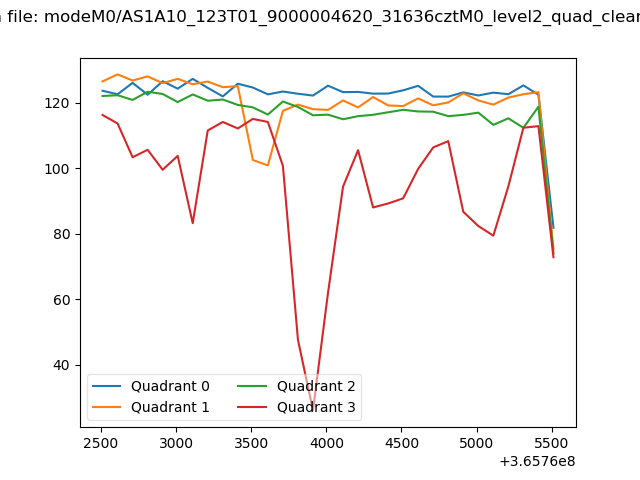 |
|
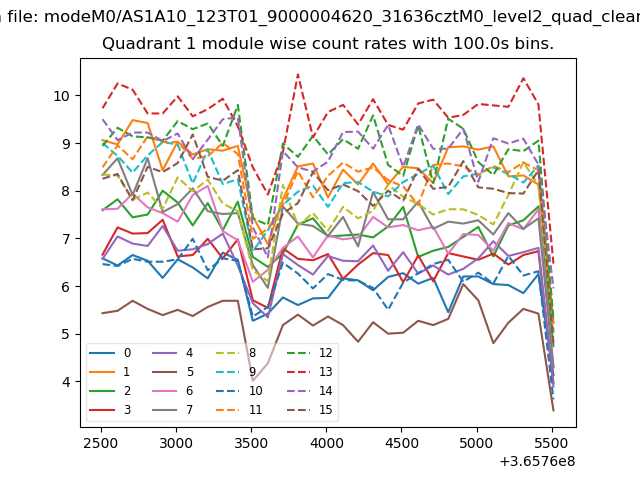
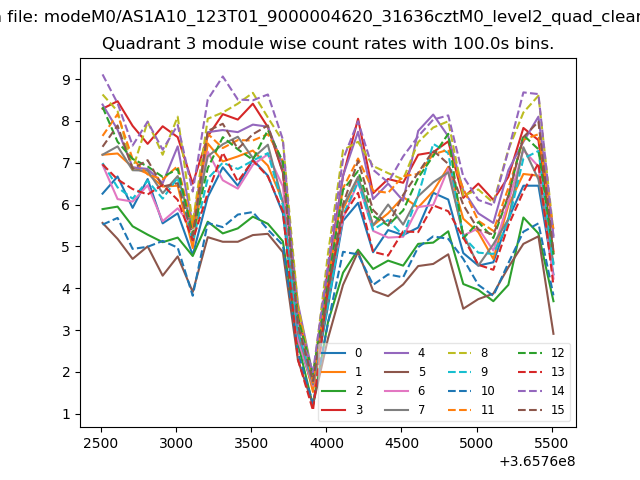
| Module-wise count rates for Quadrant A Data is divided into 100 sec bins |
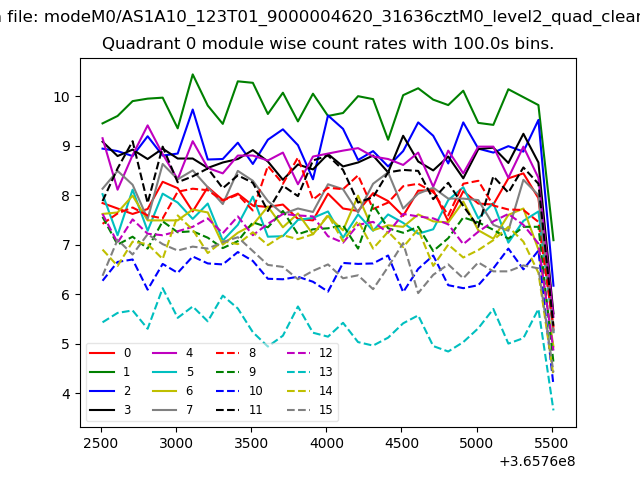 |
 |
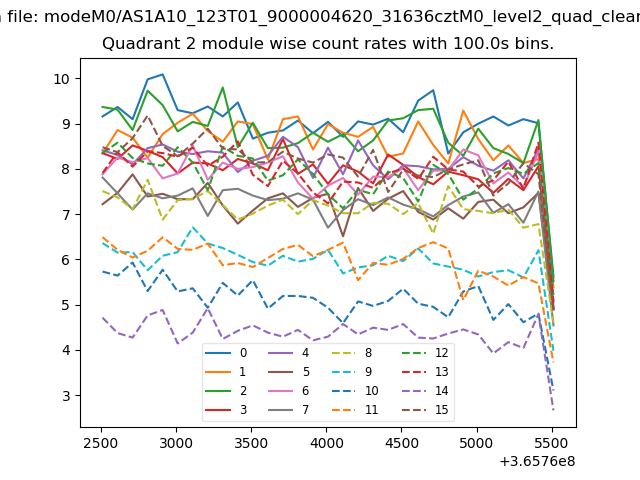
| Module-wise count rates for Quadrant B Data is divided into 100 sec bins |
 |
 |
| Module-wise count rates for Quadrant C Data is divided into 100 sec bins |
 |
 |
| Module-wise count rates for Quadrant D Data is divided into 100 sec bins |
 |
 |
| Parameter | Plot |
|---|---|
| CZT HV Monitor | 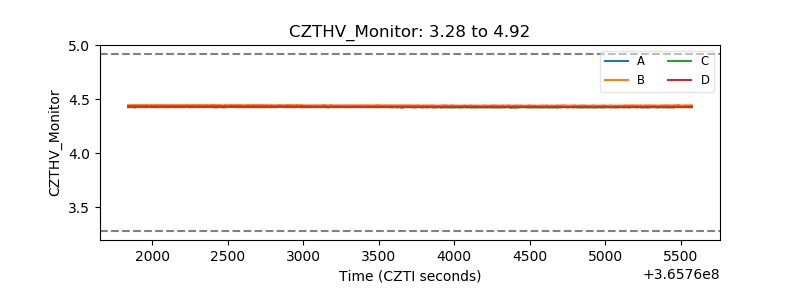 |
| D_VDD | 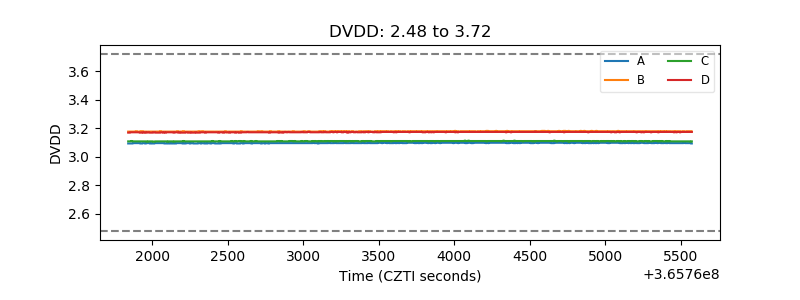 |
| Temperature 1 | 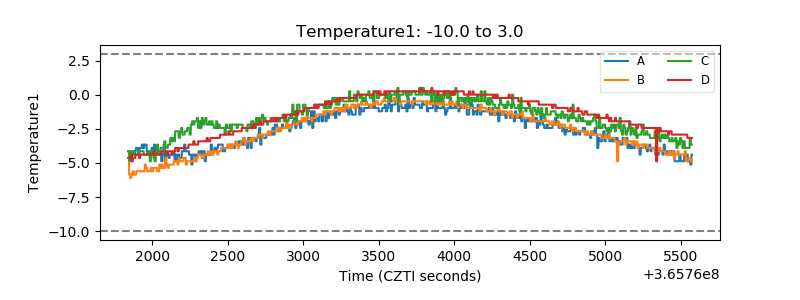 |
| Veto HV Monitor | 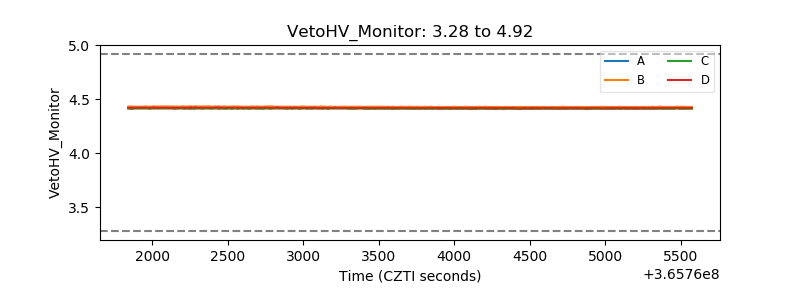 |
| Veto LLD | 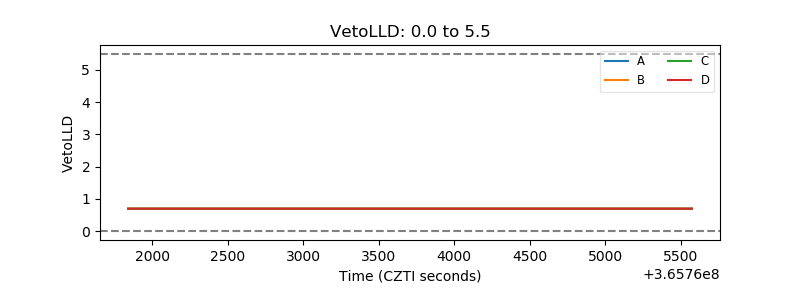 |
| Alpha Counter | 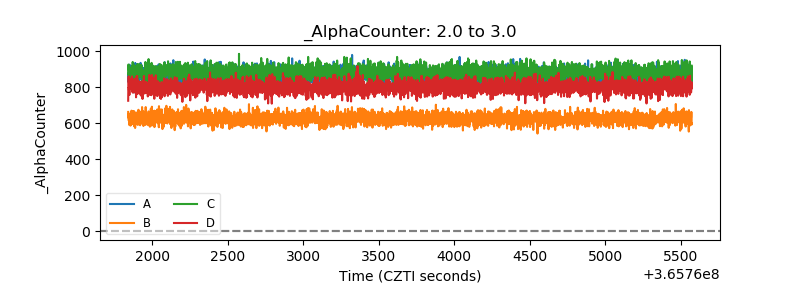 |
| _CPM_Rate | 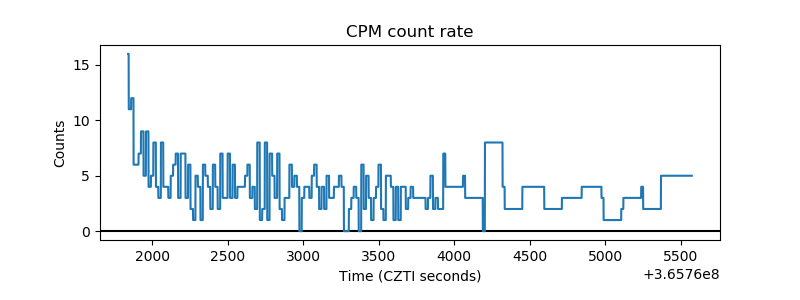 |
| CZT Counter | 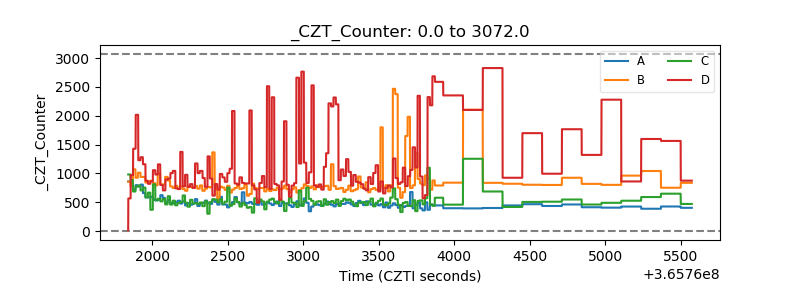 |
| +2.5 Volts monitor |  |
| +5 Volts monitor |  |
| _ROLL_ROT | 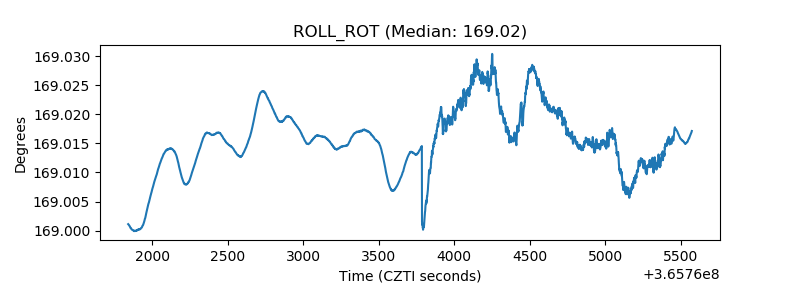 |
| _Roll_DEC | 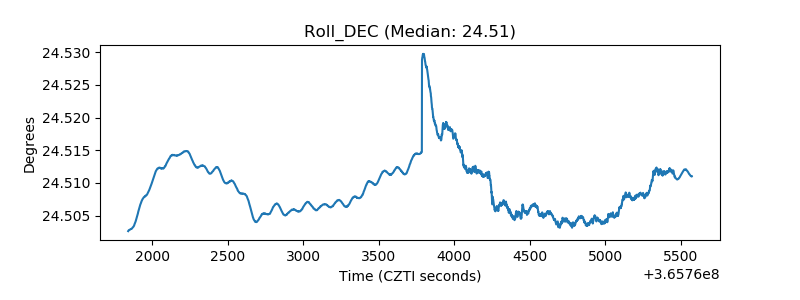 |
| _Roll_RA | 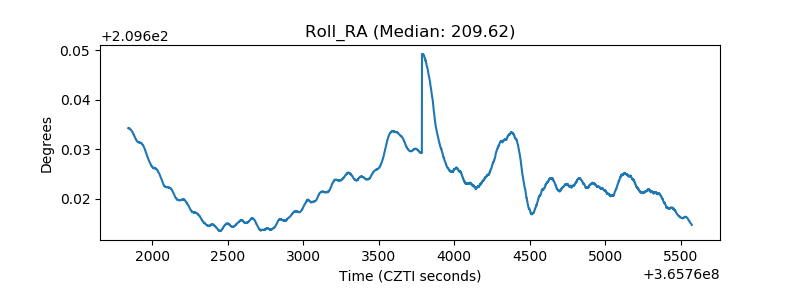 |
| Veto Counter | 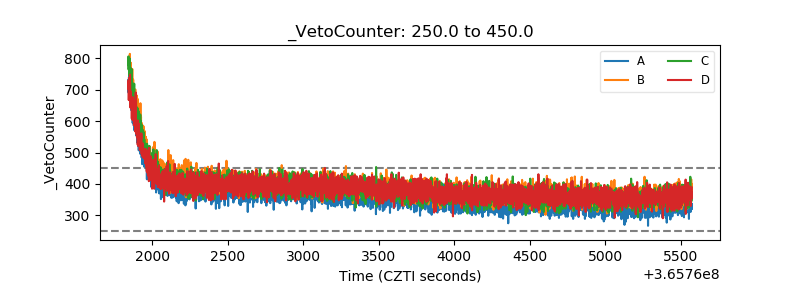 |