| Param | Original file | Final file |
|---|---|---|
| Filename | modeM0/AS1A10_123T01_9000004620_31637cztM0_level2.evt | modeM0/AS1A10_123T01_9000004620_31637cztM0_level2_quad_clean.evt |
| Size (bytes) | 1,604,684,160 | 201,816,000 |
| Size | 1.5 GB | 192.5 MB |
| Events in quadrant A | 7,253,682 | 1,356,221 |
| Events in quadrant B | 13,499,539 | 1,304,580 |
| Events in quadrant C | 8,816,346 | 1,287,955 |
| Events in quadrant D | 17,985,494 | 1,092,943 |
| Mode M0 | |||
|---|---|---|---|
| Quadrant | BADHDUFLAG | Total packets | Discarded packets |
| A | 0 | 31764 | 2 |
| B | 0 | 51382 | 2 |
| C | 0 | 35848 | 2 |
| D | 0 | 64754 | 2 |
| Mode M9 | |||
|---|---|---|---|
| Quadrant | BADHDUFLAG | Total packets | Discarded packets |
| A | 0 | 3 | 0 |
| B | 0 | 3 | 0 |
| C | 0 | 3 | 0 |
| D | 0 | 3 | 0 |
| Mode SS | |||
|---|---|---|---|
| Quadrant | BADHDUFLAG | Total packets | Discarded packets |
| A | 0 | 316 | 0 |
| B | 0 | 316 | 0 |
| C | 0 | 316 | 0 |
| D | 0 | 316 | 0 |
| Quadrant | Total seconds | Saturated seconds | Saturation percentage |
|---|---|---|---|
| A | 15493 | 389 | 2.510811% |
| B | 15493 | 1160 | 7.487252% |
| C | 15493 | 871 | 5.621894% |
| D | 15493 | 2908 | 18.769767% |
Noise dominated data is calculated using 1-second bins in cleaned event files. If a bin has >2000 counts, and if more than 50% of those come from <1% of pixels, then it is considered to be noise-dominated and hence unusable.
| Quadrant | # 1 sec bins | Bins with >0 counts | Bins with >2000 counts | High rate bins dominated by noise | Noise dominated (total time) | Noise dominated (detector-on time) | Marked lightcurve |
|---|---|---|---|---|---|---|---|
| A | 15848 | 15495 | 0 | 0 | 0.00% | 0.00% |  |
| B | 15848 | 15495 | 497 | 497 | 3.14% | 3.21% | 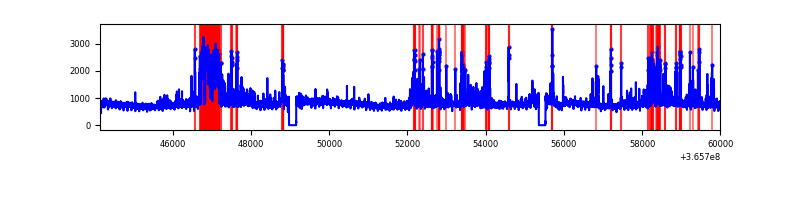 |
| C | 15848 | 15495 | 302 | 302 | 1.91% | 1.95% | 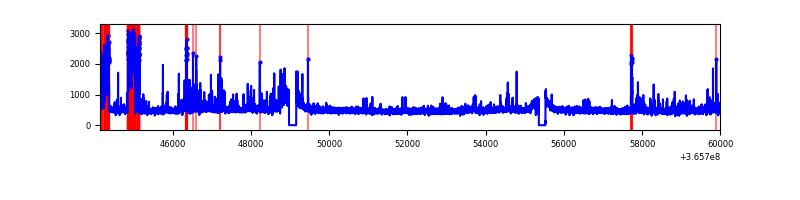 |
| D | 15848 | 15495 | 2553 | 2553 | 16.11% | 16.48% | 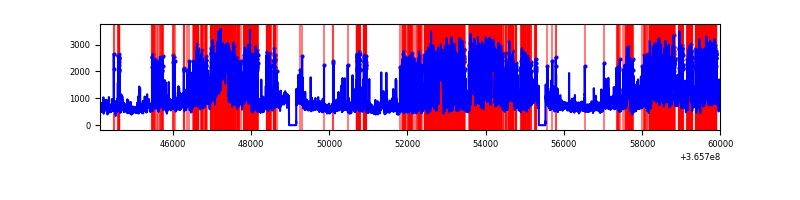 |
Top three noisy pixels from each quadrant. If the there are fewer than three noisy pixels in the level2.evt file, extra rows are filled as -1
| Pixel properties | Quadrant properties | ||||||
|---|---|---|---|---|---|---|---|
| Quadrant | DetID | PixID | Counts | Sigma | Mean | Median | Sigma |
| A | 13 | 254 | 29421 | 72.81 | 1875 | 1830 | 378.9 |
| A | 3 | 137 | 19094 | 45.56 | 1875 | 1830 | 378.9 |
| A | 0 | 226 | 15467 | 35.99 | 1875 | 1830 | 378.9 |
| B | 6 | 159 | 4247778 | 12296.67 | 1814 | 1766 | 345.3 |
| B | 5 | 172 | 1080314 | 3123.53 | 1814 | 1766 | 345.3 |
| B | 10 | 245 | 466085 | 1344.69 | 1814 | 1766 | 345.3 |
| C | 3 | 233 | 1379469 | 3328.78 | 1772 | 1783 | 413.9 |
| C | 14 | 238 | 312174 | 749.97 | 1772 | 1783 | 413.9 |
| C | 0 | 10 | 81416 | 192.41 | 1772 | 1783 | 413.9 |
| D | 11 | 176 | 4661744 | 11500.85 | 1675 | 1625 | 405.2 |
| D | 8 | 195 | 3725801 | 9191.01 | 1675 | 1625 | 405.2 |
| D | 13 | 249 | 2321943 | 5726.38 | 1675 | 1625 | 405.2 |
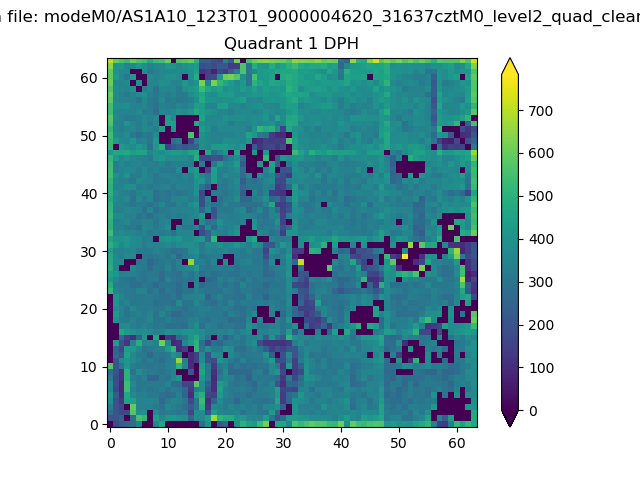
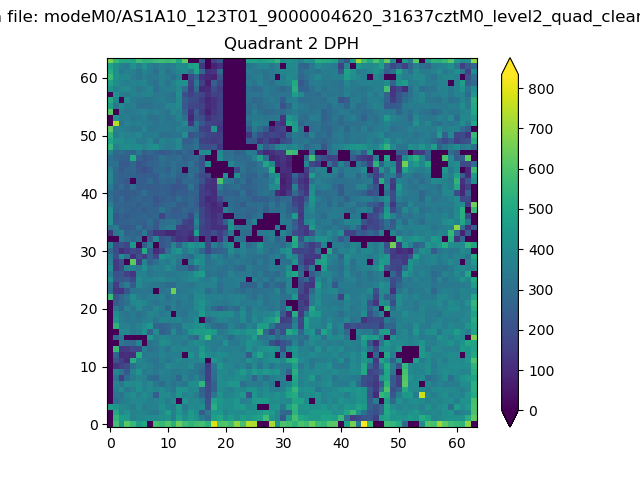
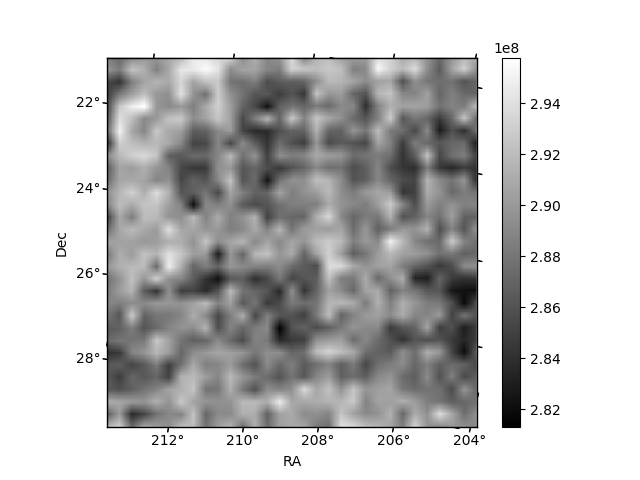
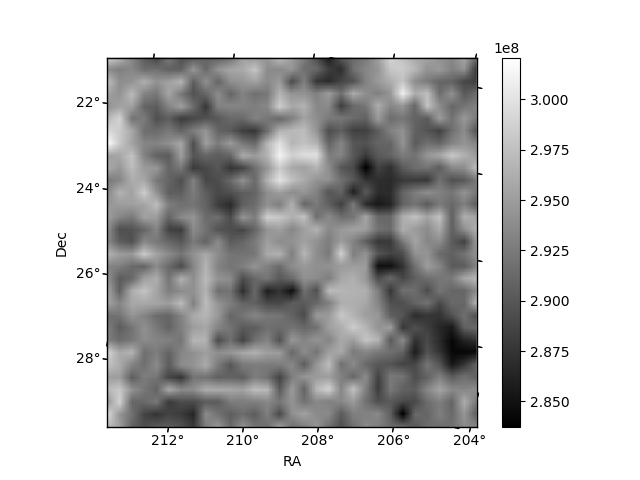
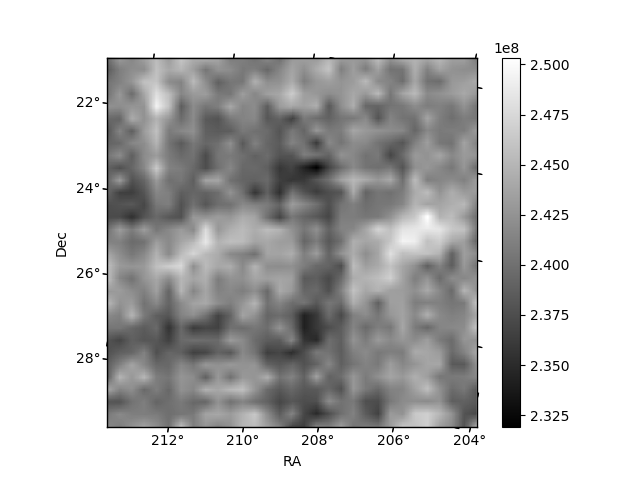
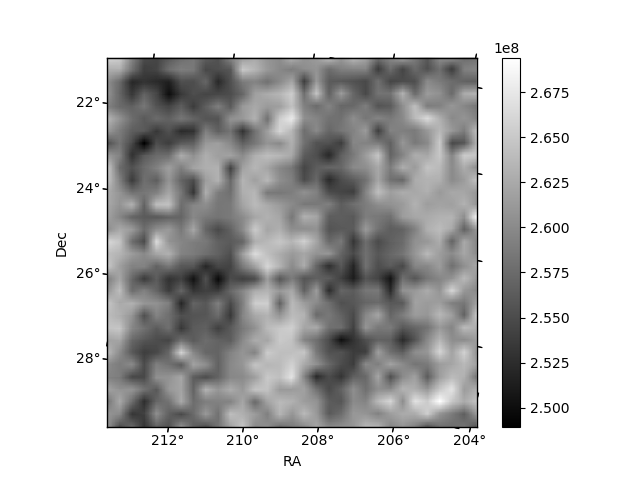
Histogram calculated using DETX and DETY for each event in the final _common_clean file
| Quadrant A | 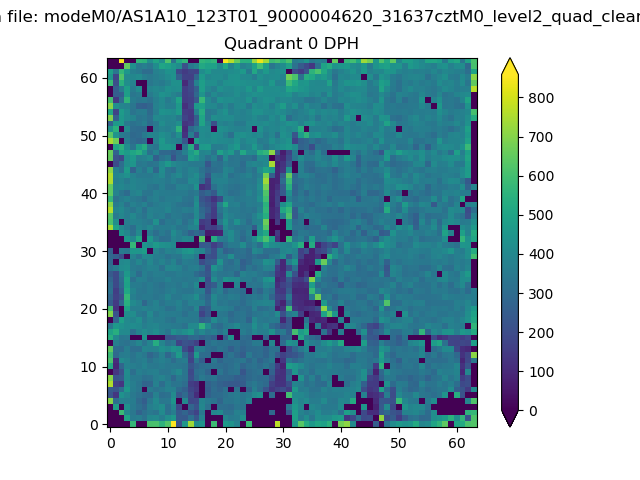 |
 |
Quadrant B |
|---|---|---|---|
| Quadrant D | 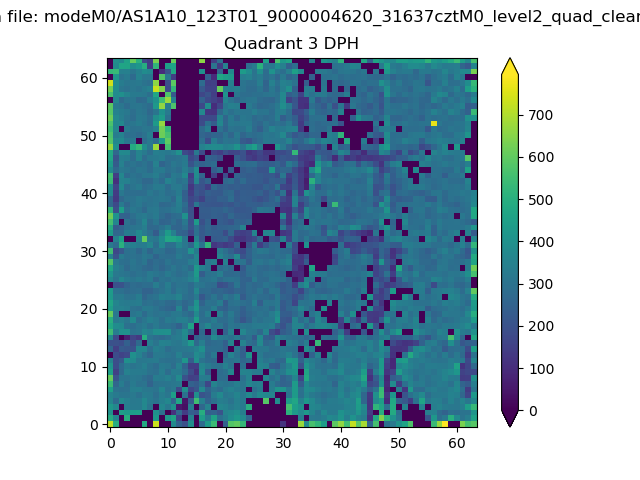 |
 |
Quadrant C |
| Plot type | Count rate plots | Images |
|---|---|---|
| Comparison with Poisson distribution Blue bars denote a histogram of data divided into 1 sec bins. Red curve is a Poisson curve with rate = median count rate of data. |
 |
 |
| Quadrant-wise count rates Data is divided into 100 sec bins |
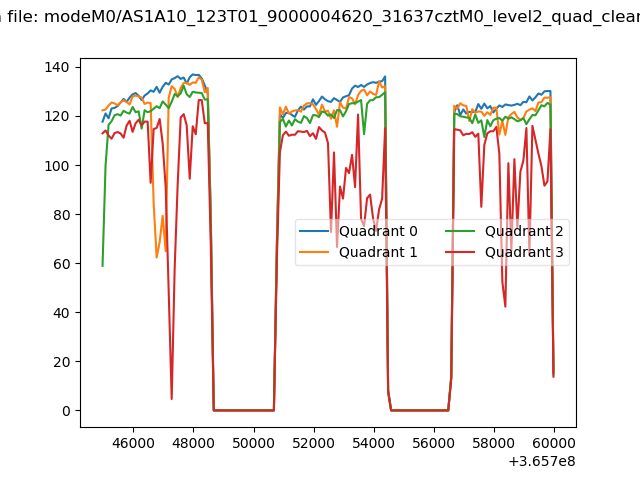 |
|
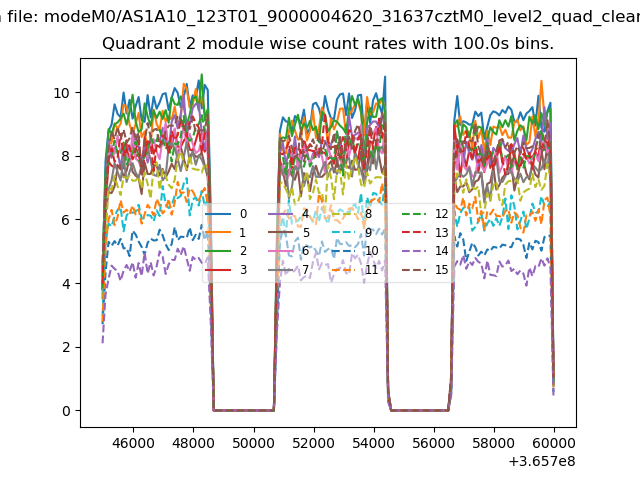
| Module-wise count rates for Quadrant A Data is divided into 100 sec bins |
 |
 |
| Module-wise count rates for Quadrant B Data is divided into 100 sec bins |
 |
 |
| Module-wise count rates for Quadrant C Data is divided into 100 sec bins |
 |
 |
| Module-wise count rates for Quadrant D Data is divided into 100 sec bins |
 |
 |
| Parameter | Plot |
|---|---|
| CZT HV Monitor |  |
| D_VDD | 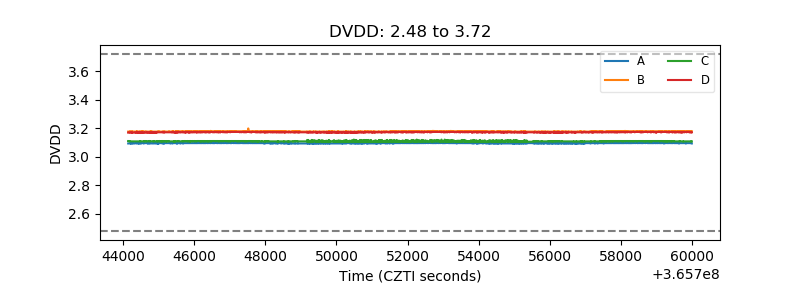 |
| Temperature 1 | 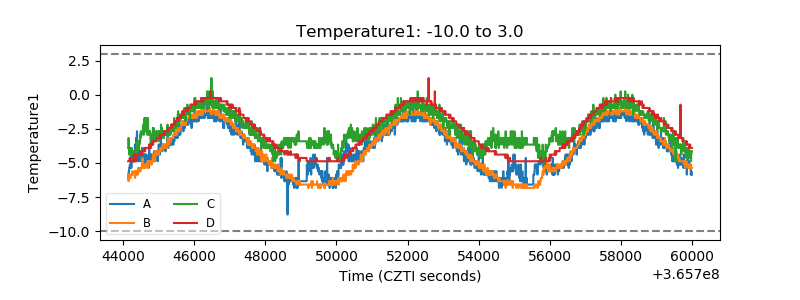 |
| Veto HV Monitor | 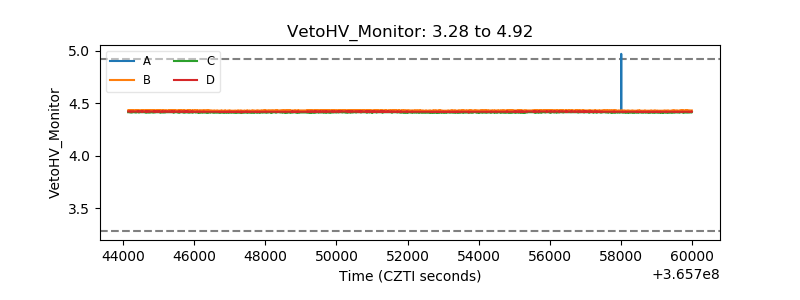 |
| Veto LLD | 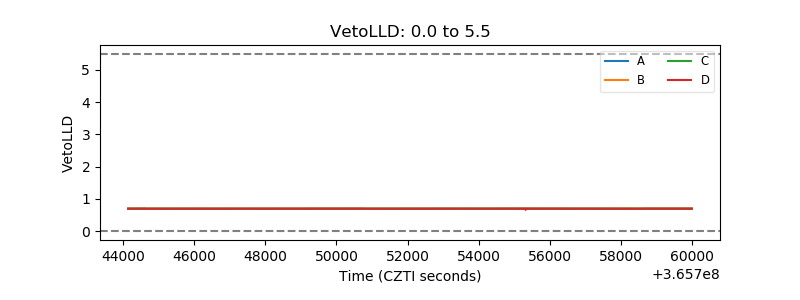 |
| Alpha Counter | 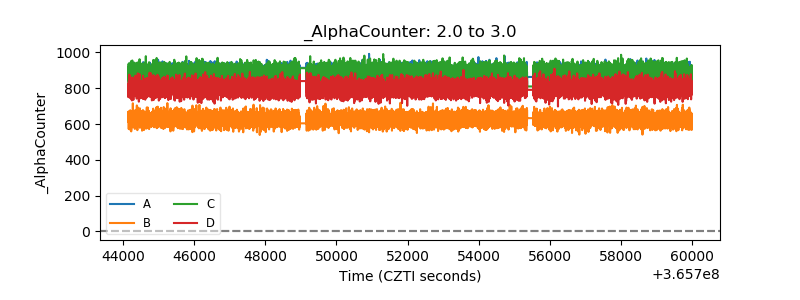 |
| _CPM_Rate | 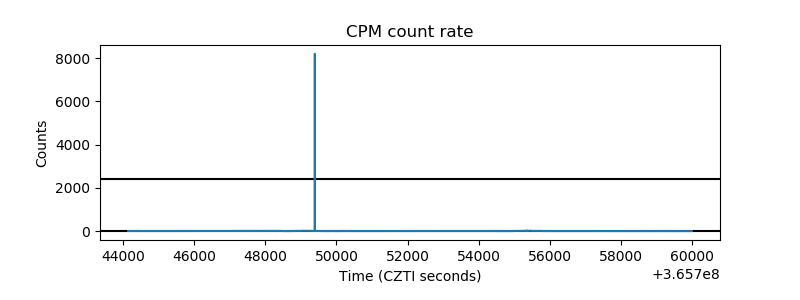 |
| CZT Counter | 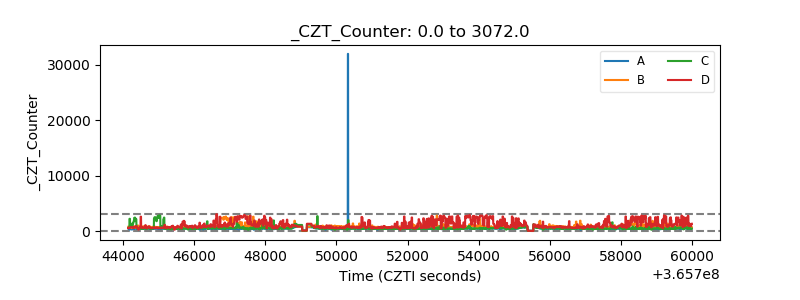 |
| +2.5 Volts monitor | 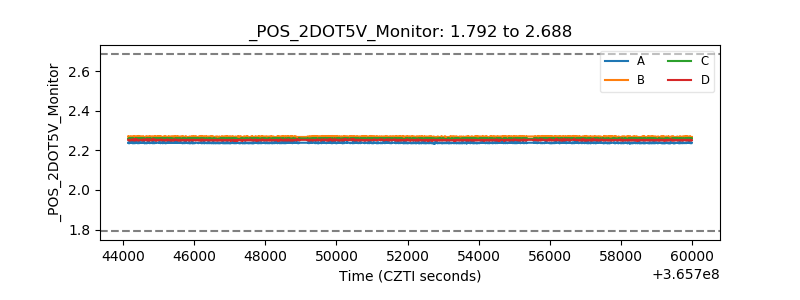 |
| +5 Volts monitor |  |
| _ROLL_ROT | 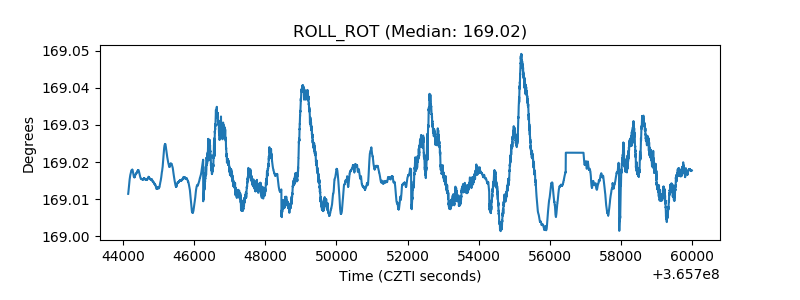 |
| _Roll_DEC | 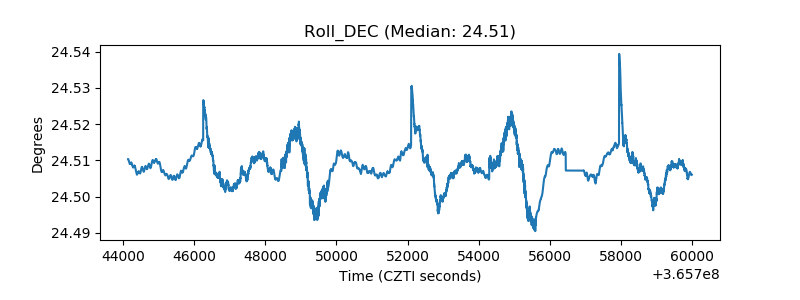 |
| _Roll_RA | 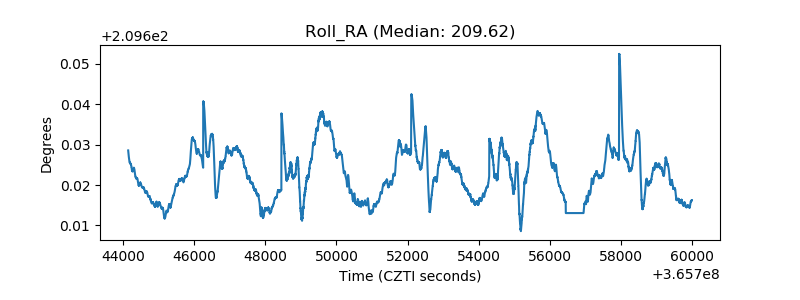 |
| Veto Counter |  |