| Param | Original file | Final file |
|---|---|---|
| Filename | modeM0/AS1C06_010T02_9000004618cztM0_level2.fits | modeM0/AS1C06_010T02_9000004618cztM0_level2_quad_clean.evt |
| Size (bytes) | 69,701,760 | 51,687,360 |
| Size | 66.5 MB | 49.3 MB |
| Events in quadrant A | 441,416 | 288,205 |
| Events in quadrant B | 418,912 | 289,515 |
| Events in quadrant C | 441,132 | 287,660 |
| Events in quadrant D | 374,354 | 263,610 |
| Mode M0 | |||
|---|---|---|---|
| Quadrant | BADHDUFLAG | Total packets | Discarded packets |
| A | 0 | 13483 | 0 |
| B | 0 | 20707 | 0 |
| C | 0 | 14485 | 0 |
| D | 0 | 17083 | 0 |
| Mode M9 | |||
|---|---|---|---|
| Quadrant | BADHDUFLAG | Total packets | Discarded packets |
| A | 0 | 19 | 0 |
| B | 0 | 19 | 0 |
| C | 0 | 19 | 0 |
| D | 0 | 19 | 0 |
| Mode SS | |||
|---|---|---|---|
| Quadrant | BADHDUFLAG | Total packets | Discarded packets |
| A | 0 | 126 | 0 |
| B | 0 | 126 | 0 |
| C | 0 | 122 | 0 |
| D | 0 | 126 | 0 |
| Quadrant | Total seconds | Saturated seconds | Saturation percentage |
|---|---|---|---|
| A | 6256 | 36 | 0.575448% |
| B | 6231 | 167 | 2.680148% |
| C | 6252 | 154 | 2.463212% |
| D | 6238 | 240 | 3.847387% |
Noise dominated data is calculated using 1-second bins in cleaned event files. If a bin has >2000 counts, and if more than 50% of those come from <1% of pixels, then it is considered to be noise-dominated and hence unusable.
| Quadrant | # 1 sec bins | Bins with >0 counts | Bins with >2000 counts | High rate bins dominated by noise | Noise dominated (total time) | Noise dominated (detector-on time) | Marked lightcurve |
|---|---|---|---|---|---|---|---|
| A | 13247 | 6292 | 0 | 0 | 0.00% | 0.00% |  |
| B | 13248 | 6264 | 0 | 0 | 0.00% | 0.00% | 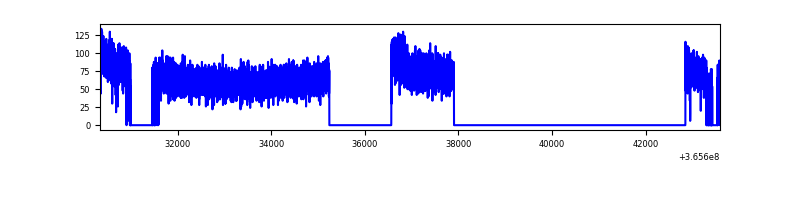 |
| C | 13248 | 6290 | 0 | 0 | 0.00% | 0.00% | 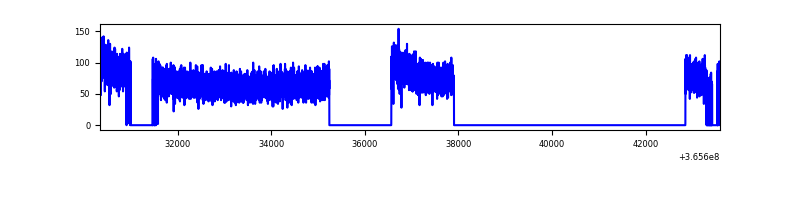 |
| D | 13247 | 6258 | 0 | 0 | 0.00% | 0.00% | 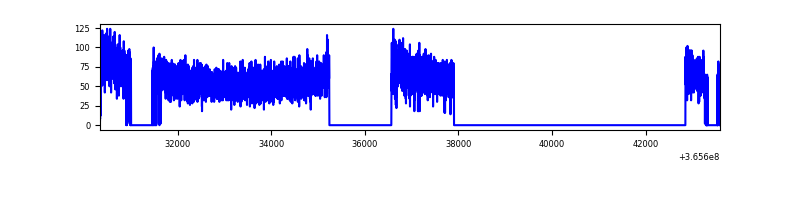 |
Top three noisy pixels from each quadrant. If the there are fewer than three noisy pixels in the level2.evt file, extra rows are filled as -1
| Pixel properties | Quadrant properties | ||||||
|---|---|---|---|---|---|---|---|
| Quadrant | DetID | PixID | Counts | Sigma | Mean | Median | Sigma |
| A | 0 | 29 | 420 | 10.62 | 115 | 109 | 29.3 |
| A | 9 | 19 | 339 | 7.86 | 115 | 109 | 29.3 |
| A | 0 | 30 | 334 | 7.68 | 115 | 109 | 29.3 |
| B | 2 | 9 | 315 | 8.79 | 111 | 107 | 23.7 |
| B | 3 | 80 | 286 | 7.56 | 111 | 107 | 23.7 |
| B | 13 | 245 | 276 | 7.14 | 111 | 107 | 23.7 |
| C | 1 | 81 | 359 | 8.1 | 116 | 111 | 30.6 |
| C | 1 | 80 | 341 | 7.51 | 116 | 111 | 30.6 |
| C | 3 | 202 | 327 | 7.05 | 116 | 111 | 30.6 |
| D | 6 | 231 | 291 | 6.44 | 107 | 98 | 30.0 |
| D | 10 | 189 | 288 | 6.34 | 107 | 98 | 30.0 |
| D | 10 | 113 | 285 | 6.24 | 107 | 98 | 30.0 |
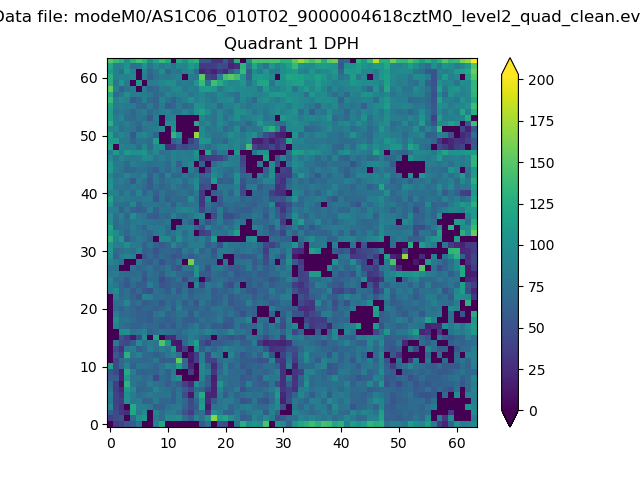
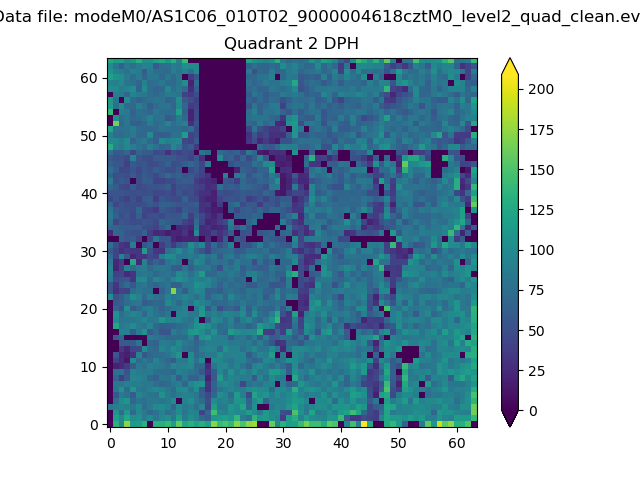
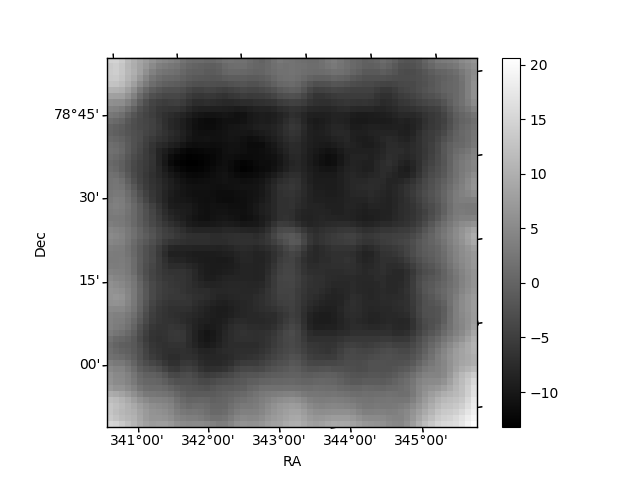
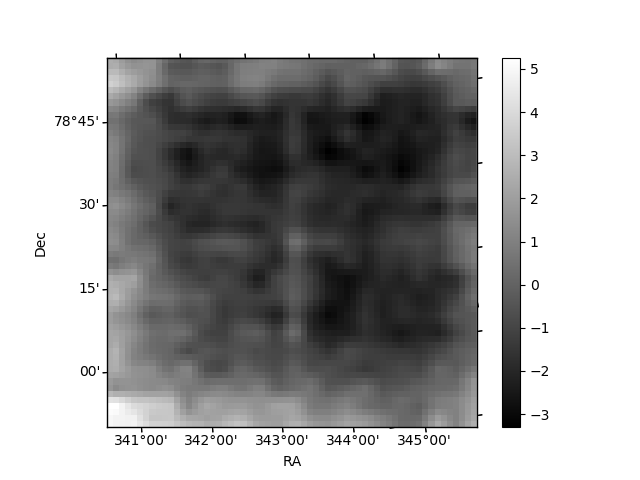
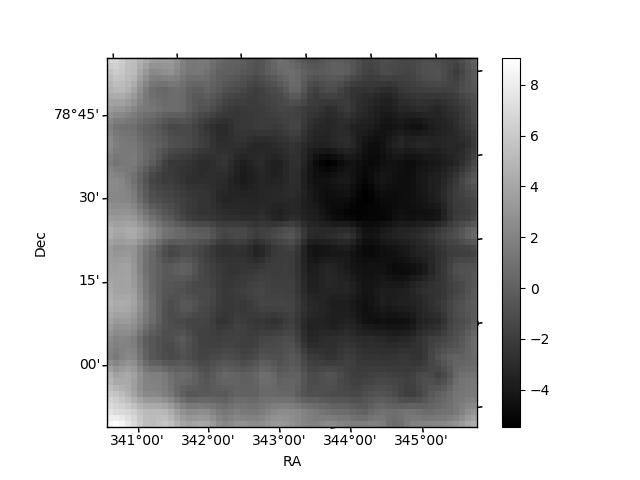
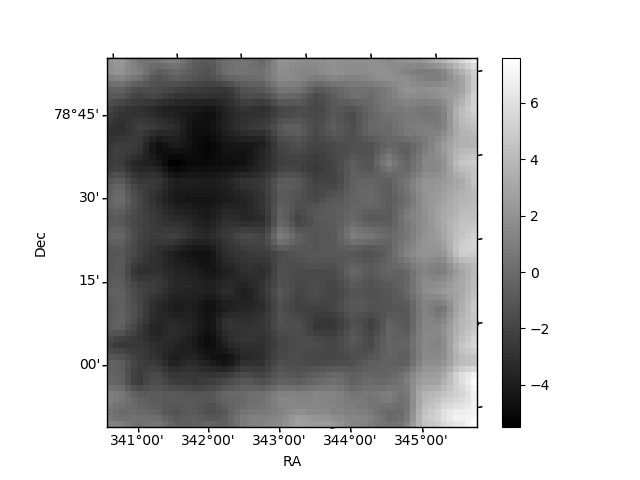
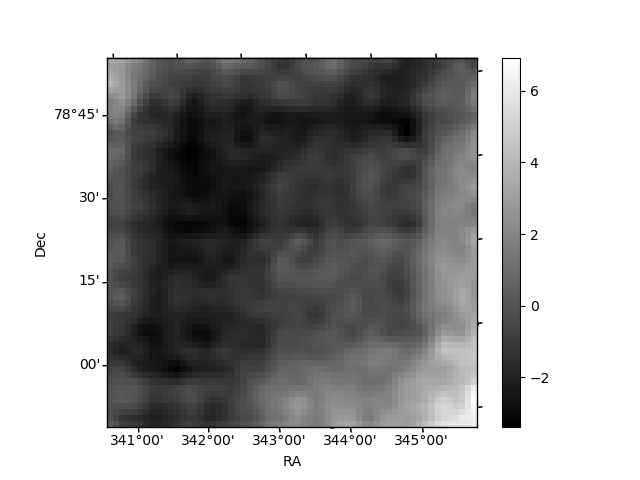
Histogram calculated using DETX and DETY for each event in the final _common_clean file
| Quadrant A | 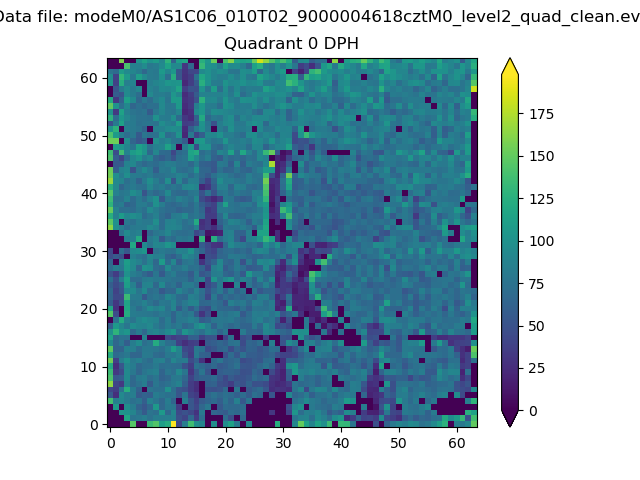 |
 |
Quadrant B |
|---|---|---|---|
| Quadrant D | 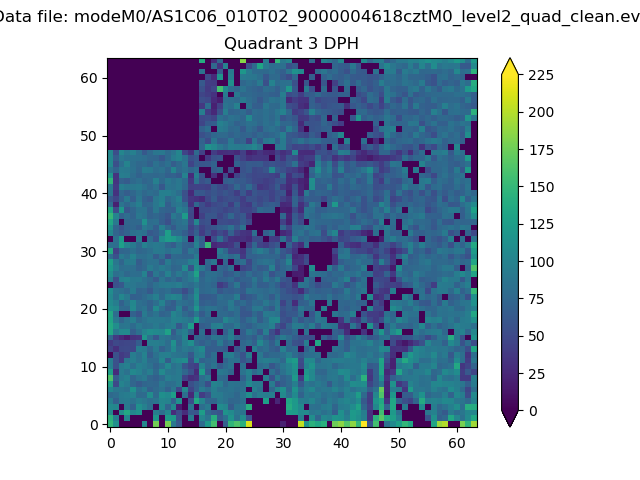 |
 |
Quadrant C |
| Plot type | Count rate plots | Images |
|---|---|---|
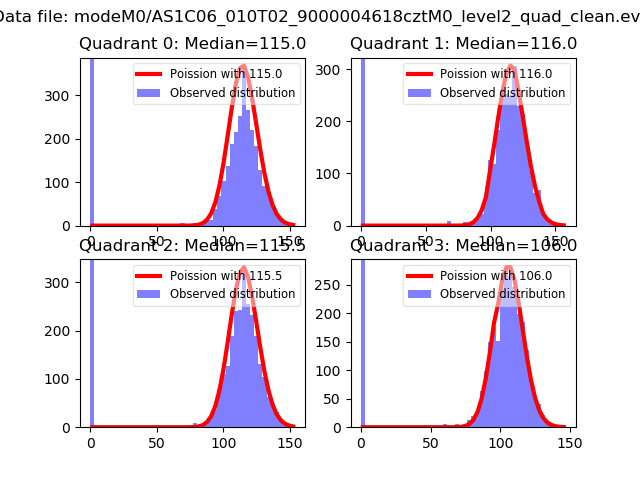
| Comparison with Poisson distribution Blue bars denote a histogram of data divided into 1 sec bins. Red curve is a Poisson curve with rate = median count rate of data. |
 |
 |
| Quadrant-wise count rates Data is divided into 100 sec bins |
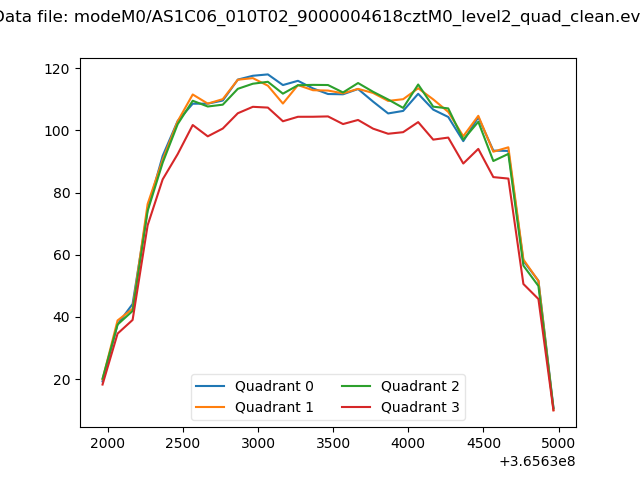 |
|
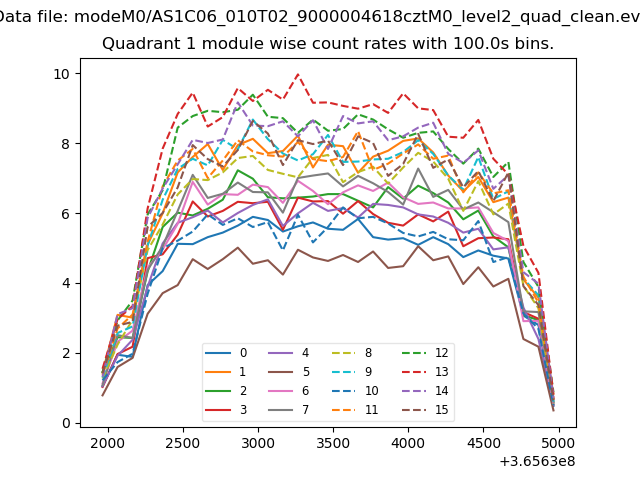
| Module-wise count rates for Quadrant A Data is divided into 100 sec bins |
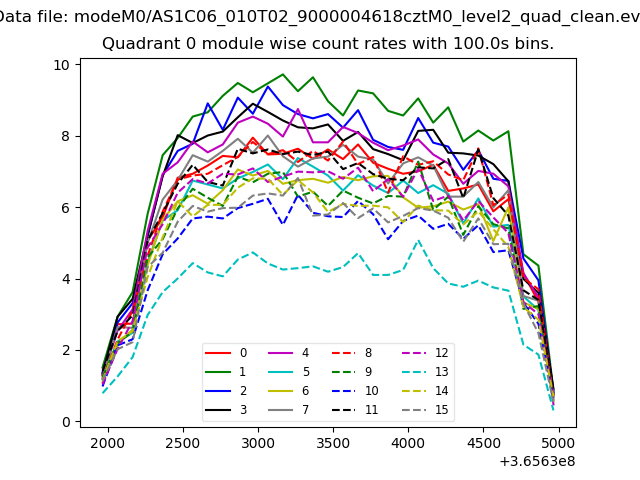 |
 |
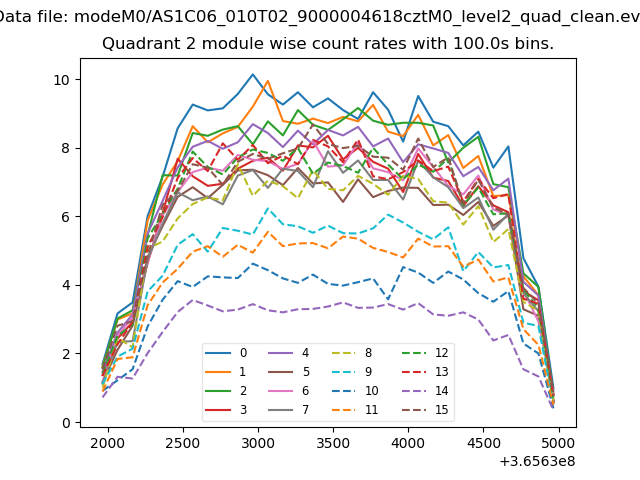
| Module-wise count rates for Quadrant B Data is divided into 100 sec bins |
 |
 |
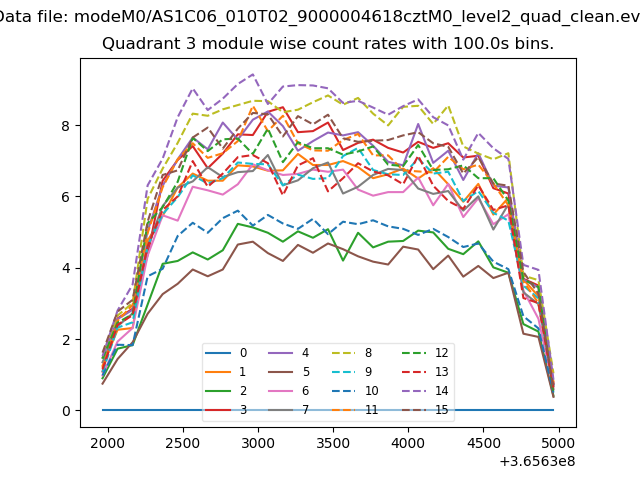
| Module-wise count rates for Quadrant C Data is divided into 100 sec bins |
 |
 |
| Module-wise count rates for Quadrant D Data is divided into 100 sec bins |
 |
 |
| Parameter | Plot |
|---|---|
| CZT HV Monitor | 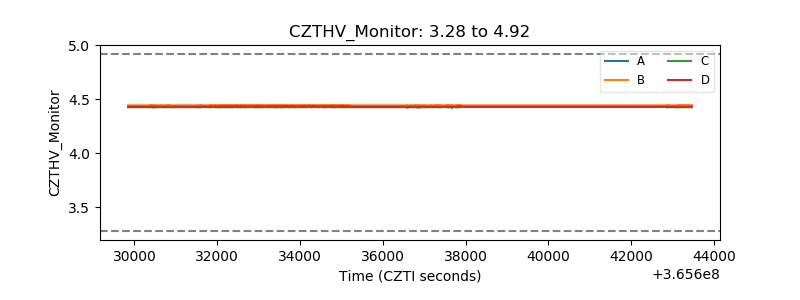 |
| D_VDD | 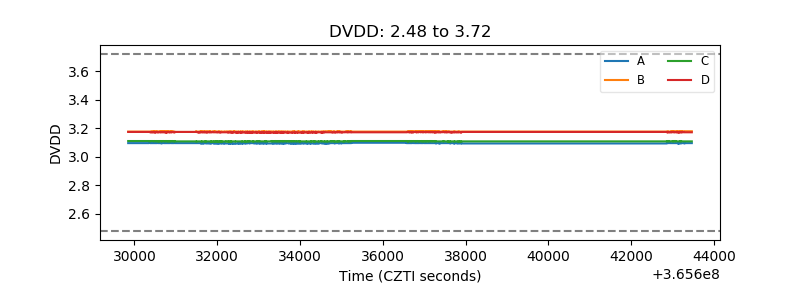 |
| Temperature 1 | 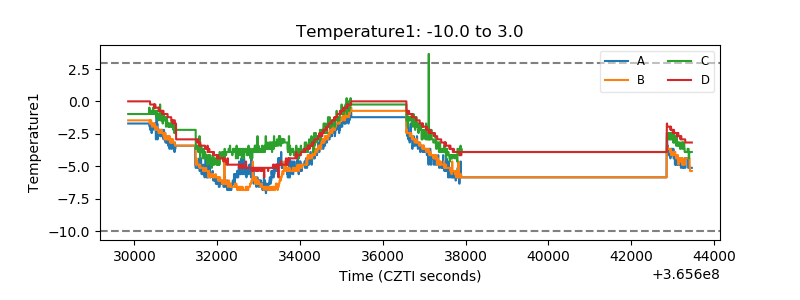 |
| Veto HV Monitor | 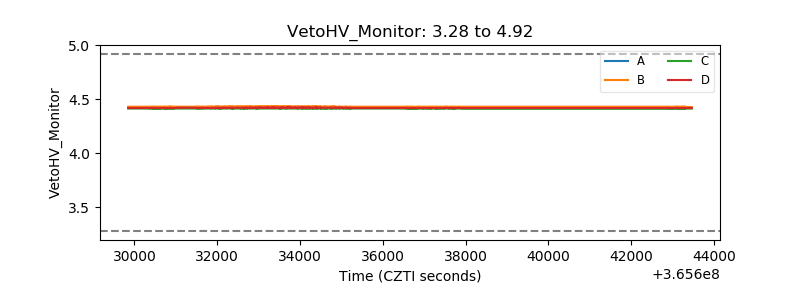 |
| Veto LLD | 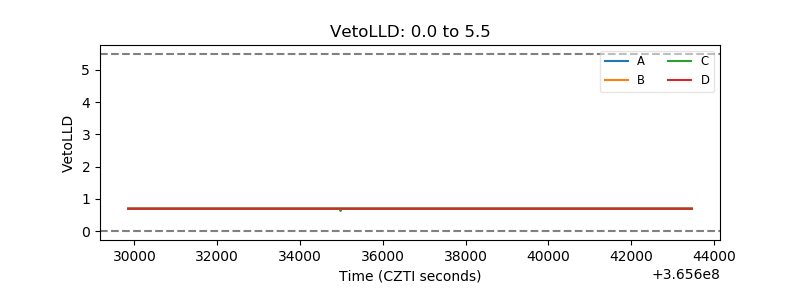 |
| Alpha Counter | 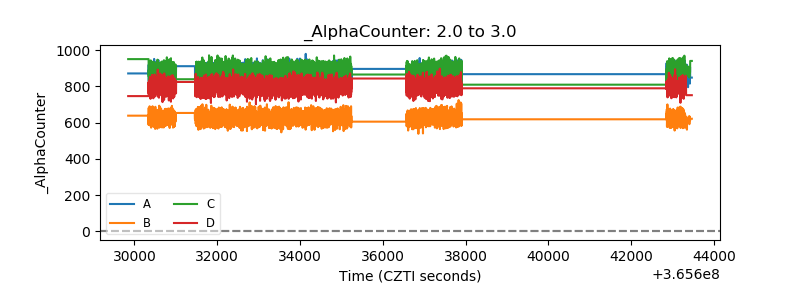 |
| _CPM_Rate | 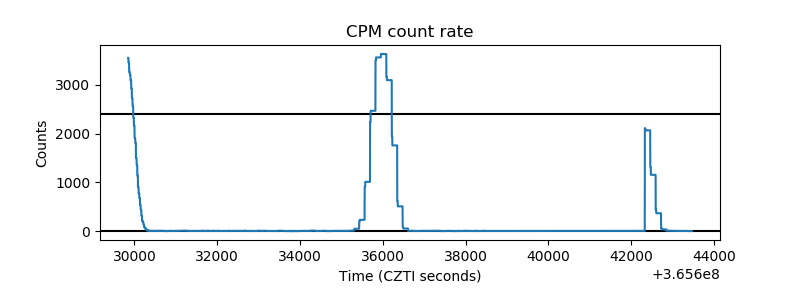 |
| CZT Counter | 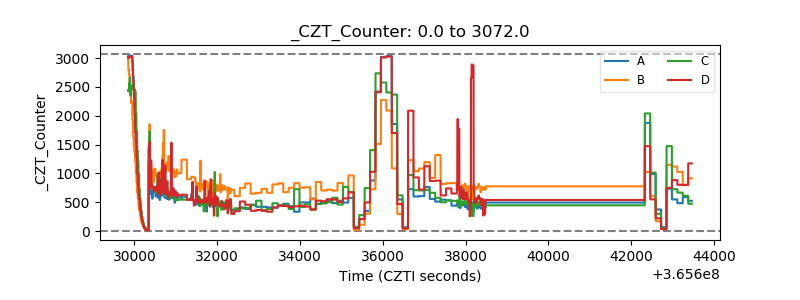 |
| +2.5 Volts monitor | 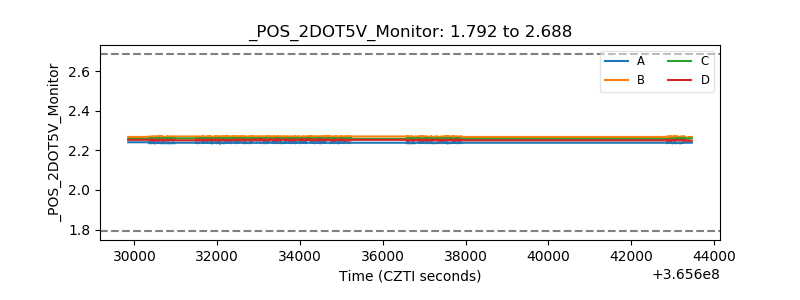 |
| +5 Volts monitor | 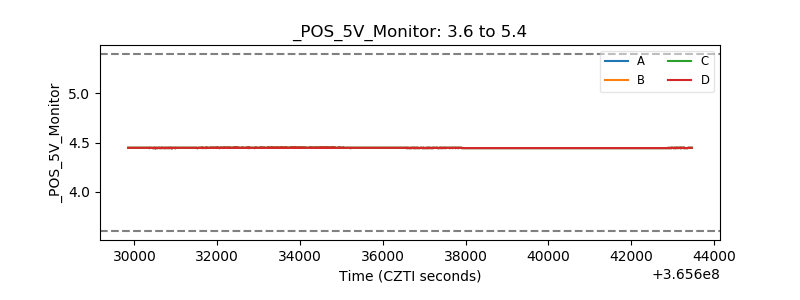 |
| _ROLL_ROT | 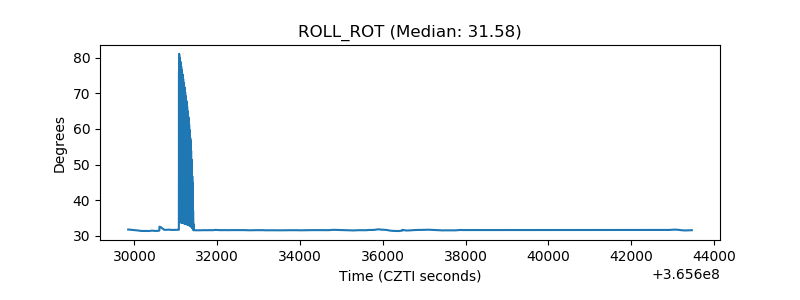 |
| _Roll_DEC | 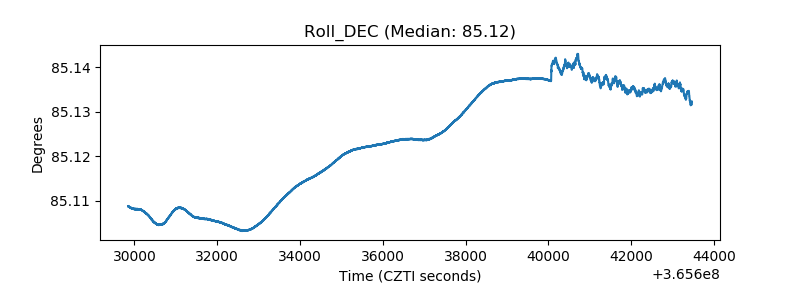 |
| _Roll_RA | 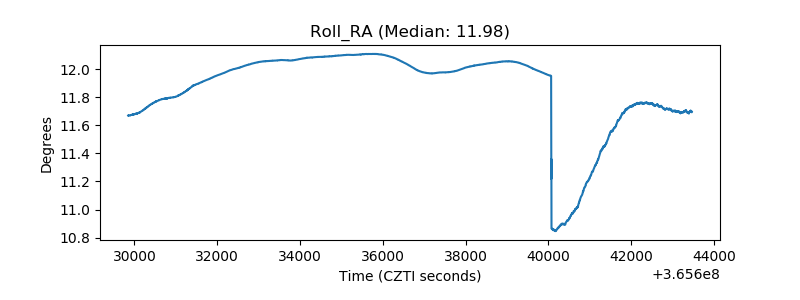 |
| Veto Counter | 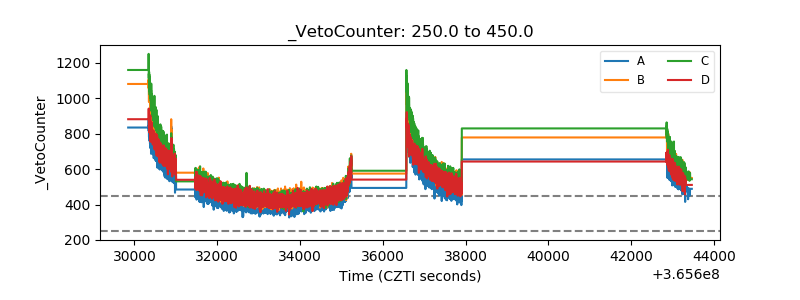 |