| Param | Original file | Final file |
|---|---|---|
| Filename | modeM0/AS1C06_010T02_9000004618_31612cztM0_level2.evt | modeM0/AS1C06_010T02_9000004618_31612cztM0_level2_quad_clean.evt |
| Size (bytes) | 84,130,560 | 21,291,840 |
| Size | 80.2 MB | 20.3 MB |
| Events in quadrant A | 489,078 | 147,810 |
| Events in quadrant B | 822,301 | 148,551 |
| Events in quadrant C | 555,330 | 145,068 |
| Events in quadrant D | 623,245 | 138,955 |
| Mode M0 | |||
|---|---|---|---|
| Quadrant | BADHDUFLAG | Total packets | Discarded packets |
| A | 0 | 2433 | 376 |
| B | 0 | 3721 | 668 |
| C | 0 | 2686 | 424 |
| D | 0 | 2923 | 473 |
| Mode M9 | |||
|---|---|---|---|
| Quadrant | BADHDUFLAG | Total packets | Discarded packets |
| A | 0 | 5 | 0 |
| B | 0 | 5 | 0 |
| C | 0 | 5 | 0 |
| D | 0 | 5 | 0 |
| Mode SS | |||
|---|---|---|---|
| Quadrant | BADHDUFLAG | Total packets | Discarded packets |
| A | 0 | 22 | 4 |
| B | 0 | 22 | 4 |
| C | 0 | 22 | 6 |
| D | 0 | 21 | 3 |
| Quadrant | Total seconds | Saturated seconds | Saturation percentage |
|---|---|---|---|
| A | 808 | 2 | 0.247525% |
| B | 793 | 34 | 4.287516% |
| C | 804 | 38 | 4.726368% |
| D | 816 | 31 | 3.799020% |
Noise dominated data is calculated using 1-second bins in cleaned event files. If a bin has >2000 counts, and if more than 50% of those come from <1% of pixels, then it is considered to be noise-dominated and hence unusable.
| Quadrant | # 1 sec bins | Bins with >0 counts | Bins with >2000 counts | High rate bins dominated by noise | Noise dominated (total time) | Noise dominated (detector-on time) | Marked lightcurve |
|---|---|---|---|---|---|---|---|
| A | 1307 | 836 | 0 | 0 | 0.00% | 0.00% | 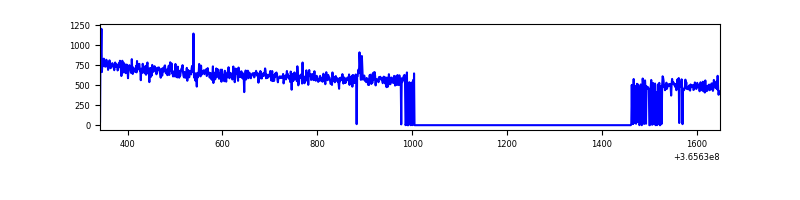 |
| B | 1306 | 819 | 9 | 9 | 0.69% | 1.10% | 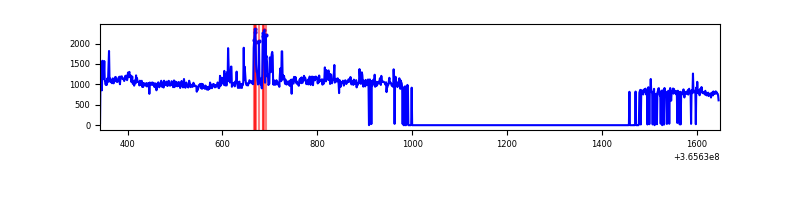 |
| C | 1306 | 829 | 3 | 3 | 0.23% | 0.36% | 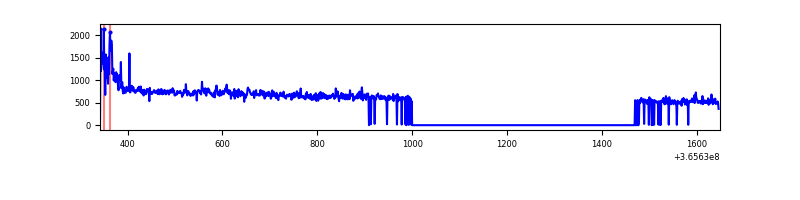 |
| D | 1306 | 841 | 13 | 13 | 1.00% | 1.55% | 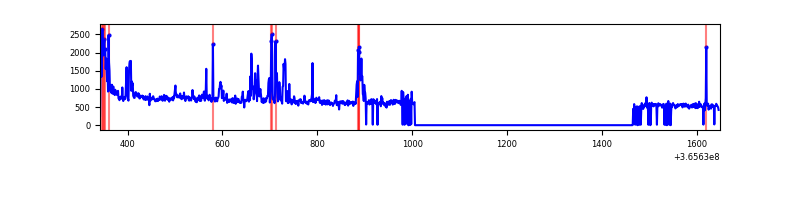 |
Top three noisy pixels from each quadrant. If the there are fewer than three noisy pixels in the level2.evt file, extra rows are filled as -1
| Pixel properties | Quadrant properties | ||||||
|---|---|---|---|---|---|---|---|
| Quadrant | DetID | PixID | Counts | Sigma | Mean | Median | Sigma |
| A | 13 | 254 | 1688 | 58.54 | 126 | 124 | 26.7 |
| A | 0 | 226 | 1149 | 38.36 | 126 | 124 | 26.7 |
| A | 3 | 137 | 1014 | 33.31 | 126 | 124 | 26.7 |
| B | 6 | 159 | 264991 | 10494.55 | 124 | 121 | 25.2 |
| B | 5 | 172 | 43165 | 1705.47 | 124 | 121 | 25.2 |
| B | 0 | 182 | 13444 | 527.88 | 124 | 121 | 25.2 |
| C | 0 | 10 | 25253 | 812.5 | 125 | 126 | 30.9 |
| C | 14 | 238 | 21073 | 677.33 | 125 | 126 | 30.9 |
| C | 3 | 233 | 10571 | 337.75 | 125 | 126 | 30.9 |
| D | 12 | 218 | 70445 | 2272.7 | 124 | 121 | 30.9 |
| D | 8 | 195 | 52458 | 1691.4 | 124 | 121 | 30.9 |
| D | 12 | 233 | 17250 | 553.57 | 124 | 121 | 30.9 |
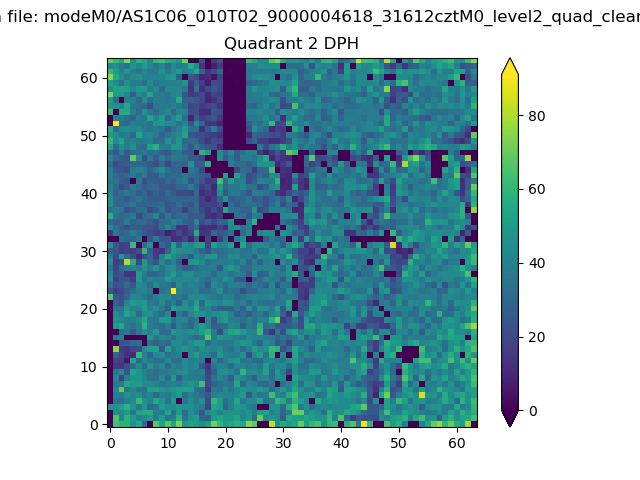
Histogram calculated using DETX and DETY for each event in the final _common_clean file
| Quadrant A | 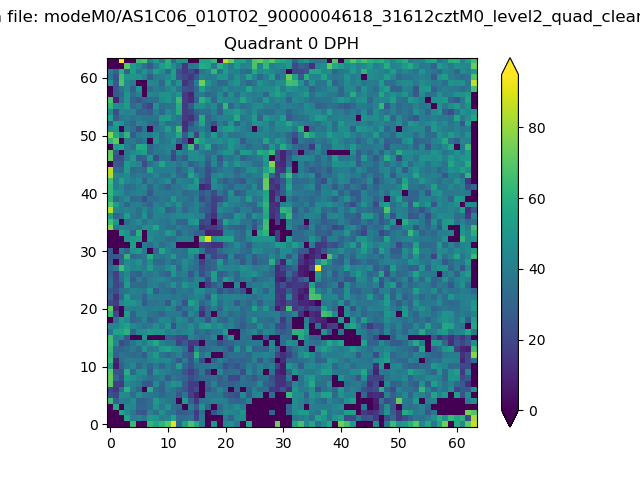 |
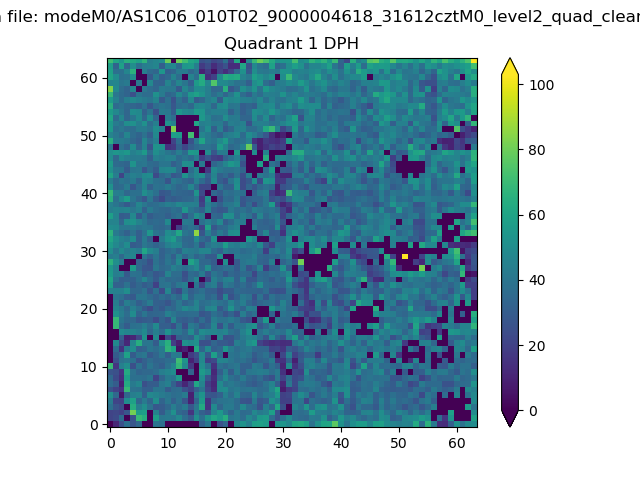 |
Quadrant B |
|---|---|---|---|
| Quadrant D | 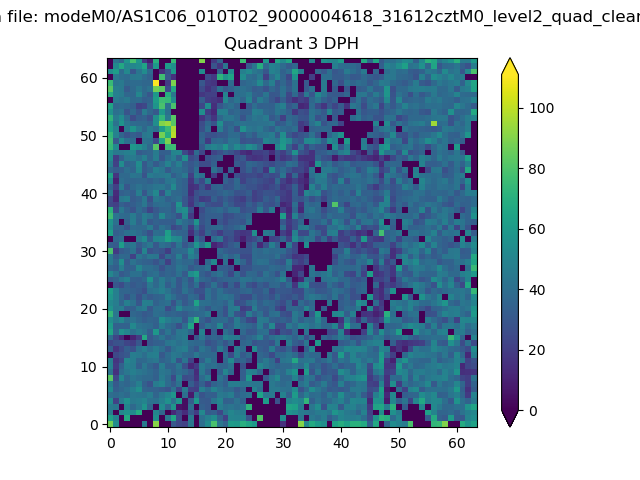 |
 |
Quadrant C |
| Plot type | Count rate plots | Images |
|---|---|---|
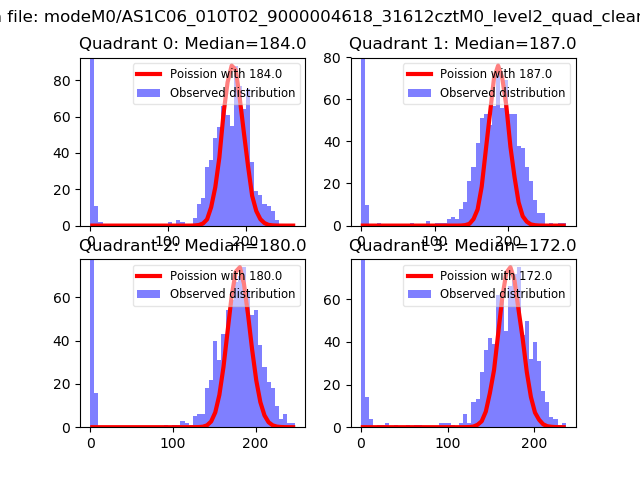
| Comparison with Poisson distribution Blue bars denote a histogram of data divided into 1 sec bins. Red curve is a Poisson curve with rate = median count rate of data. |
 |
 |
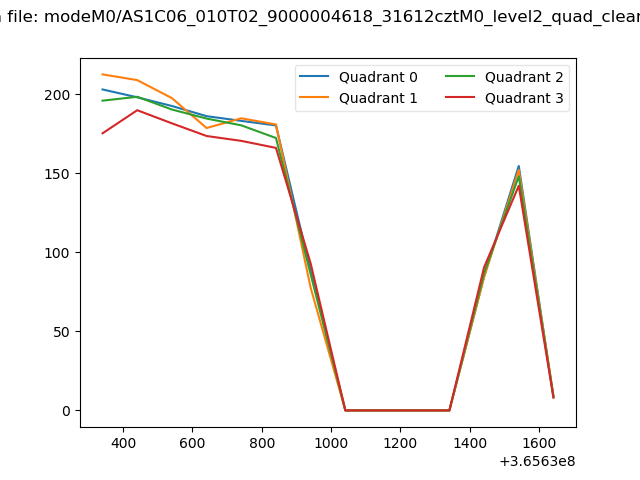
| Quadrant-wise count rates Data is divided into 100 sec bins |
 |
|
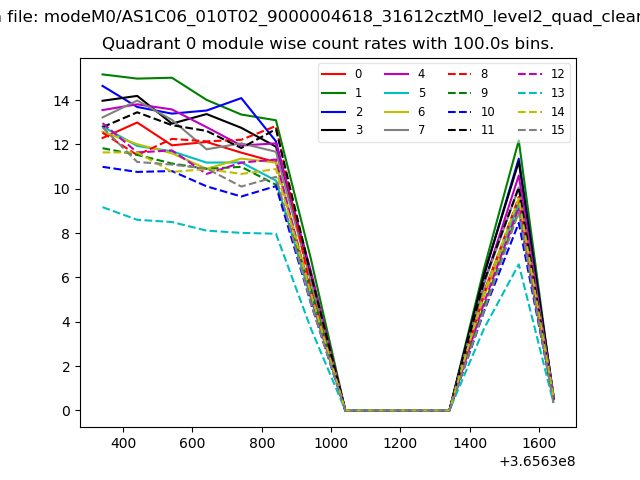
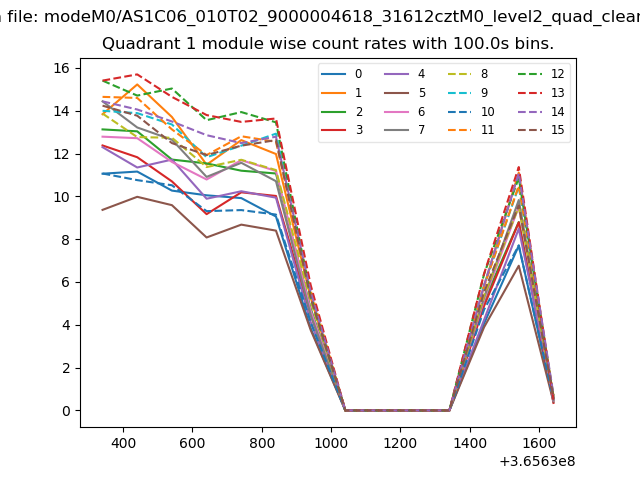
| Module-wise count rates for Quadrant A Data is divided into 100 sec bins |
 |
 |
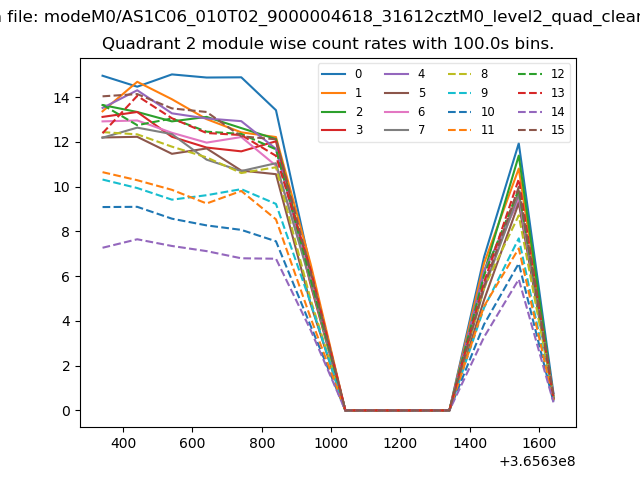
| Module-wise count rates for Quadrant B Data is divided into 100 sec bins |
 |
 |
| Module-wise count rates for Quadrant C Data is divided into 100 sec bins |
 |
 |
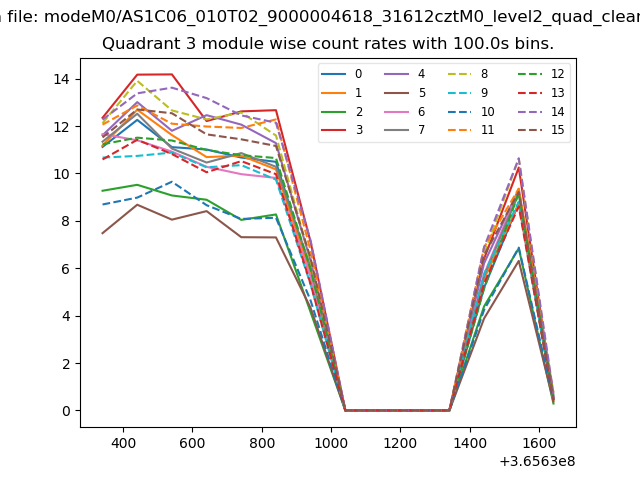
| Module-wise count rates for Quadrant D Data is divided into 100 sec bins |
 |
 |
| Parameter | Plot |
|---|---|
| CZT HV Monitor | 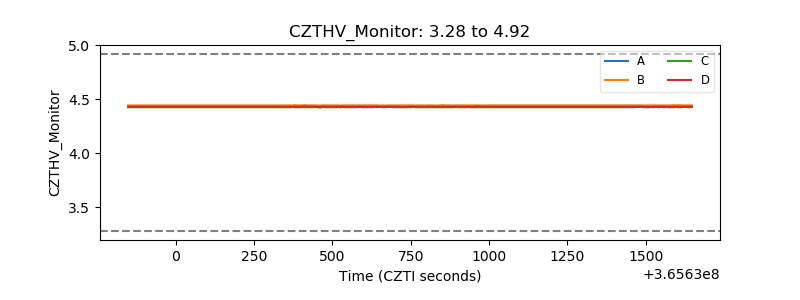 |
| D_VDD |  |
| Temperature 1 |  |
| Veto HV Monitor | 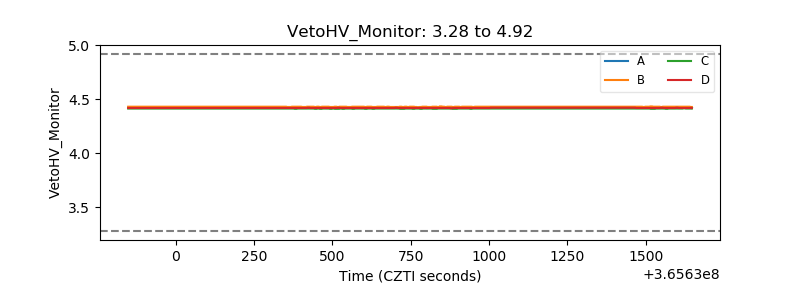 |
| Veto LLD | 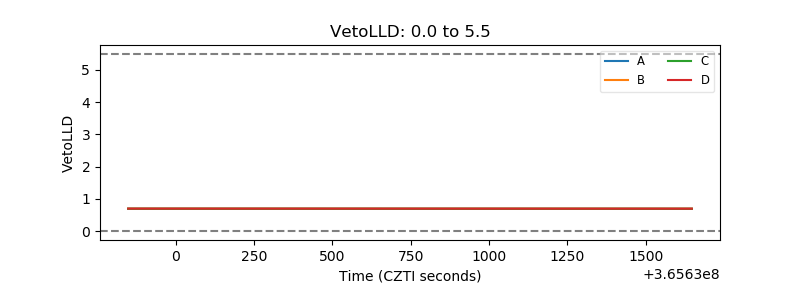 |
| Alpha Counter | 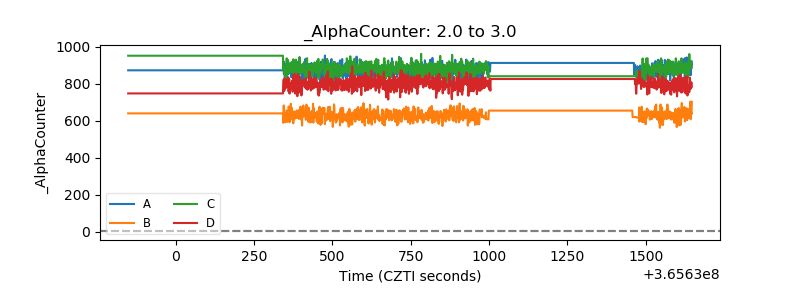 |
| _CPM_Rate | 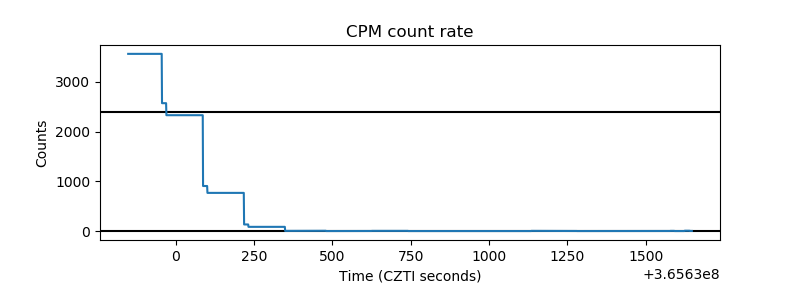 |
| CZT Counter | 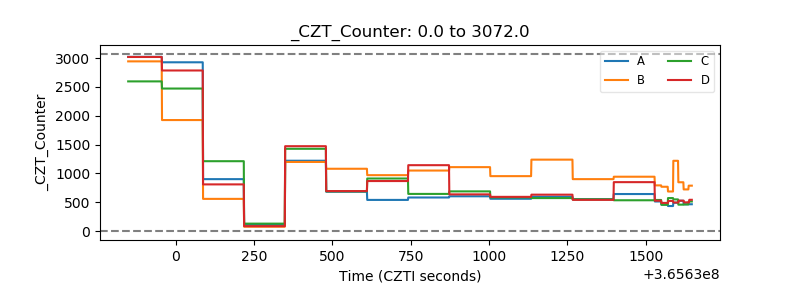 |
| +2.5 Volts monitor |  |
| +5 Volts monitor |  |
| _ROLL_ROT | 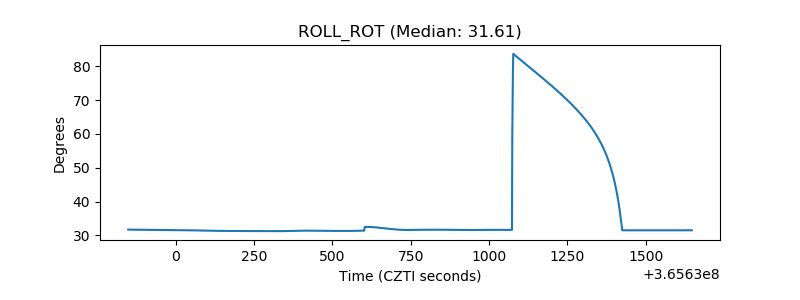 |
| _Roll_DEC | 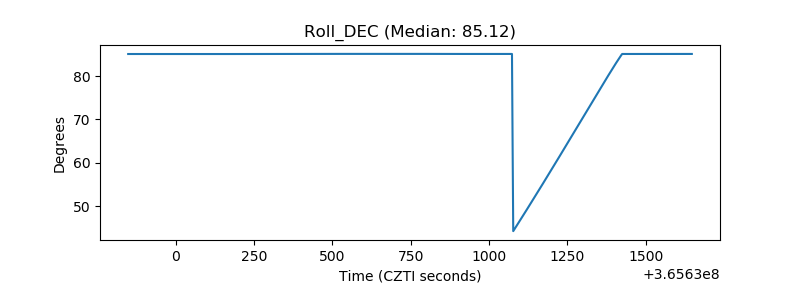 |
| _Roll_RA | 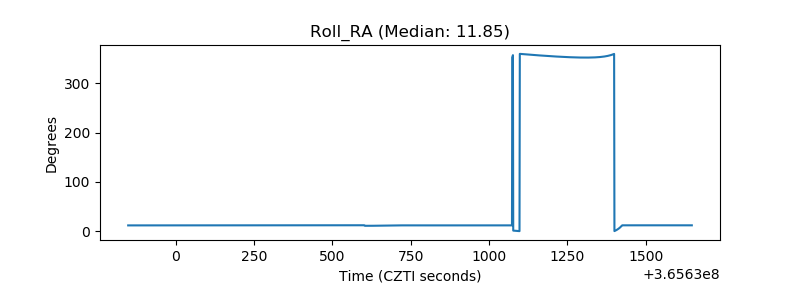 |
| Veto Counter | 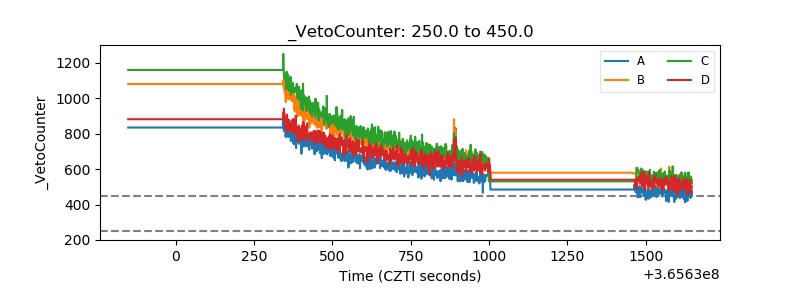 |