| Param | Original file | Final file |
|---|---|---|
| Filename | modeM0/AS1C06_010T02_9000004618_31615cztM0_level2.evt | modeM0/AS1C06_010T02_9000004618_31615cztM0_level2_quad_clean.evt |
| Size (bytes) | 54,541,440 | 11,292,480 |
| Size | 52.0 MB | 10.8 MB |
| Events in quadrant A | 280,528 | 78,624 |
| Events in quadrant B | 520,120 | 78,192 |
| Events in quadrant C | 333,628 | 75,973 |
| Events in quadrant D | 480,094 | 65,690 |
| Mode M0 | |||
|---|---|---|---|
| Quadrant | BADHDUFLAG | Total packets | Discarded packets |
| A | 0 | 1465 | 335 |
| B | 0 | 2492 | 582 |
| C | 0 | 1826 | 442 |
| D | 0 | 2659 | 887 |
| Mode M9 | |||
|---|---|---|---|
| Quadrant | BADHDUFLAG | Total packets | Discarded packets |
| A | 1 | 140574224046888 | 46 |
| B | 1 | -1 | -1 |
| C | 1 | -1 | -1 |
| D | 1 | -1 | -1 |
| Mode SS | |||
|---|---|---|---|
| Quadrant | BADHDUFLAG | Total packets | Discarded packets |
| A | 0 | 13 | 3 |
| B | 0 | 13 | 3 |
| C | 0 | 14 | 6 |
| D | 0 | 13 | 3 |
| Quadrant | Total seconds | Saturated seconds | Saturation percentage |
|---|---|---|---|
| A | 516 | 0 | 0.000000% |
| B | 505 | 25 | 4.950495% |
| C | 515 | 16 | 3.106796% |
| D | 489 | 39 | 7.975460% |
Noise dominated data is calculated using 1-second bins in cleaned event files. If a bin has >2000 counts, and if more than 50% of those come from <1% of pixels, then it is considered to be noise-dominated and hence unusable.
| Quadrant | # 1 sec bins | Bins with >0 counts | Bins with >2000 counts | High rate bins dominated by noise | Noise dominated (total time) | Noise dominated (detector-on time) | Marked lightcurve |
|---|---|---|---|---|---|---|---|
| A | 738 | 539 | 0 | 0 | 0.00% | 0.00% | 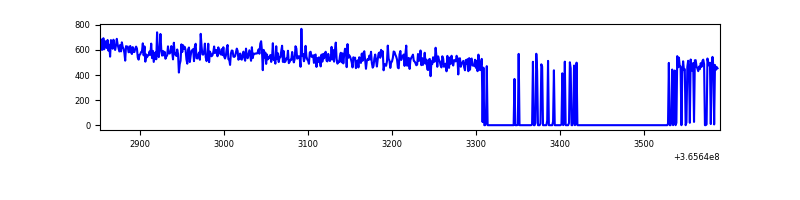 |
| B | 739 | 529 | 7 | 7 | 0.95% | 1.32% | 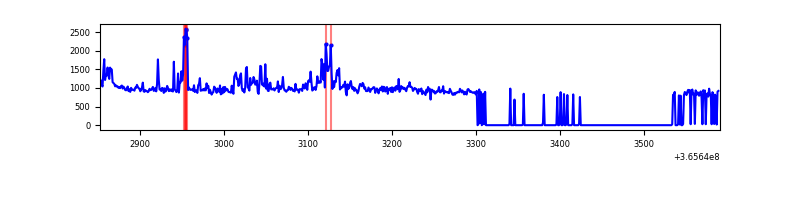 |
| C | 739 | 543 | 0 | 0 | 0.00% | 0.00% | 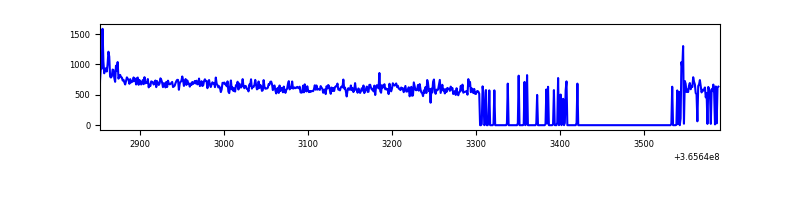 |
| D | 739 | 506 | 36 | 36 | 4.87% | 7.11% | 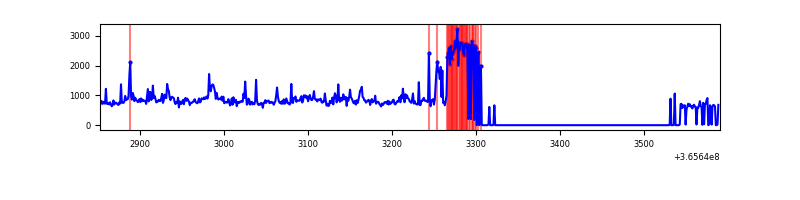 |
Top three noisy pixels from each quadrant. If the there are fewer than three noisy pixels in the level2.evt file, extra rows are filled as -1
| Pixel properties | Quadrant properties | ||||||
|---|---|---|---|---|---|---|---|
| Quadrant | DetID | PixID | Counts | Sigma | Mean | Median | Sigma |
| A | 13 | 6 | 1267 | 72.73 | 72 | 70 | 16.5 |
| A | 13 | 254 | 1106 | 62.94 | 72 | 70 | 16.5 |
| A | 3 | 137 | 659 | 35.79 | 72 | 70 | 16.5 |
| B | 6 | 159 | 164913 | 10920.26 | 71 | 70 | 15.1 |
| B | 0 | 190 | 14500 | 955.94 | 71 | 70 | 15.1 |
| B | 5 | 172 | 14374 | 947.59 | 71 | 70 | 15.1 |
| C | 14 | 238 | 16912 | 897.32 | 71 | 71 | 18.8 |
| C | 4 | 175 | 16151 | 856.77 | 71 | 71 | 18.8 |
| C | 14 | 254 | 7230 | 381.43 | 71 | 71 | 18.8 |
| D | 8 | 195 | 86461 | 4955.69 | 65 | 63 | 17.4 |
| D | 12 | 218 | 80617 | 4620.48 | 65 | 63 | 17.4 |
| D | 12 | 233 | 27054 | 1548.17 | 65 | 63 | 17.4 |
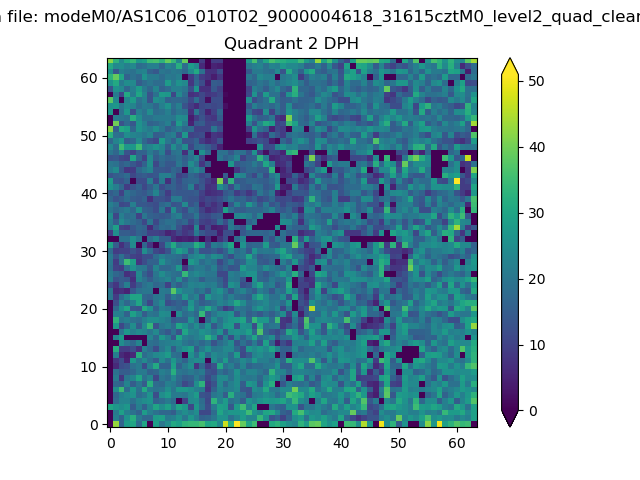
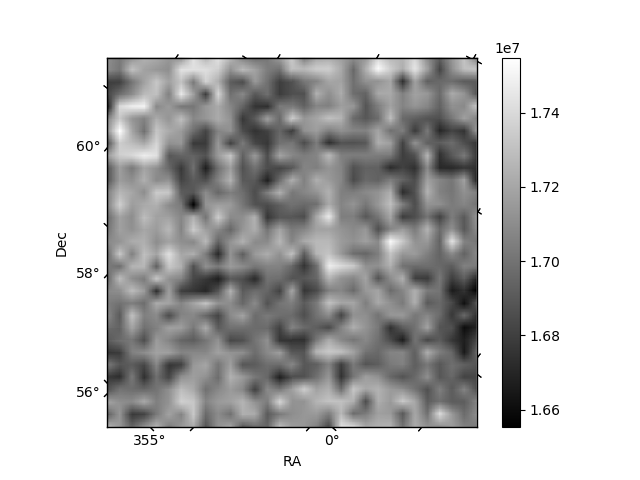
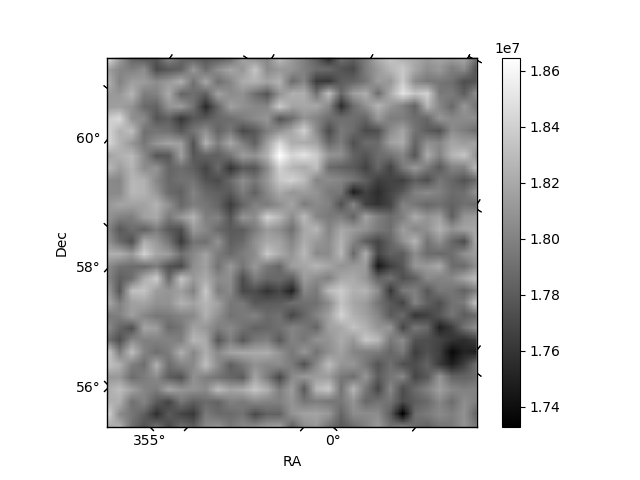
Histogram calculated using DETX and DETY for each event in the final _common_clean file
| Quadrant A | 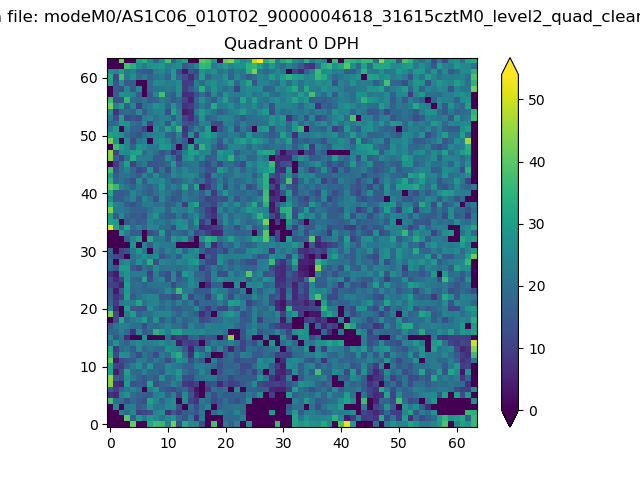 |
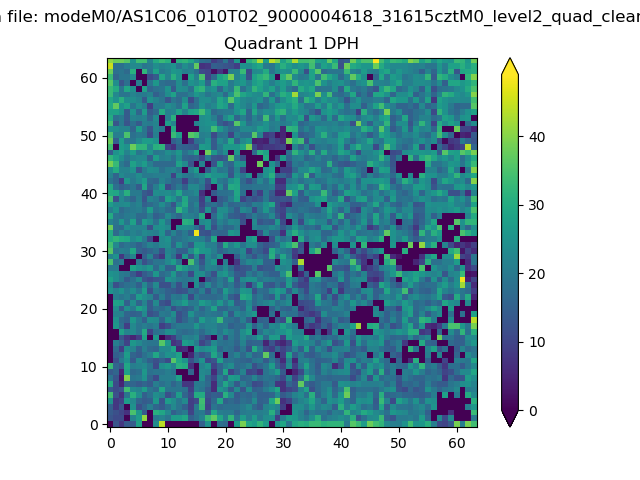 |
Quadrant B |
|---|---|---|---|
| Quadrant D | 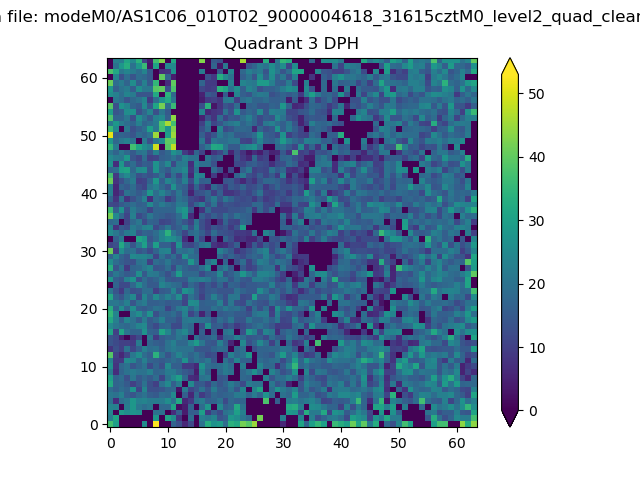 |
 |
Quadrant C |
| Plot type | Count rate plots | Images |
|---|---|---|
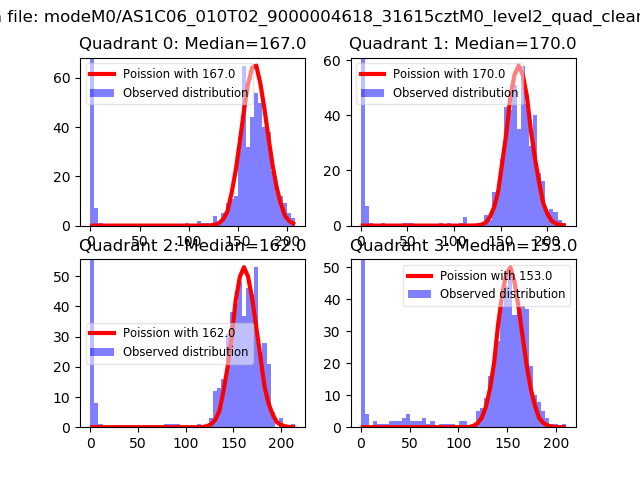
| Comparison with Poisson distribution Blue bars denote a histogram of data divided into 1 sec bins. Red curve is a Poisson curve with rate = median count rate of data. |
 |
 |
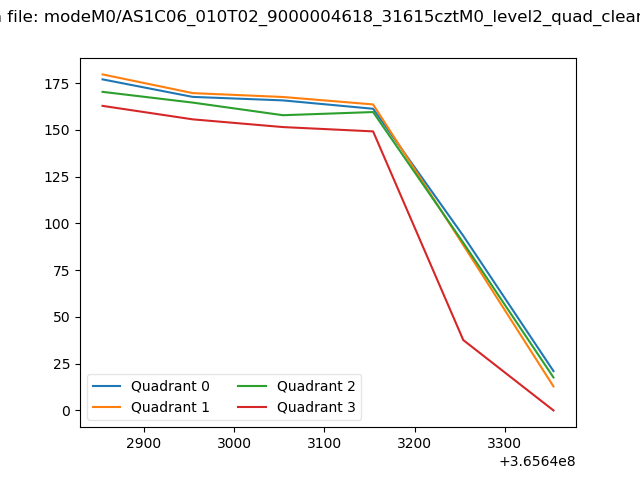
| Quadrant-wise count rates Data is divided into 100 sec bins |
 |
|
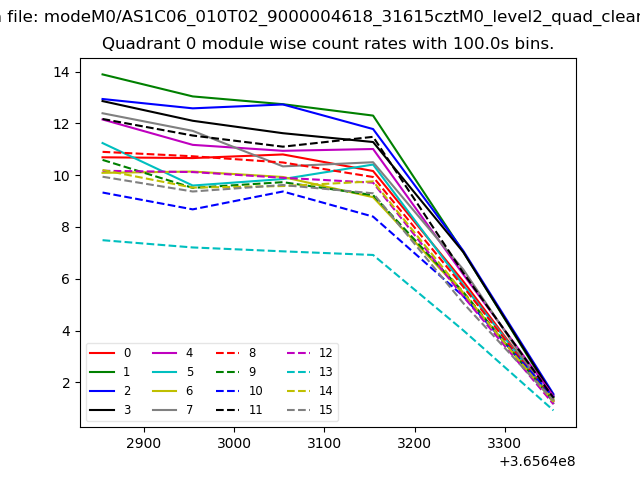
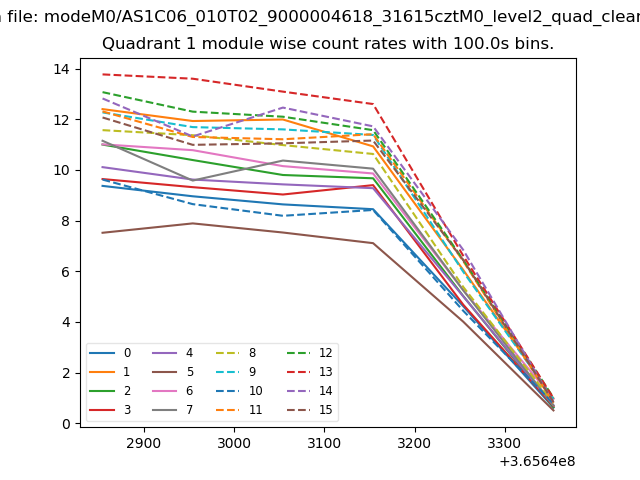
| Module-wise count rates for Quadrant A Data is divided into 100 sec bins |
 |
 |
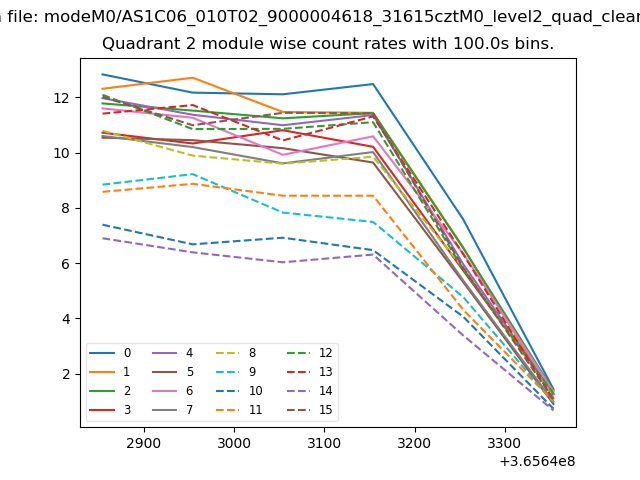
| Module-wise count rates for Quadrant B Data is divided into 100 sec bins |
 |
 |
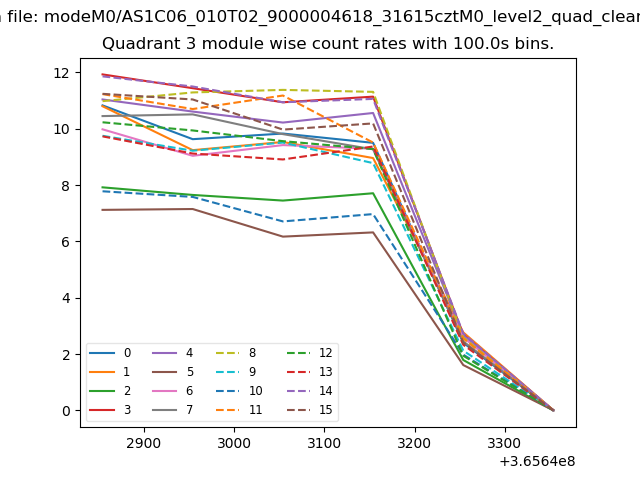
| Module-wise count rates for Quadrant C Data is divided into 100 sec bins |
 |
 |
| Module-wise count rates for Quadrant D Data is divided into 100 sec bins |
 |
 |
| Parameter | Plot |
|---|---|
| CZT HV Monitor | 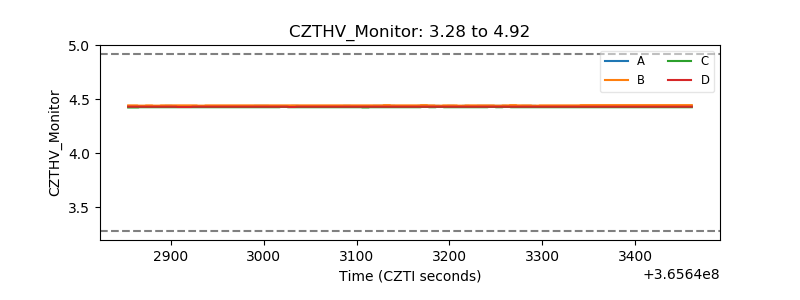 |
| D_VDD |  |
| Temperature 1 | 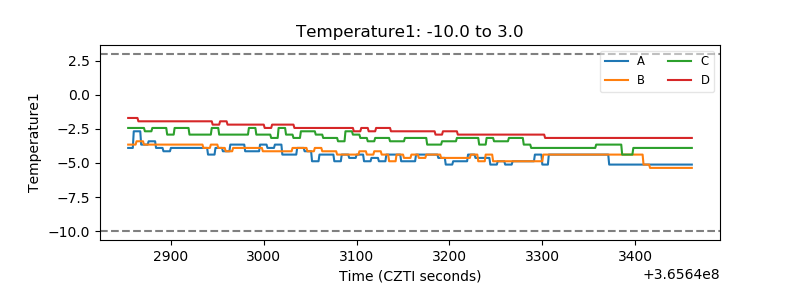 |
| Veto HV Monitor | 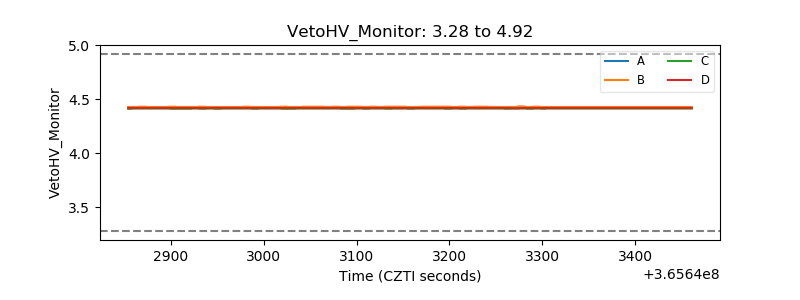 |
| Veto LLD |  |
| Alpha Counter | 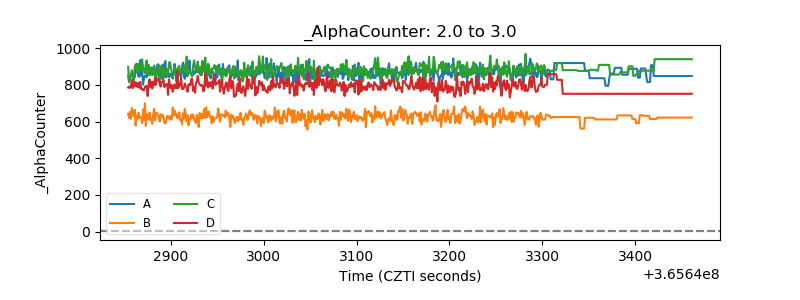 |
| _CPM_Rate | 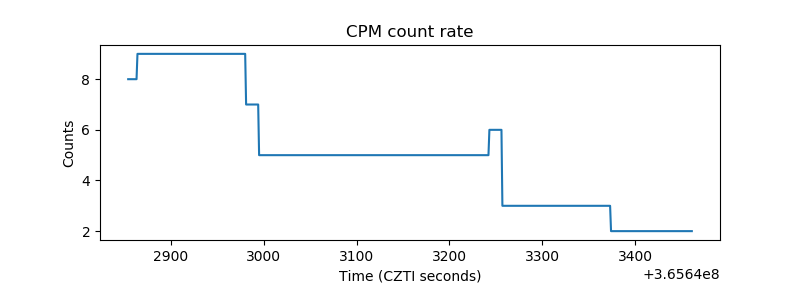 |
| CZT Counter | 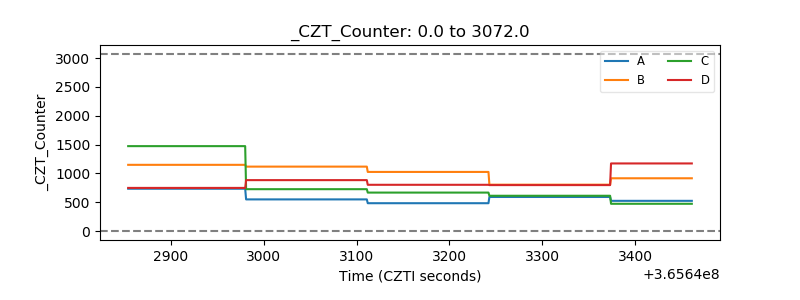 |
| +2.5 Volts monitor |  |
| +5 Volts monitor |  |
| _ROLL_ROT | 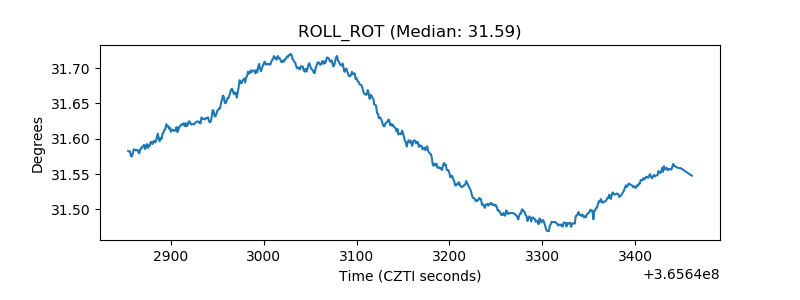 |
| _Roll_DEC | 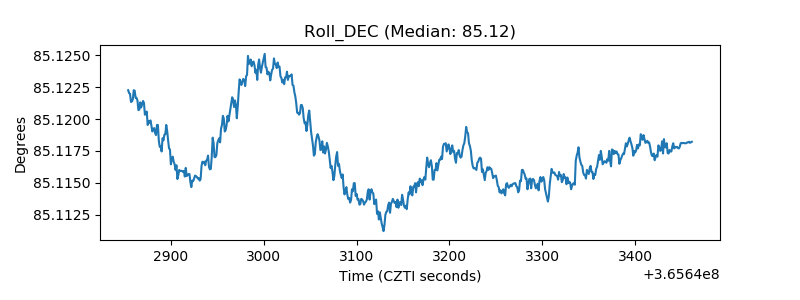 |
| _Roll_RA | 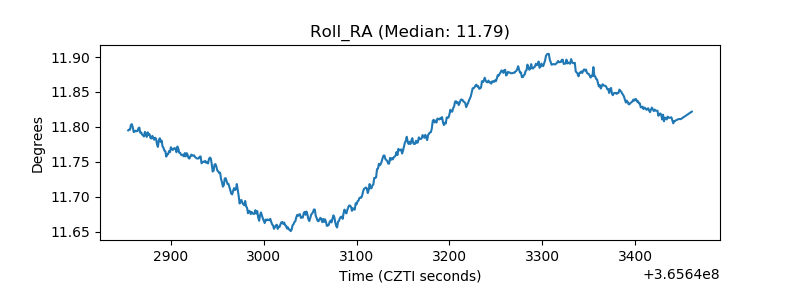 |
| Veto Counter | 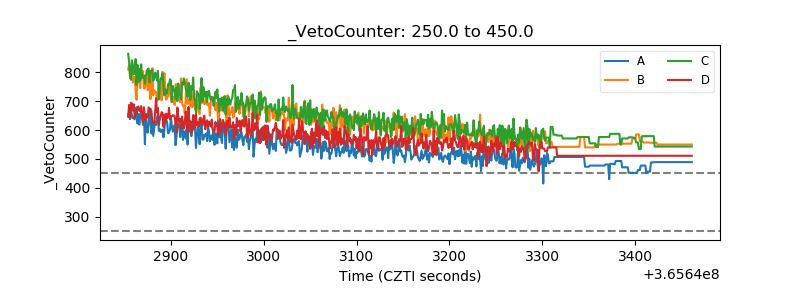 |