| Param | Original file | Final file |
|---|---|---|
| Filename | modeM0/AS1T04_035T01_9000004622_31636cztM0_level2.evt | modeM0/AS1T04_035T01_9000004622_31636cztM0_level2_quad_clean.evt |
| Size (bytes) | 520,076,160 | 75,686,400 |
| Size | 496.0 MB | 72.2 MB |
| Events in quadrant A | 2,585,587 | 497,634 |
| Events in quadrant B | 4,646,883 | 483,109 |
| Events in quadrant C | 3,045,080 | 479,685 |
| Events in quadrant D | 5,099,196 | 445,063 |
| Mode M0 | |||
|---|---|---|---|
| Quadrant | BADHDUFLAG | Total packets | Discarded packets |
| A | 0 | 11338 | 1 |
| B | 0 | 17815 | 1 |
| C | 0 | 12469 | 1 |
| D | 0 | 19166 | 1 |
| Mode SS | |||
|---|---|---|---|
| Quadrant | BADHDUFLAG | Total packets | Discarded packets |
| A | 0 | 112 | 0 |
| B | 0 | 112 | 0 |
| C | 0 | 112 | 0 |
| D | 0 | 112 | 0 |
| Mode M9 | |||
|---|---|---|---|
| Quadrant | BADHDUFLAG | Total packets | Discarded packets |
| A | 0 | 6 | 0 |
| B | 0 | 6 | 0 |
| C | 0 | 6 | 0 |
| D | 0 | 6 | 0 |
| Quadrant | Total seconds | Saturated seconds | Saturation percentage |
|---|---|---|---|
| A | 5520 | 80 | 1.449275% |
| B | 5520 | 259 | 4.692029% |
| C | 5520 | 146 | 2.644928% |
| D | 5520 | 486 | 8.804348% |
Noise dominated data is calculated using 1-second bins in cleaned event files. If a bin has >2000 counts, and if more than 50% of those come from <1% of pixels, then it is considered to be noise-dominated and hence unusable.
| Quadrant | # 1 sec bins | Bins with >0 counts | Bins with >2000 counts | High rate bins dominated by noise | Noise dominated (total time) | Noise dominated (detector-on time) | Marked lightcurve |
|---|---|---|---|---|---|---|---|
| A | 6070 | 5521 | 4 | 4 | 0.07% | 0.07% | 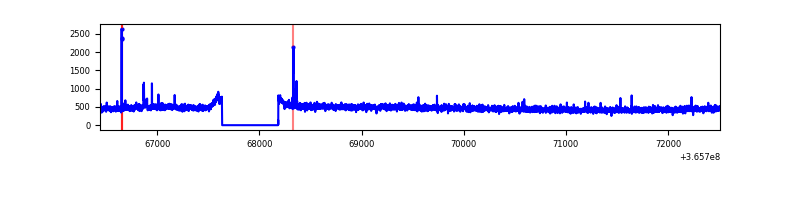 |
| B | 6070 | 5521 | 110 | 110 | 1.81% | 1.99% | 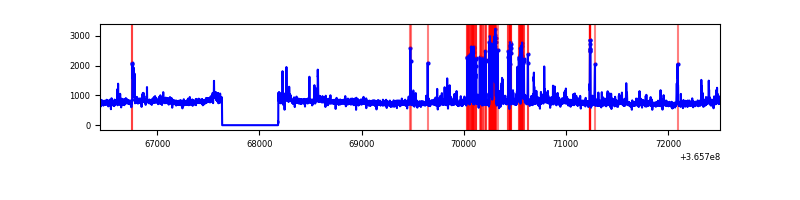 |
| C | 6070 | 5521 | 10 | 10 | 0.16% | 0.18% |  |
| D | 6070 | 5521 | 448 | 448 | 7.38% | 8.11% | 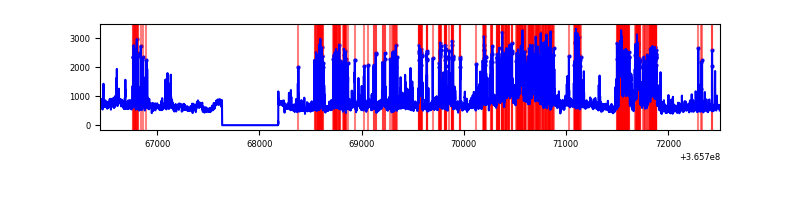 |
Top three noisy pixels from each quadrant. If the there are fewer than three noisy pixels in the level2.evt file, extra rows are filled as -1
| Pixel properties | Quadrant properties | ||||||
|---|---|---|---|---|---|---|---|
| Quadrant | DetID | PixID | Counts | Sigma | Mean | Median | Sigma |
| A | 15 | 174 | 33008 | 240.86 | 659 | 643 | 134.4 |
| A | 13 | 254 | 10820 | 75.74 | 659 | 643 | 134.4 |
| A | 3 | 137 | 6692 | 45.02 | 659 | 643 | 134.4 |
| B | 6 | 159 | 1536025 | 12413.94 | 643 | 627 | 123.7 |
| B | 10 | 245 | 287324 | 2317.99 | 643 | 627 | 123.7 |
| B | 5 | 172 | 156653 | 1261.5 | 643 | 627 | 123.7 |
| C | 3 | 233 | 326259 | 2170.3 | 627 | 630 | 150.0 |
| C | 14 | 238 | 102965 | 682.06 | 627 | 630 | 150.0 |
| C | 14 | 225 | 66450 | 438.69 | 627 | 630 | 150.0 |
| D | 8 | 195 | 1032381 | 6965.22 | 616 | 598 | 148.1 |
| D | 11 | 176 | 1023055 | 6902.26 | 616 | 598 | 148.1 |
| D | 13 | 249 | 281684 | 1897.52 | 616 | 598 | 148.1 |
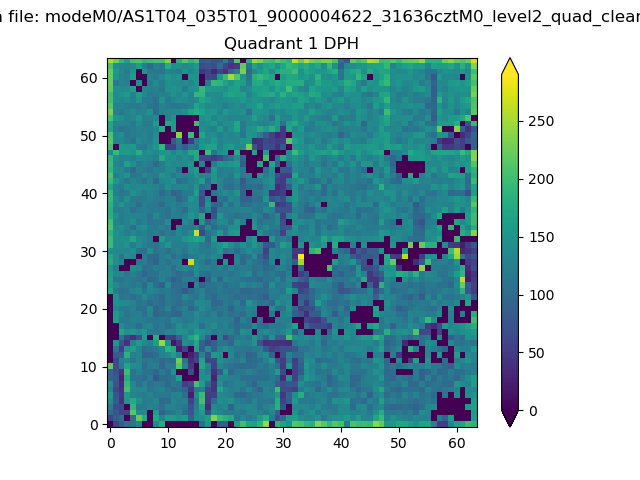
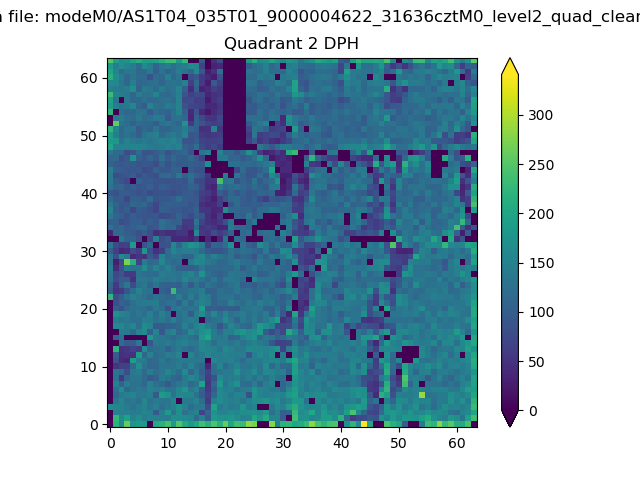
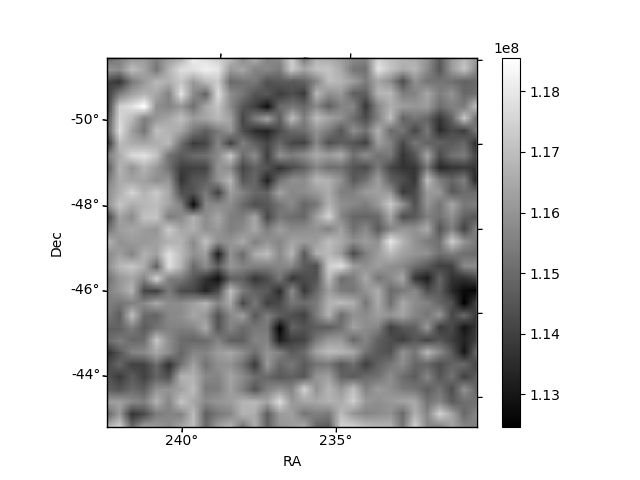
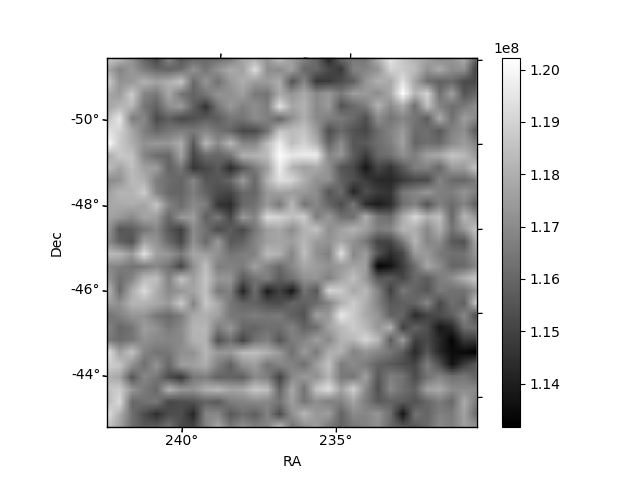
Histogram calculated using DETX and DETY for each event in the final _common_clean file
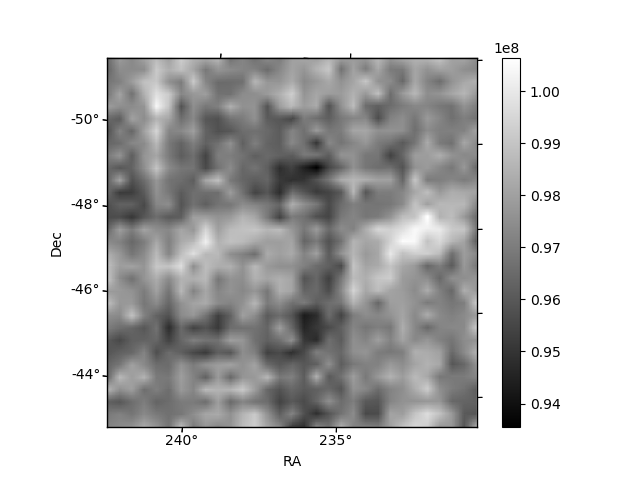
| Quadrant A | 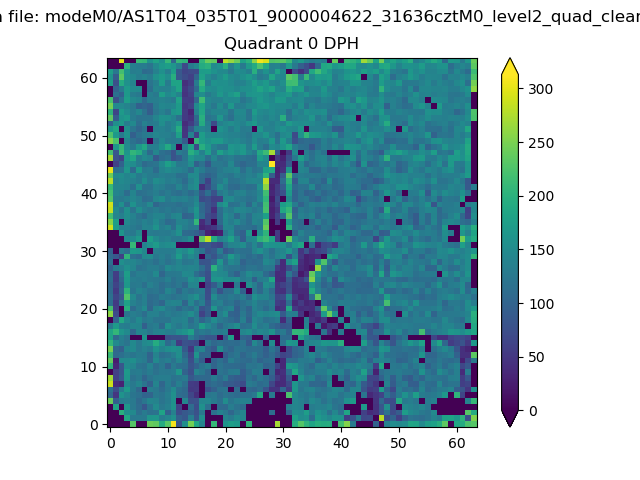 |
 |
Quadrant B |
|---|---|---|---|
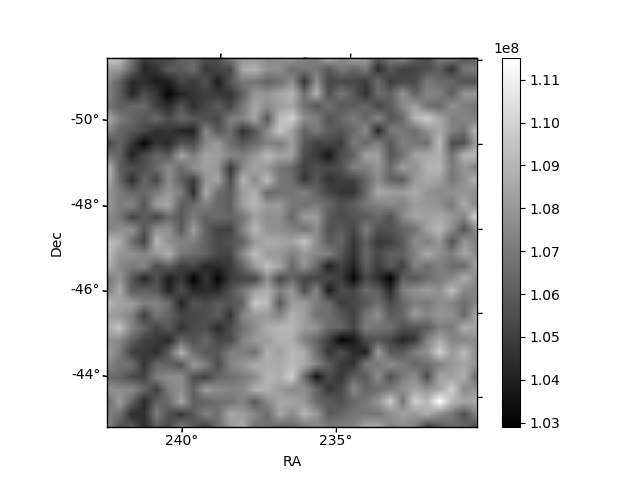
| Quadrant D | 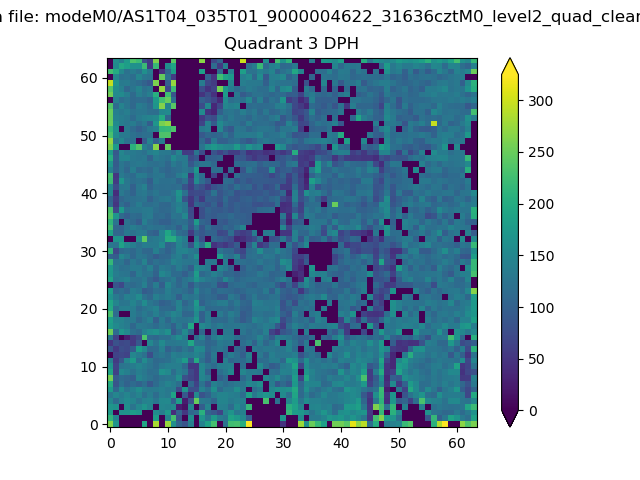 |
 |
Quadrant C |
| Plot type | Count rate plots | Images |
|---|---|---|
| Comparison with Poisson distribution Blue bars denote a histogram of data divided into 1 sec bins. Red curve is a Poisson curve with rate = median count rate of data. |
 |
 |
| Quadrant-wise count rates Data is divided into 100 sec bins |
 |
|
| Module-wise count rates for Quadrant A Data is divided into 100 sec bins |
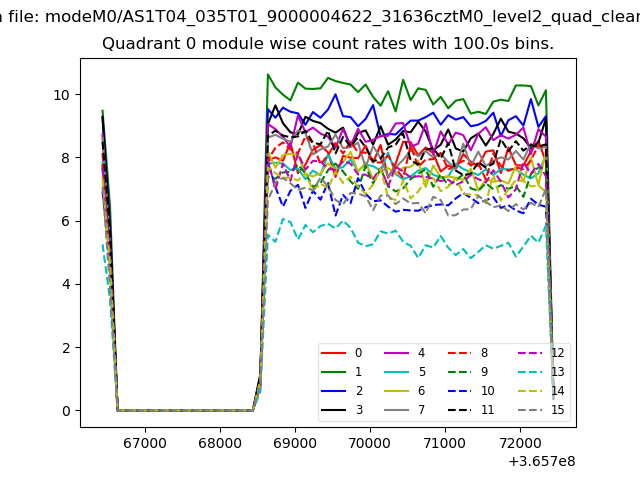 |
 |
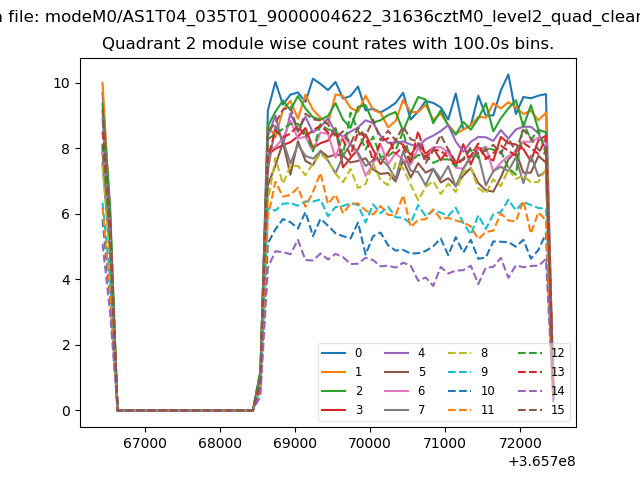
| Module-wise count rates for Quadrant B Data is divided into 100 sec bins |
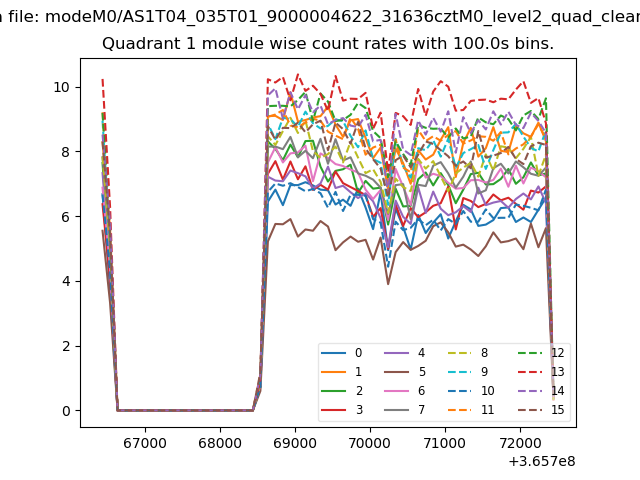 |
 |
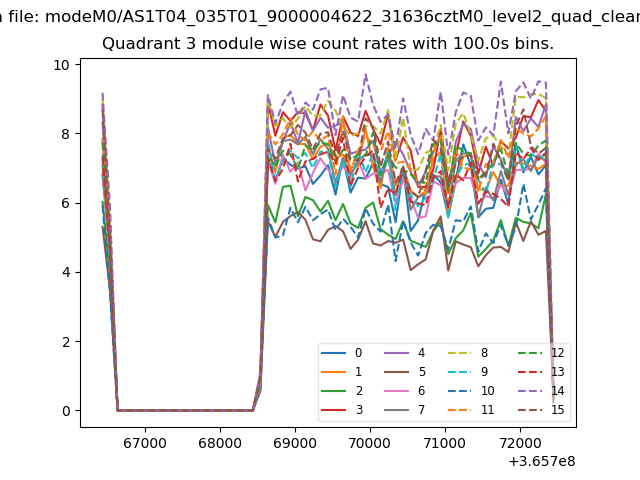
| Module-wise count rates for Quadrant C Data is divided into 100 sec bins |
 |
 |
| Module-wise count rates for Quadrant D Data is divided into 100 sec bins |
 |
 |
| Parameter | Plot |
|---|---|
| CZT HV Monitor | 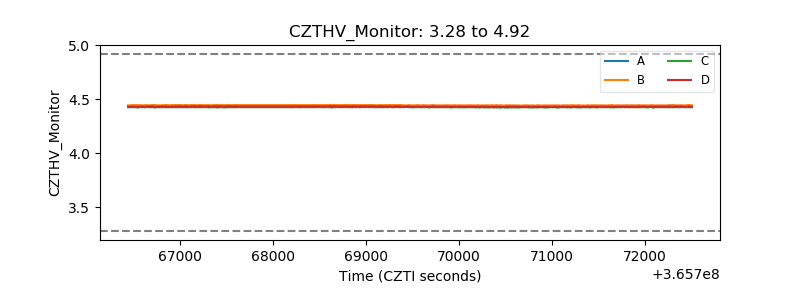 |
| D_VDD | 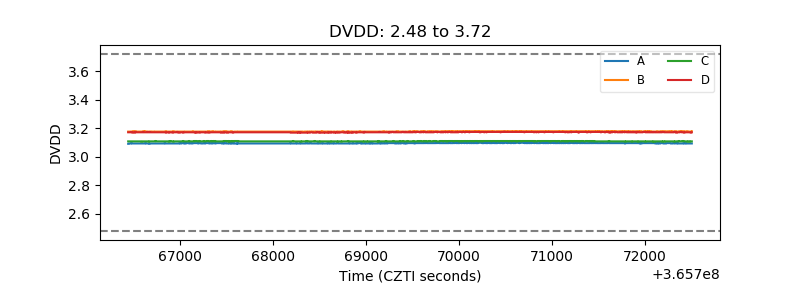 |
| Temperature 1 | 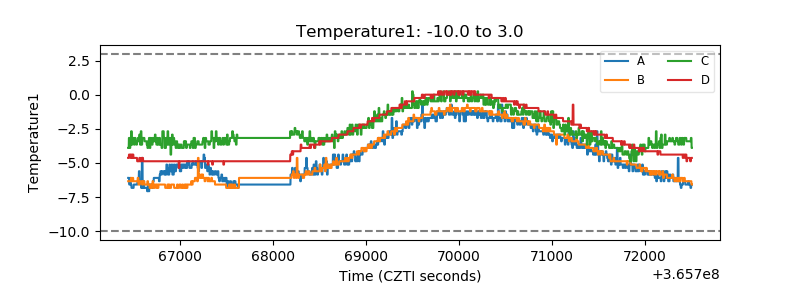 |
| Veto HV Monitor | 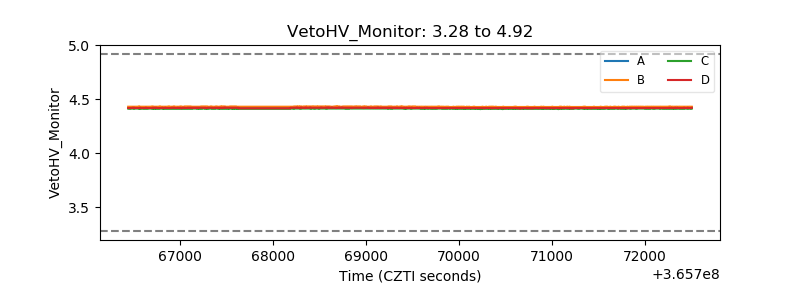 |
| Veto LLD | 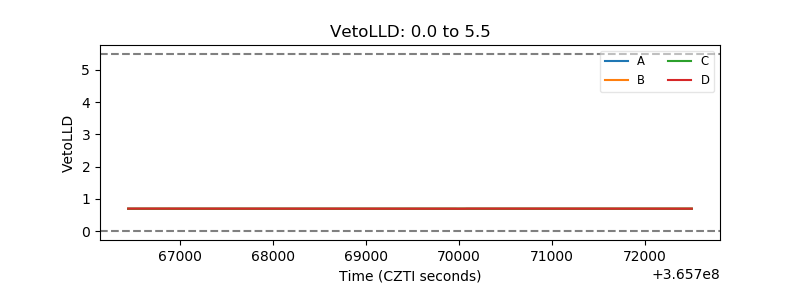 |
| Alpha Counter |  |
| _CPM_Rate | 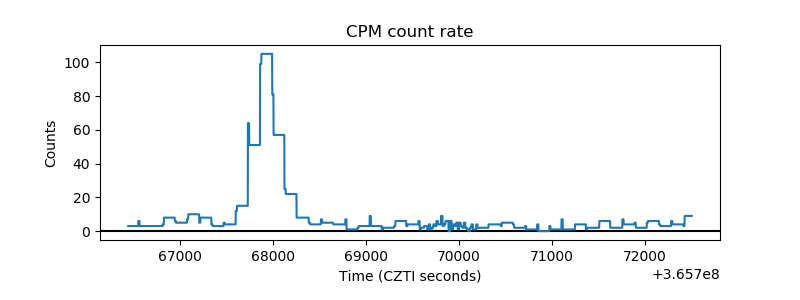 |
| CZT Counter | 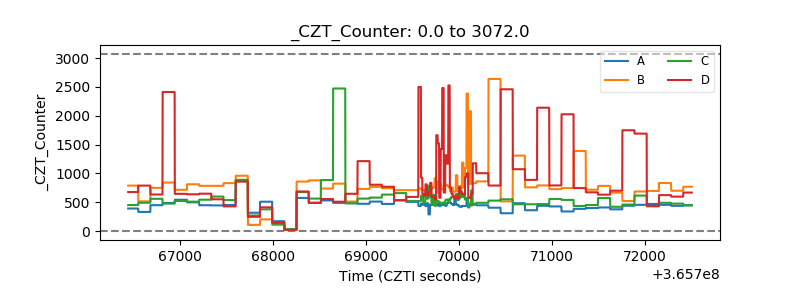 |
| +2.5 Volts monitor |  |
| +5 Volts monitor |  |
| _ROLL_ROT | 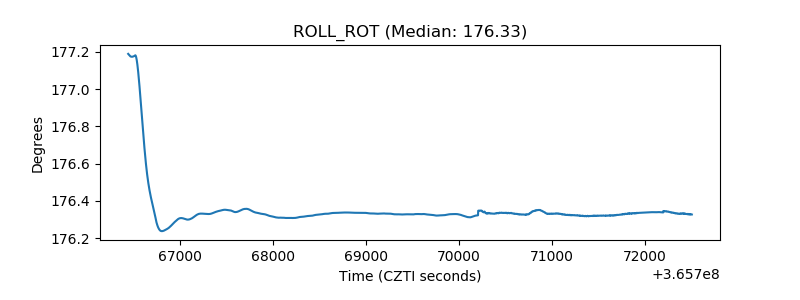 |
| _Roll_DEC | 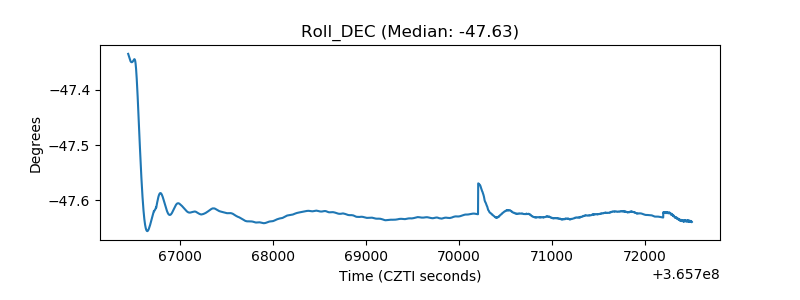 |
| _Roll_RA | 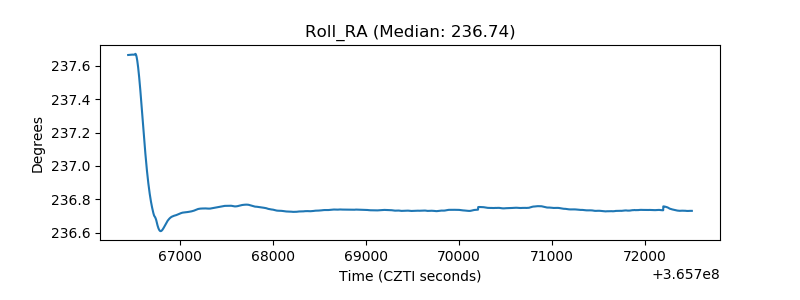 |
| Veto Counter | 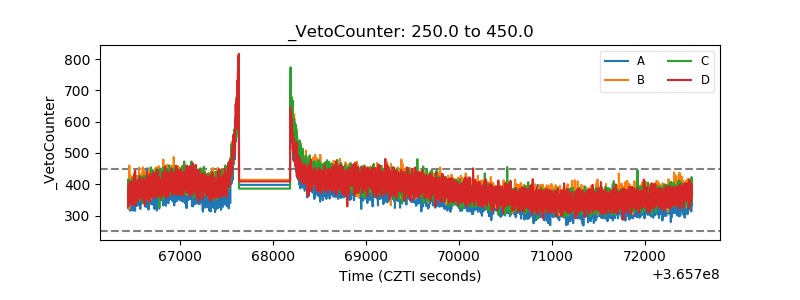 |