| Param | Original file | Final file |
|---|---|---|
| Filename | modeM0/AS1T04_035T01_9000004622_31637cztM0_level2.evt | modeM0/AS1T04_035T01_9000004622_31637cztM0_level2_quad_clean.evt |
| Size (bytes) | 903,075,840 | 112,455,360 |
| Size | 861.2 MB | 107.2 MB |
| Events in quadrant A | 4,849,041 | 741,099 |
| Events in quadrant B | 7,600,362 | 732,078 |
| Events in quadrant C | 7,088,348 | 699,422 |
| Events in quadrant D | 7,235,919 | 638,817 |
| Mode M0 | |||
|---|---|---|---|
| Quadrant | BADHDUFLAG | Total packets | Discarded packets |
| A | 0 | 20164 | 2 |
| B | 0 | 28533 | 2 |
| C | 0 | 26897 | 2 |
| D | 0 | 27616 | 2 |
| Mode SS | |||
|---|---|---|---|
| Quadrant | BADHDUFLAG | Total packets | Discarded packets |
| A | 0 | 176 | 0 |
| B | 0 | 176 | 0 |
| C | 0 | 176 | 0 |
| D | 0 | 176 | 0 |
| Mode M9 | |||
|---|---|---|---|
| Quadrant | BADHDUFLAG | Total packets | Discarded packets |
| A | 0 | 16 | 0 |
| B | 0 | 16 | 0 |
| C | 0 | 16 | 0 |
| D | 0 | 16 | 0 |
| Quadrant | Total seconds | Saturated seconds | Saturation percentage |
|---|---|---|---|
| A | 8547 | 354 | 4.141804% |
| B | 8546 | 490 | 5.733677% |
| C | 8546 | 480 | 5.616663% |
| D | 8546 | 926 | 10.835479% |
Noise dominated data is calculated using 1-second bins in cleaned event files. If a bin has >2000 counts, and if more than 50% of those come from <1% of pixels, then it is considered to be noise-dominated and hence unusable.
| Quadrant | # 1 sec bins | Bins with >0 counts | Bins with >2000 counts | High rate bins dominated by noise | Noise dominated (total time) | Noise dominated (detector-on time) | Marked lightcurve |
|---|---|---|---|---|---|---|---|
| A | 10207 | 8549 | 165 | 165 | 1.62% | 1.93% | 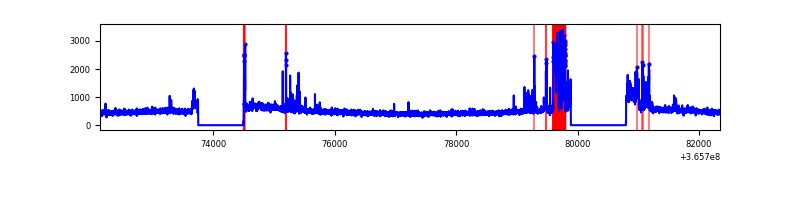 |
| B | 10206 | 8548 | 211 | 211 | 2.07% | 2.47% | 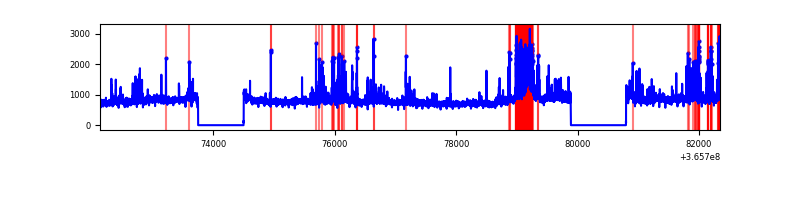 |
| C | 10206 | 8548 | 44 | 44 | 0.43% | 0.51% | 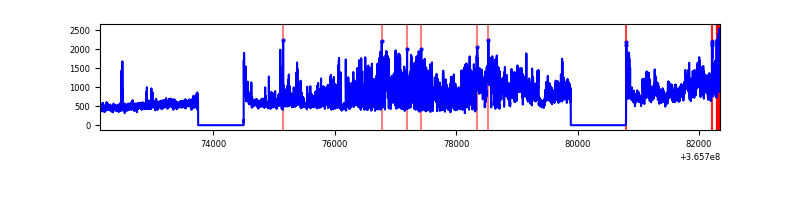 |
| D | 10206 | 8548 | 798 | 798 | 7.82% | 9.34% | 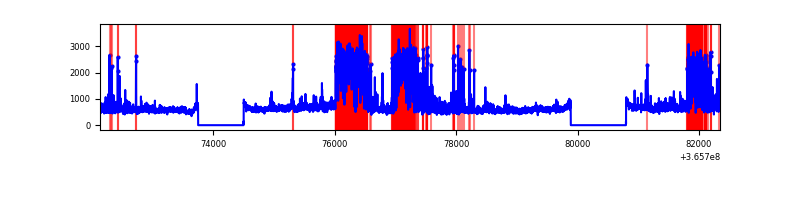 |
Top three noisy pixels from each quadrant. If the there are fewer than three noisy pixels in the level2.evt file, extra rows are filled as -1
| Pixel properties | Quadrant properties | ||||||
|---|---|---|---|---|---|---|---|
| Quadrant | DetID | PixID | Counts | Sigma | Mean | Median | Sigma |
| A | 15 | 174 | 760551 | 3638.44 | 1042 | 1019 | 208.8 |
| A | 12 | 96 | 27936 | 128.94 | 1042 | 1019 | 208.8 |
| A | 0 | 13 | 22698 | 103.85 | 1042 | 1019 | 208.8 |
| B | 6 | 159 | 2384306 | 12140.62 | 1032 | 1004 | 196.3 |
| B | 10 | 245 | 703381 | 3577.93 | 1032 | 1004 | 196.3 |
| B | 5 | 172 | 185530 | 939.98 | 1032 | 1004 | 196.3 |
| C | 3 | 233 | 2872152 | 12158.38 | 999 | 1004 | 236.1 |
| C | 14 | 238 | 165018 | 694.55 | 999 | 1004 | 236.1 |
| C | 0 | 10 | 61528 | 256.3 | 999 | 1004 | 236.1 |
| D | 13 | 249 | 2080619 | 8913.57 | 973 | 946 | 233.3 |
| D | 8 | 195 | 1128231 | 4831.59 | 973 | 946 | 233.3 |
| D | 11 | 176 | 130610 | 555.75 | 973 | 946 | 233.3 |
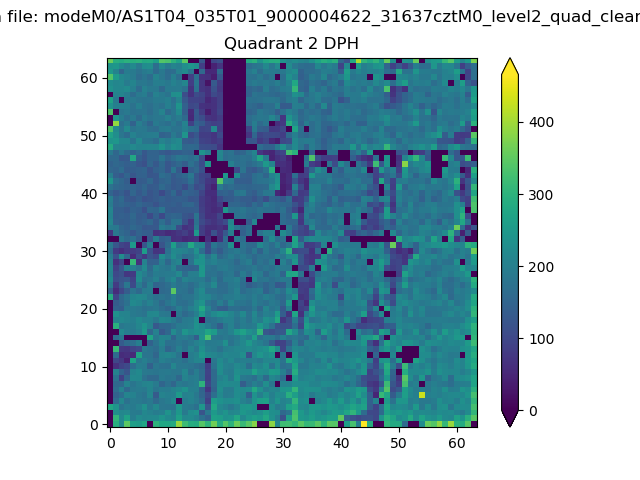
Histogram calculated using DETX and DETY for each event in the final _common_clean file
| Quadrant A | 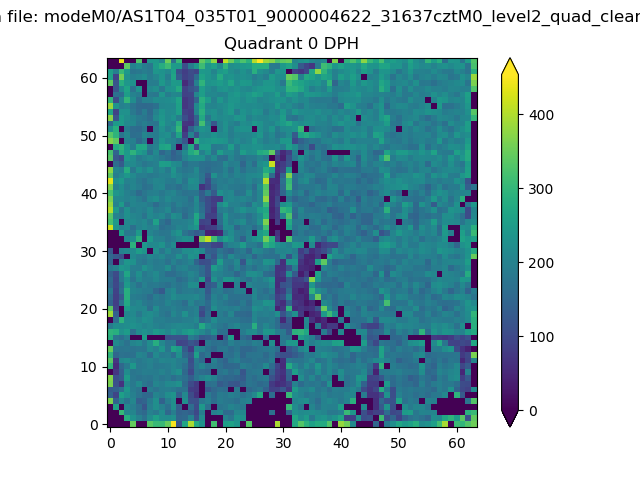 |
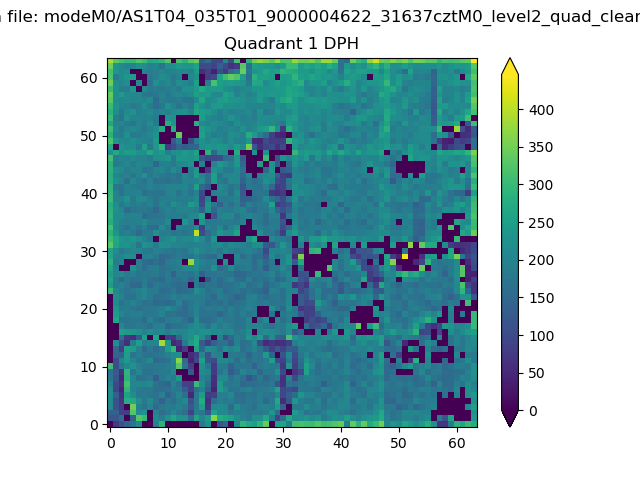 |
Quadrant B |
|---|---|---|---|
| Quadrant D | 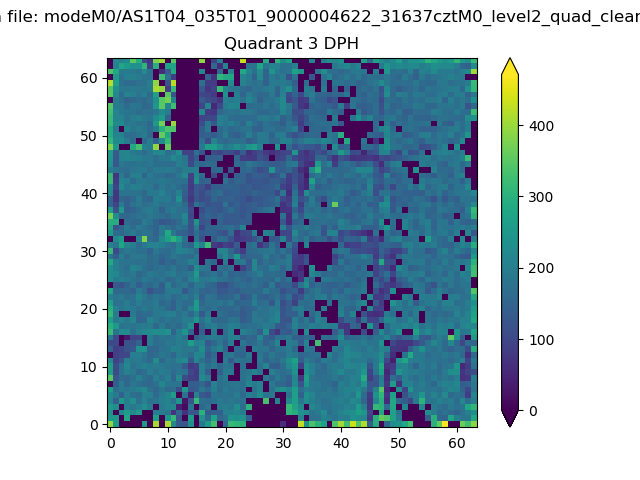 |
 |
Quadrant C |
| Plot type | Count rate plots | Images |
|---|---|---|
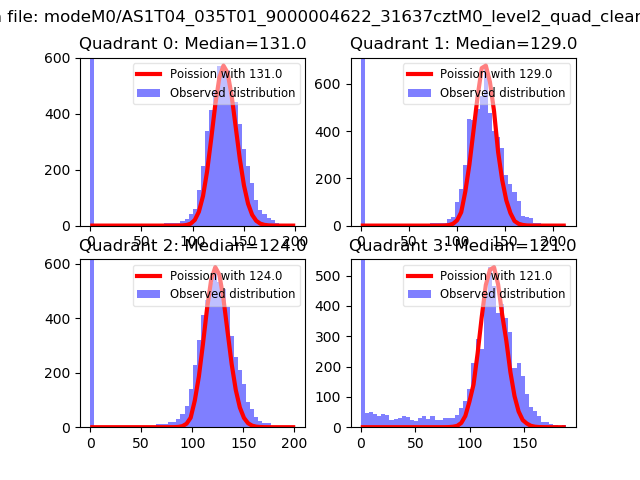
| Comparison with Poisson distribution Blue bars denote a histogram of data divided into 1 sec bins. Red curve is a Poisson curve with rate = median count rate of data. |
 |
 |
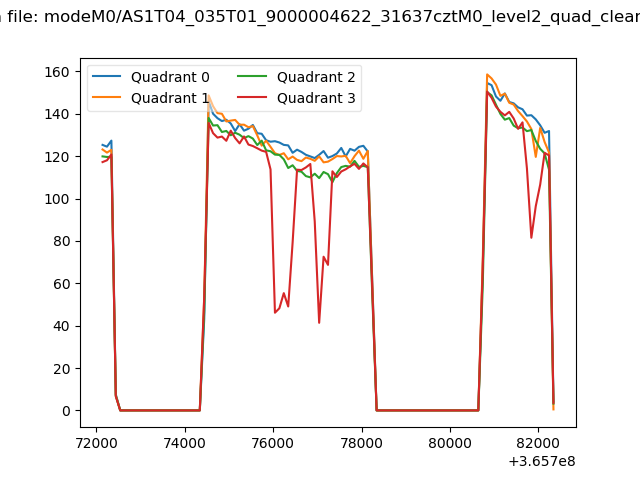
| Quadrant-wise count rates Data is divided into 100 sec bins |
 |
|
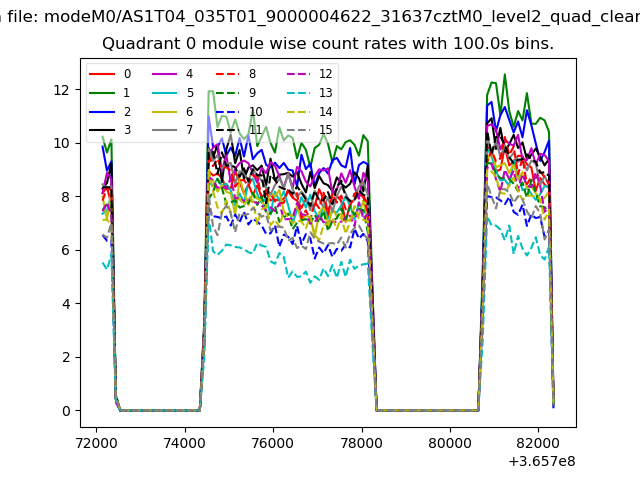
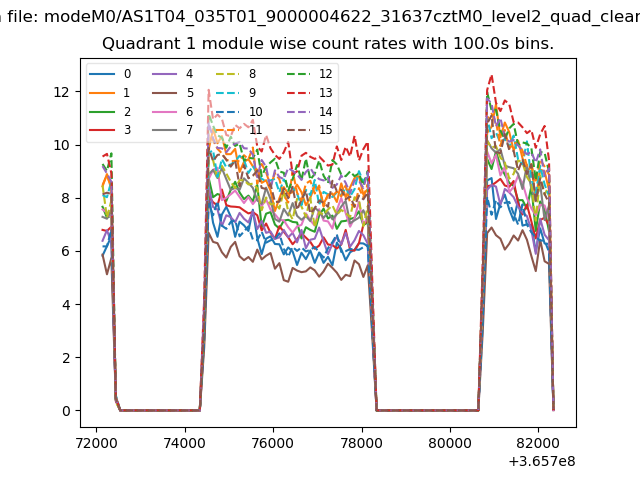
| Module-wise count rates for Quadrant A Data is divided into 100 sec bins |
 |
 |
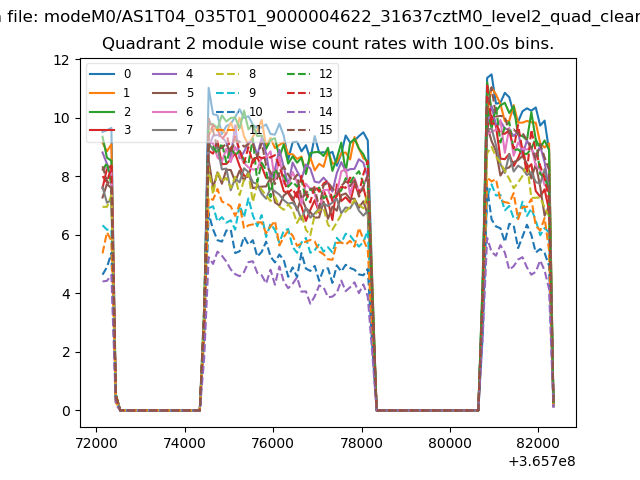
| Module-wise count rates for Quadrant B Data is divided into 100 sec bins |
 |
 |
| Module-wise count rates for Quadrant C Data is divided into 100 sec bins |
 |
 |
| Module-wise count rates for Quadrant D Data is divided into 100 sec bins |
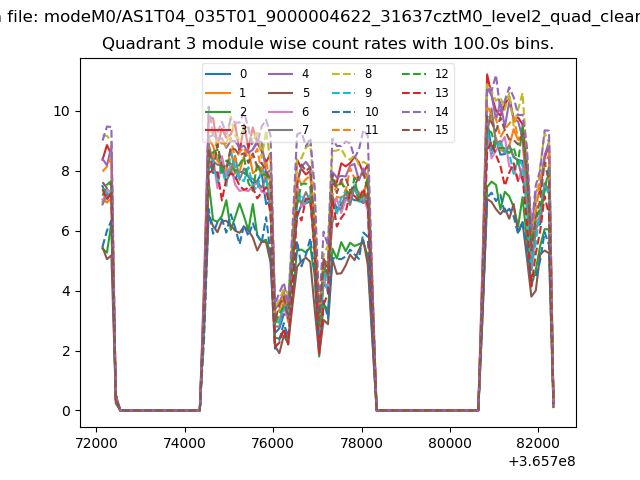 |
 |
| Parameter | Plot |
|---|---|
| CZT HV Monitor | 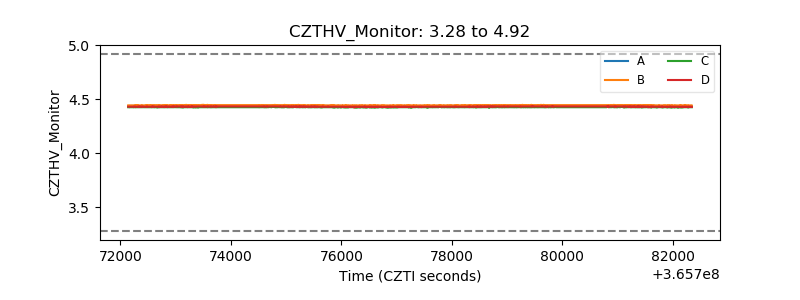 |
| D_VDD | 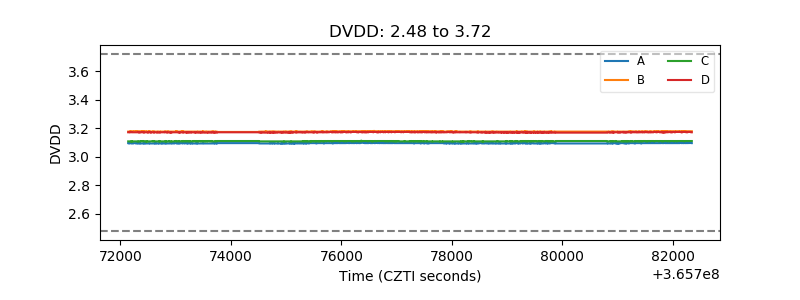 |
| Temperature 1 | 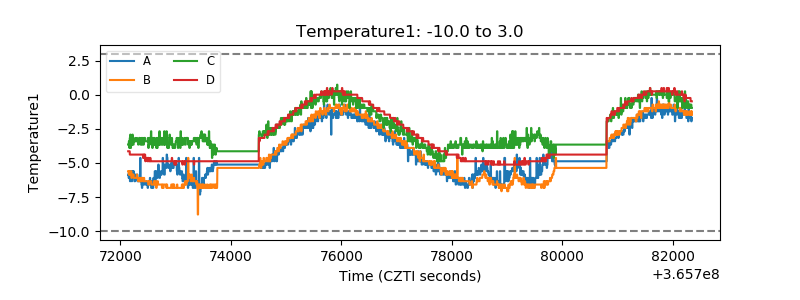 |
| Veto HV Monitor | 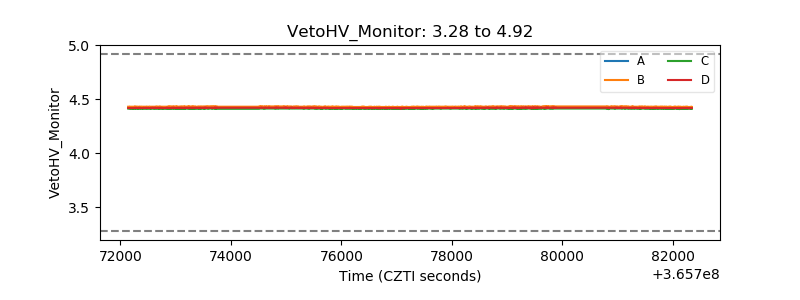 |
| Veto LLD |  |
| Alpha Counter | 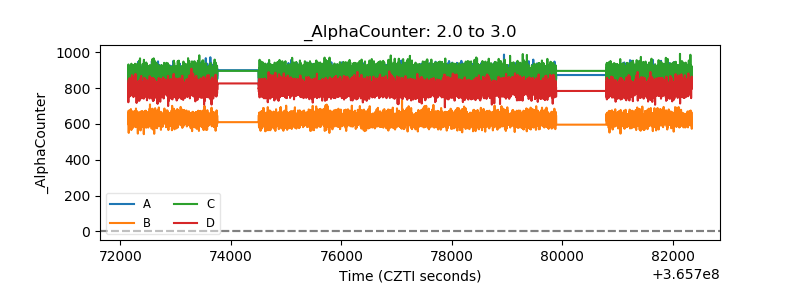 |
| _CPM_Rate | 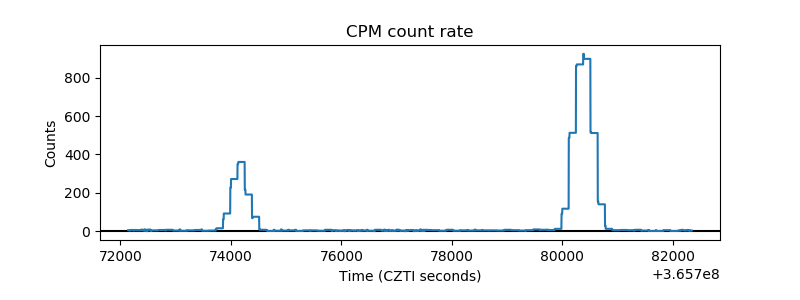 |
| CZT Counter | 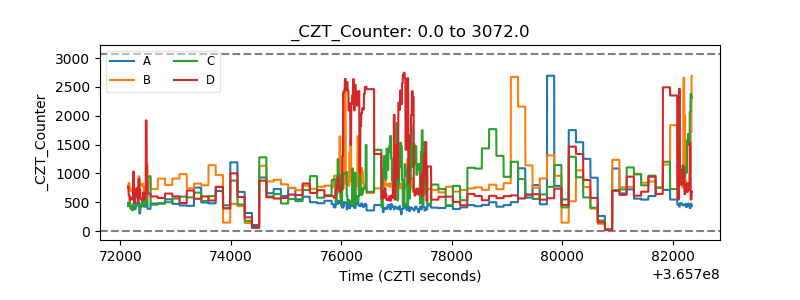 |
| +2.5 Volts monitor | 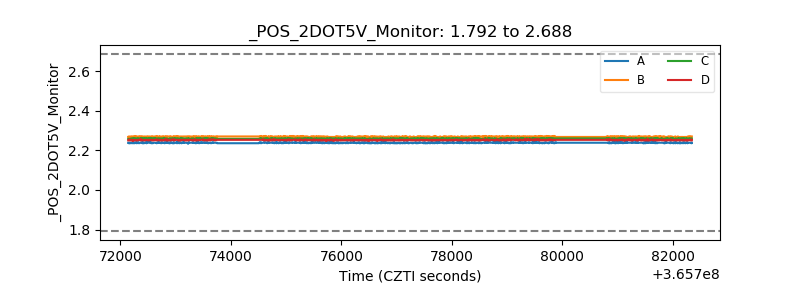 |
| +5 Volts monitor |  |
| _ROLL_ROT | 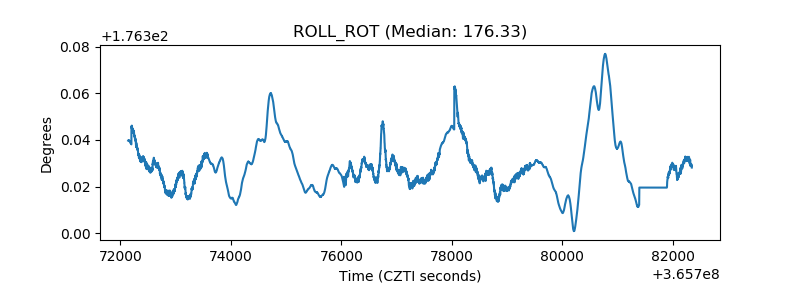 |
| _Roll_DEC | 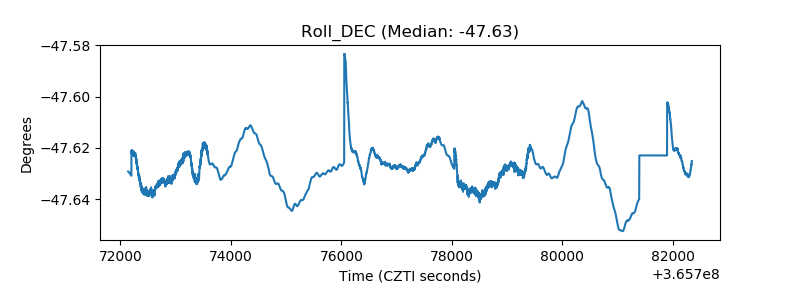 |
| _Roll_RA | 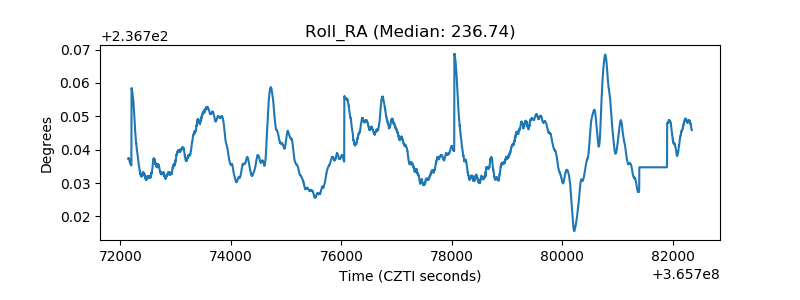 |
| Veto Counter | 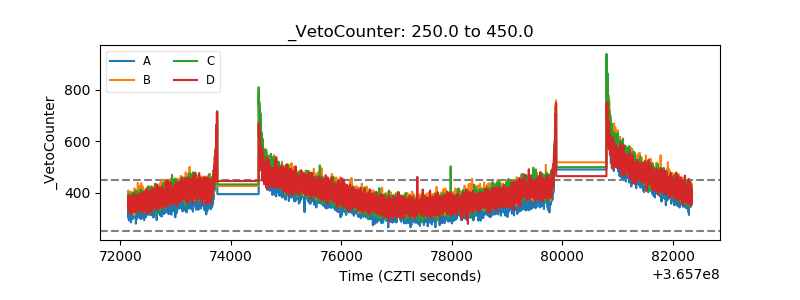 |