| Param | Original file | Final file |
|---|---|---|
| Filename | modeM0/AS1T04_035T01_9000004622_31638cztM0_level2.evt | modeM0/AS1T04_035T01_9000004622_31638cztM0_level2_quad_clean.evt |
| Size (bytes) | 707,964,480 | 79,260,480 |
| Size | 675.2 MB | 75.6 MB |
| Events in quadrant A | 2,818,804 | 547,083 |
| Events in quadrant B | 6,017,968 | 486,466 |
| Events in quadrant C | 6,717,110 | 492,647 |
| Events in quadrant D | 5,492,312 | 464,137 |
| Mode M0 | |||
|---|---|---|---|
| Quadrant | BADHDUFLAG | Total packets | Discarded packets |
| A | 0 | 12281 | 1 |
| B | 0 | 21985 | 1 |
| C | 0 | 24079 | 1 |
| D | 0 | 20328 | 1 |
| Mode SS | |||
|---|---|---|---|
| Quadrant | BADHDUFLAG | Total packets | Discarded packets |
| A | 0 | 118 | 0 |
| B | 0 | 118 | 0 |
| C | 0 | 118 | 0 |
| D | 0 | 118 | 0 |
| Mode M9 | |||
|---|---|---|---|
| Quadrant | BADHDUFLAG | Total packets | Discarded packets |
| A | 0 | 11 | 0 |
| B | 0 | 11 | 0 |
| C | 0 | 11 | 0 |
| D | 0 | 11 | 0 |
| Quadrant | Total seconds | Saturated seconds | Saturation percentage |
|---|---|---|---|
| A | 5856 | 40 | 0.683060% |
| B | 5856 | 764 | 13.046448% |
| C | 5857 | 1004 | 17.141882% |
| D | 5857 | 666 | 11.371009% |
Noise dominated data is calculated using 1-second bins in cleaned event files. If a bin has >2000 counts, and if more than 50% of those come from <1% of pixels, then it is considered to be noise-dominated and hence unusable.
| Quadrant | # 1 sec bins | Bins with >0 counts | Bins with >2000 counts | High rate bins dominated by noise | Noise dominated (total time) | Noise dominated (detector-on time) | Marked lightcurve |
|---|---|---|---|---|---|---|---|
| A | 6926 | 5857 | 0 | 0 | 0.00% | 0.00% | 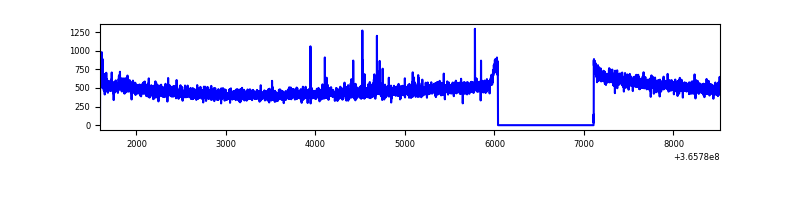 |
| B | 6926 | 5857 | 550 | 550 | 7.94% | 9.39% | 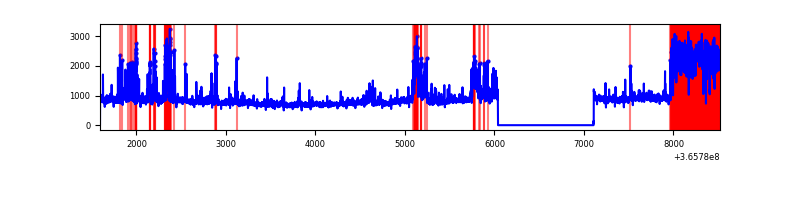 |
| C | 6927 | 5858 | 270 | 270 | 3.90% | 4.61% | 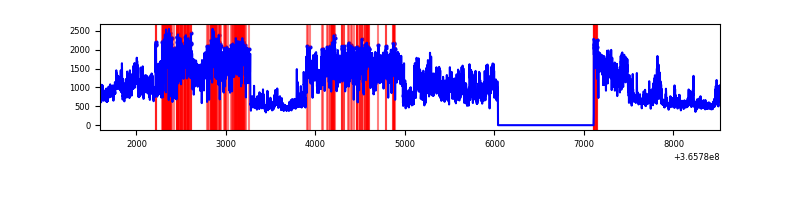 |
| D | 6927 | 5858 | 591 | 591 | 8.53% | 10.09% | 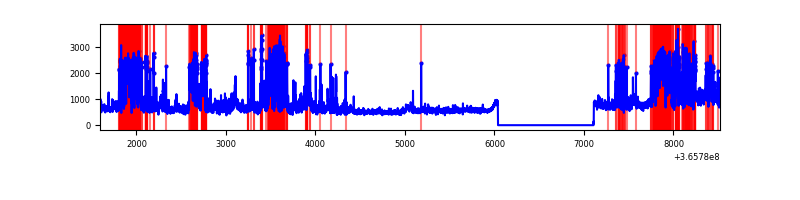 |
Top three noisy pixels from each quadrant. If the there are fewer than three noisy pixels in the level2.evt file, extra rows are filled as -1
| Pixel properties | Quadrant properties | ||||||
|---|---|---|---|---|---|---|---|
| Quadrant | DetID | PixID | Counts | Sigma | Mean | Median | Sigma |
| A | 0 | 13 | 17222 | 113.83 | 723 | 710 | 145.1 |
| A | 13 | 254 | 11791 | 76.39 | 723 | 710 | 145.1 |
| A | 3 | 137 | 6832 | 42.2 | 723 | 710 | 145.1 |
| B | 6 | 159 | 1621392 | 12733.35 | 665 | 649 | 127.3 |
| B | 5 | 172 | 1197457 | 9402.71 | 665 | 649 | 127.3 |
| B | 10 | 245 | 377905 | 2963.91 | 665 | 649 | 127.3 |
| C | 3 | 233 | 3970737 | 25842.59 | 655 | 659 | 153.6 |
| C | 14 | 238 | 104918 | 678.65 | 655 | 659 | 153.6 |
| C | 0 | 10 | 51988 | 334.11 | 655 | 659 | 153.6 |
| D | 13 | 249 | 1385758 | 8921.84 | 653 | 635 | 155.3 |
| D | 8 | 195 | 1016698 | 6544.66 | 653 | 635 | 155.3 |
| D | 11 | 176 | 456896 | 2938.86 | 653 | 635 | 155.3 |
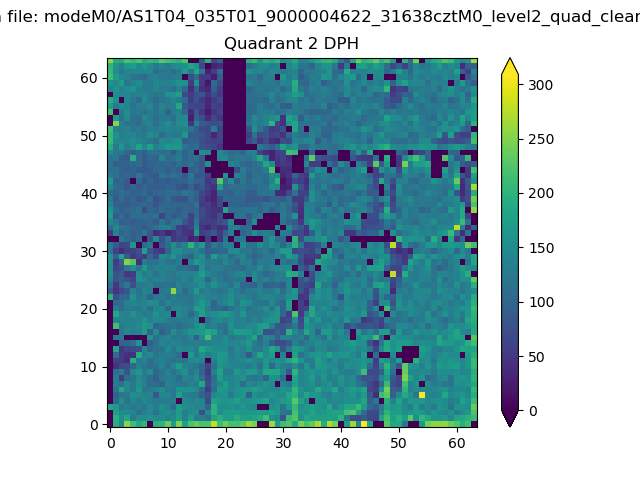
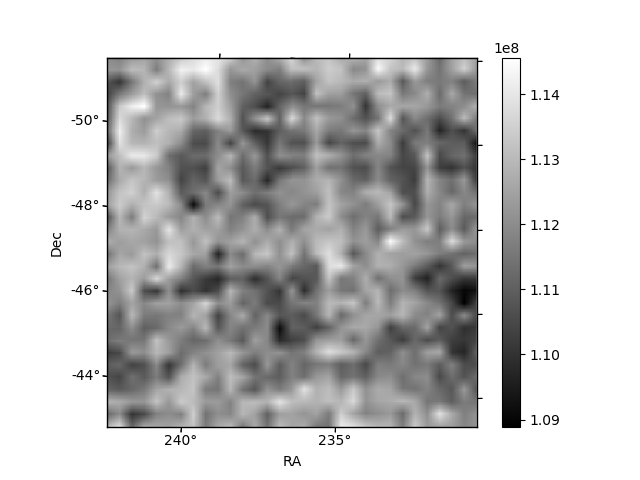
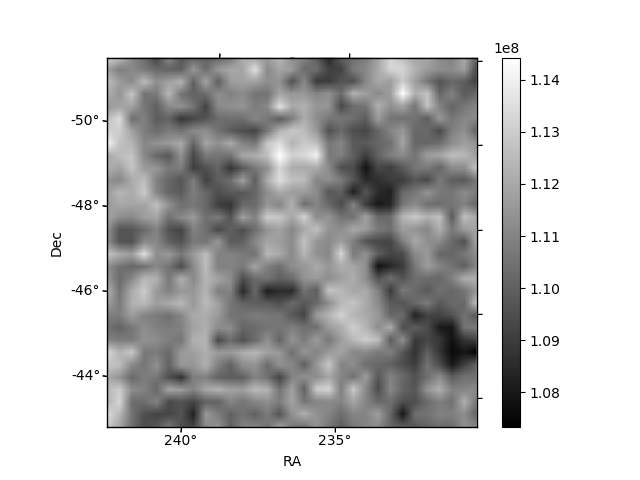
Histogram calculated using DETX and DETY for each event in the final _common_clean file
| Quadrant A | 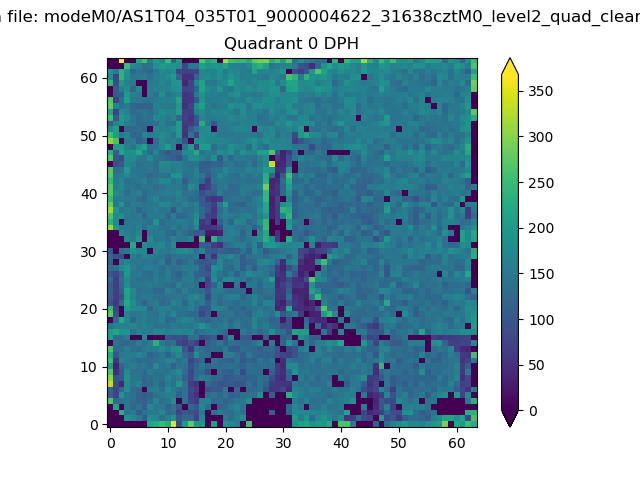 |
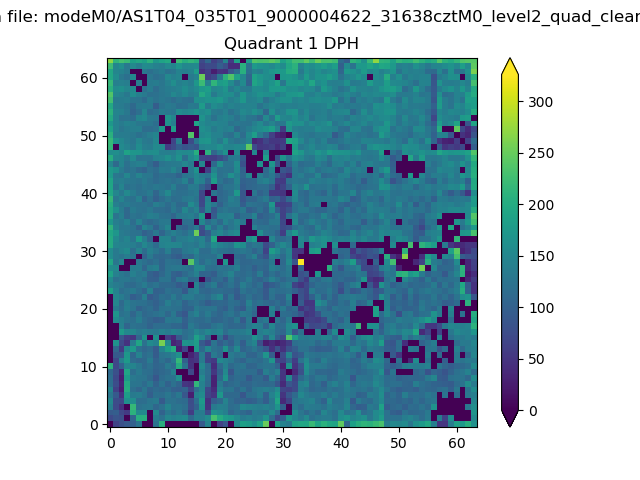 |
Quadrant B |
|---|---|---|---|
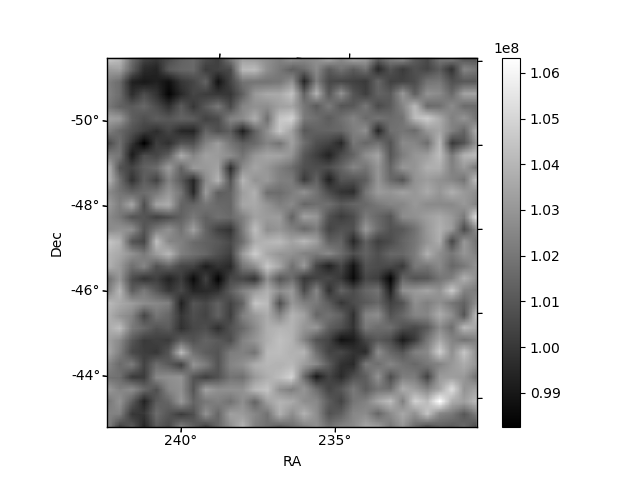
| Quadrant D | 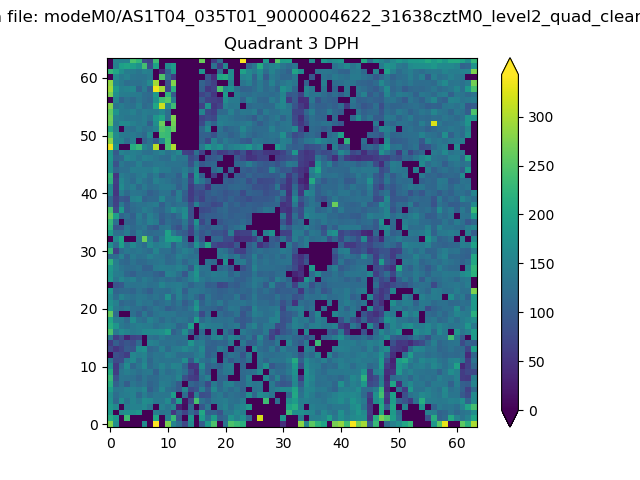 |
 |
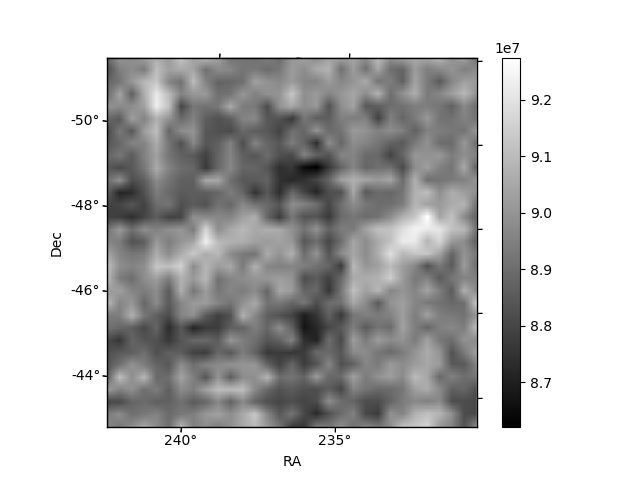
Quadrant C |
| Plot type | Count rate plots | Images |
|---|---|---|
| Comparison with Poisson distribution Blue bars denote a histogram of data divided into 1 sec bins. Red curve is a Poisson curve with rate = median count rate of data. |
 |
 |
| Quadrant-wise count rates Data is divided into 100 sec bins |
 |
|
| Module-wise count rates for Quadrant A Data is divided into 100 sec bins |
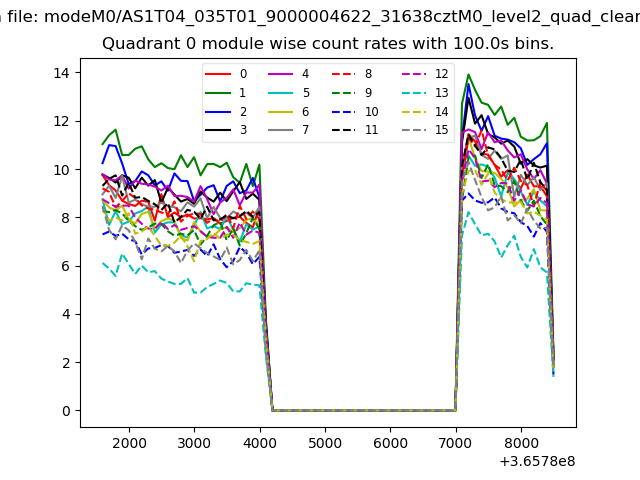 |
 |
| Module-wise count rates for Quadrant B Data is divided into 100 sec bins |
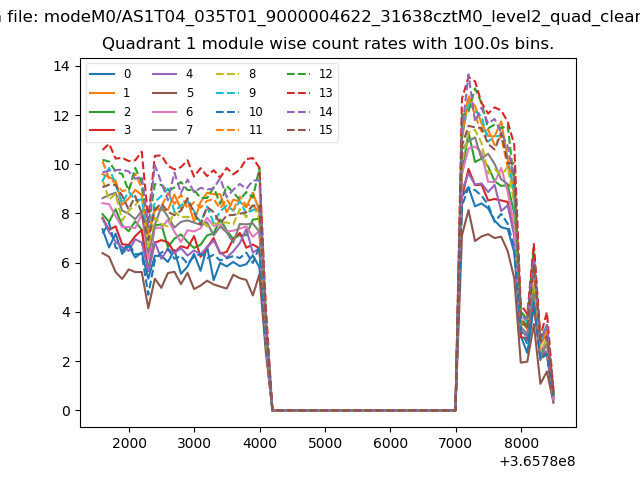 |
 |
| Module-wise count rates for Quadrant C Data is divided into 100 sec bins |
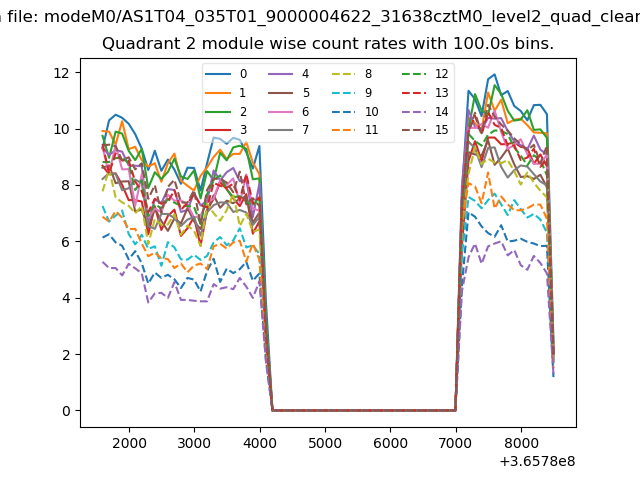 |
 |
| Module-wise count rates for Quadrant D Data is divided into 100 sec bins |
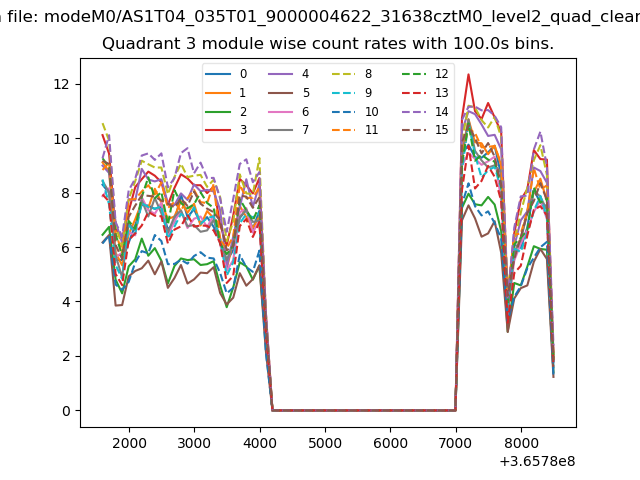 |
 |
| Parameter | Plot |
|---|---|
| CZT HV Monitor | 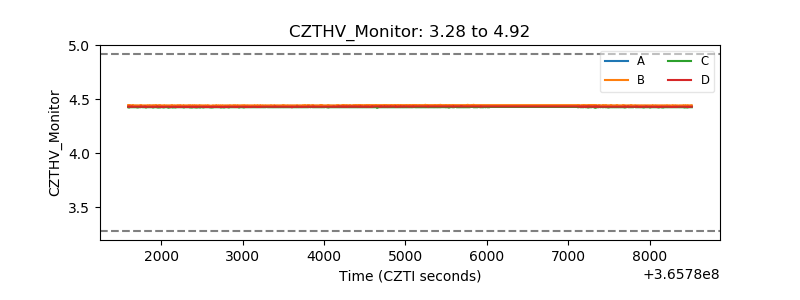 |
| D_VDD | 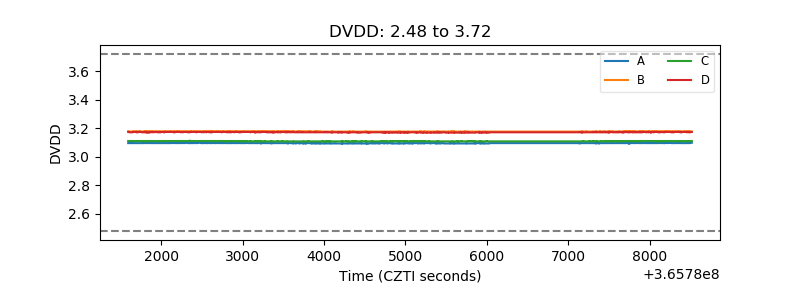 |
| Temperature 1 | 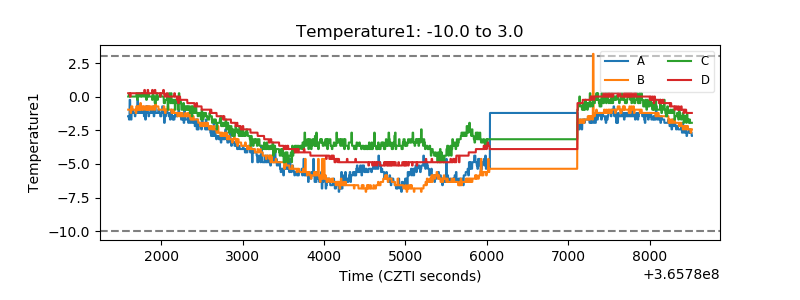 |
| Veto HV Monitor | 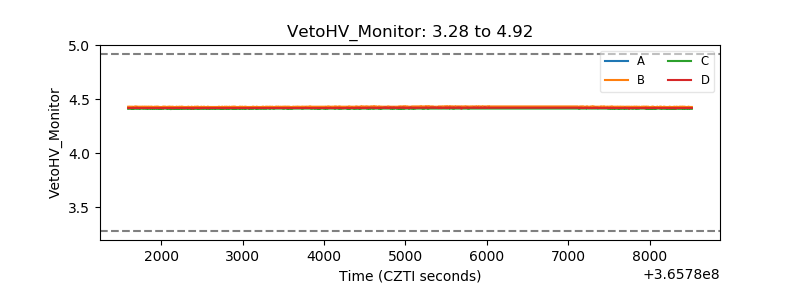 |
| Veto LLD | 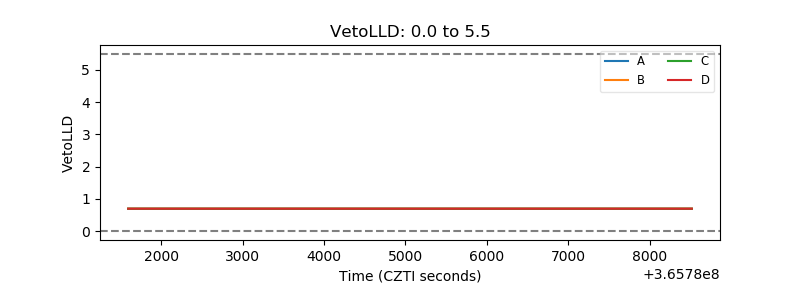 |
| Alpha Counter |  |
| _CPM_Rate |  |
| CZT Counter | 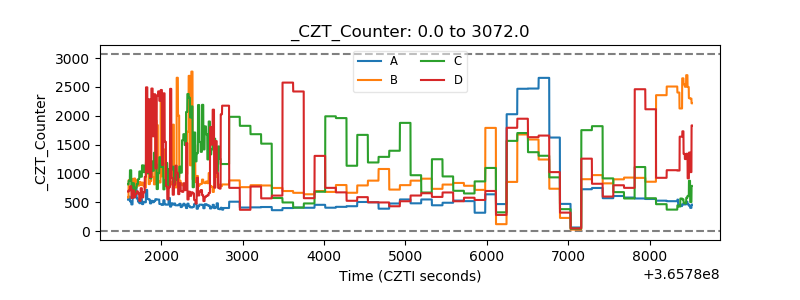 |
| +2.5 Volts monitor |  |
| +5 Volts monitor |  |
| _ROLL_ROT | 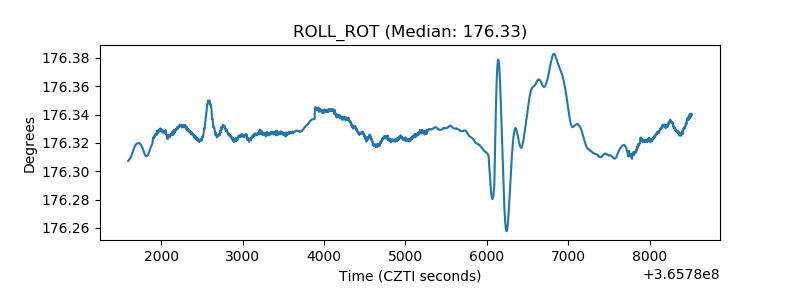 |
| _Roll_DEC | 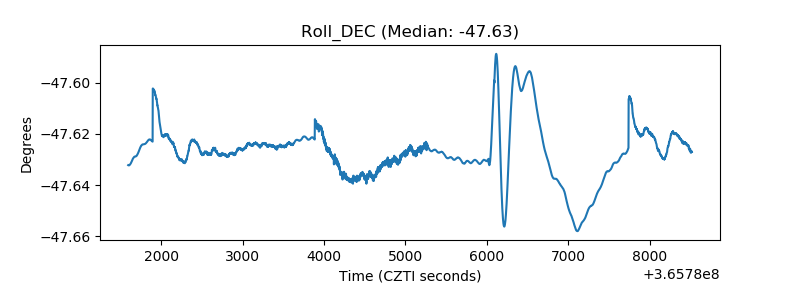 |
| _Roll_RA | 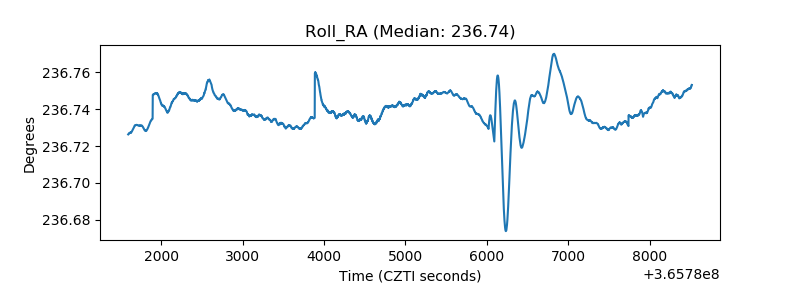 |
| Veto Counter | 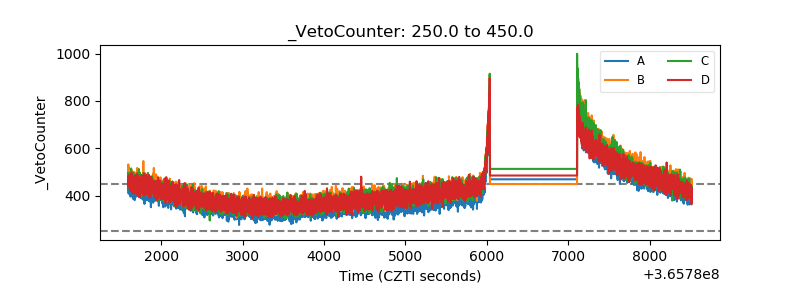 |