| Param | Original file | Final file |
|---|---|---|
| Filename | modeM0/AS1T04_035T01_9000004622_31640cztM0_level2.evt | modeM0/AS1T04_035T01_9000004622_31640cztM0_level2_quad_clean.evt |
| Size (bytes) | 676,206,720 | 90,181,440 |
| Size | 644.9 MB | 86.0 MB |
| Events in quadrant A | 3,288,804 | 632,028 |
| Events in quadrant B | 6,618,734 | 551,814 |
| Events in quadrant C | 4,161,358 | 577,042 |
| Events in quadrant D | 5,987,469 | 532,568 |
| Mode M0 | |||
|---|---|---|---|
| Quadrant | BADHDUFLAG | Total packets | Discarded packets |
| A | 0 | 13809 | 1 |
| B | 0 | 24145 | 1 |
| C | 0 | 16679 | 1 |
| D | 0 | 22243 | 1 |
| Mode SS | |||
|---|---|---|---|
| Quadrant | BADHDUFLAG | Total packets | Discarded packets |
| A | 0 | 128 | 0 |
| B | 0 | 128 | 0 |
| C | 0 | 128 | 0 |
| D | 0 | 128 | 0 |
| Mode M9 | |||
|---|---|---|---|
| Quadrant | BADHDUFLAG | Total packets | Discarded packets |
| A | 0 | 12 | 0 |
| B | 0 | 12 | 0 |
| C | 0 | 12 | 0 |
| D | 0 | 12 | 0 |
| Quadrant | Total seconds | Saturated seconds | Saturation percentage |
|---|---|---|---|
| A | 6255 | 59 | 0.943245% |
| B | 6256 | 914 | 14.609974% |
| C | 6256 | 275 | 4.395780% |
| D | 6256 | 549 | 8.775575% |
Noise dominated data is calculated using 1-second bins in cleaned event files. If a bin has >2000 counts, and if more than 50% of those come from <1% of pixels, then it is considered to be noise-dominated and hence unusable.
| Quadrant | # 1 sec bins | Bins with >0 counts | Bins with >2000 counts | High rate bins dominated by noise | Noise dominated (total time) | Noise dominated (detector-on time) | Marked lightcurve |
|---|---|---|---|---|---|---|---|
| A | 7440 | 6256 | 17 | 17 | 0.23% | 0.27% | 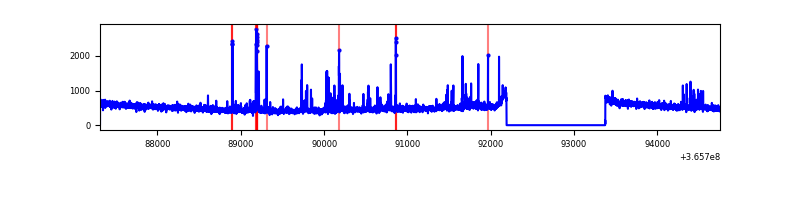 |
| B | 7441 | 6257 | 686 | 686 | 9.22% | 10.96% | 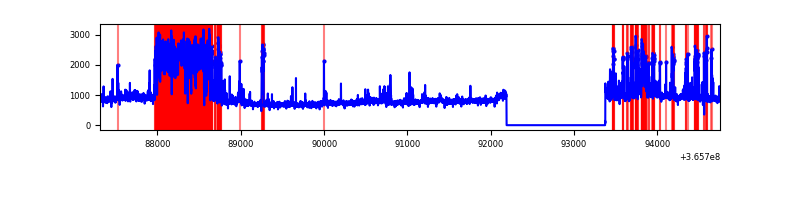 |
| C | 7441 | 6257 | 37 | 37 | 0.50% | 0.59% | 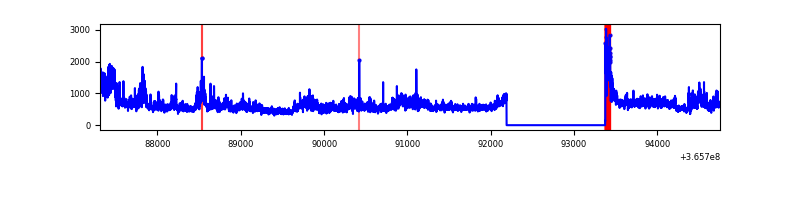 |
| D | 7441 | 6257 | 471 | 471 | 6.33% | 7.53% | 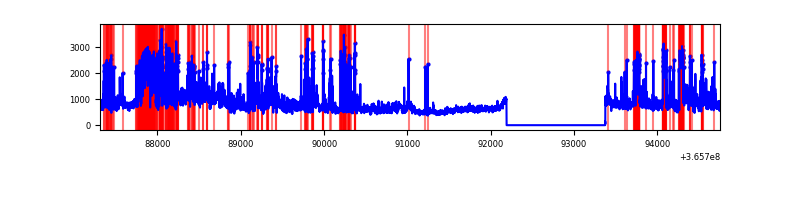 |
Top three noisy pixels from each quadrant. If the there are fewer than three noisy pixels in the level2.evt file, extra rows are filled as -1
| Pixel properties | Quadrant properties | ||||||
|---|---|---|---|---|---|---|---|
| Quadrant | DetID | PixID | Counts | Sigma | Mean | Median | Sigma |
| A | 0 | 13 | 175116 | 1095.83 | 799 | 784 | 159.1 |
| A | 15 | 174 | 25844 | 157.52 | 799 | 784 | 159.1 |
| A | 13 | 254 | 12932 | 76.36 | 799 | 784 | 159.1 |
| B | 6 | 159 | 1748379 | 12520.74 | 732 | 716 | 139.6 |
| B | 5 | 172 | 1660050 | 11887.93 | 732 | 716 | 139.6 |
| B | 4 | 80 | 76795 | 545.05 | 732 | 716 | 139.6 |
| C | 3 | 233 | 920251 | 5328.47 | 736 | 738 | 172.6 |
| C | 14 | 238 | 155479 | 896.71 | 736 | 738 | 172.6 |
| C | 0 | 10 | 123541 | 711.63 | 736 | 738 | 172.6 |
| D | 8 | 195 | 1437212 | 8298.01 | 722 | 704 | 173.1 |
| D | 13 | 249 | 903041 | 5212.36 | 722 | 704 | 173.1 |
| D | 11 | 176 | 592053 | 3415.93 | 722 | 704 | 173.1 |
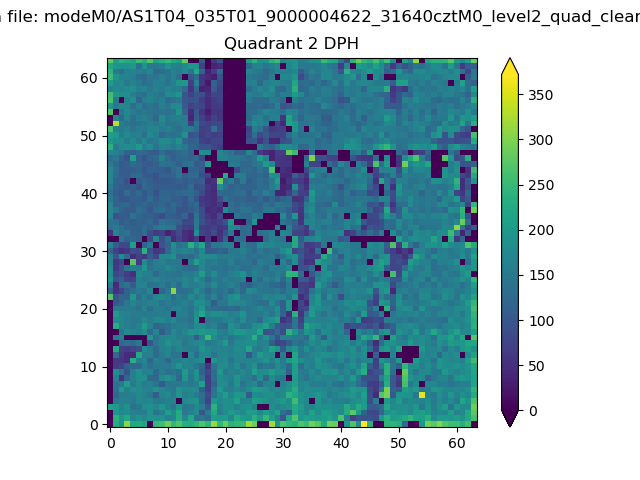
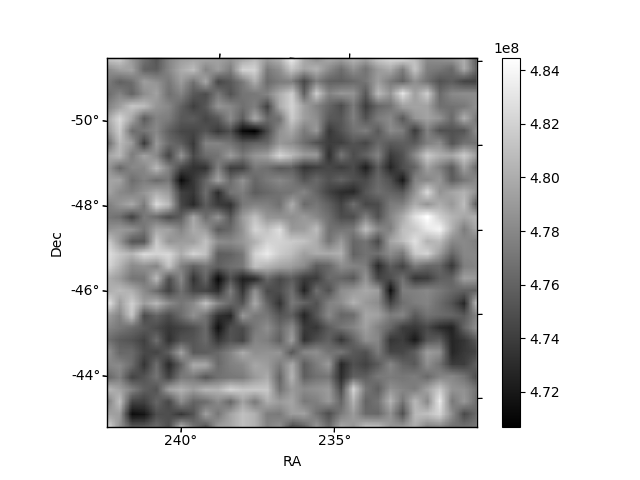
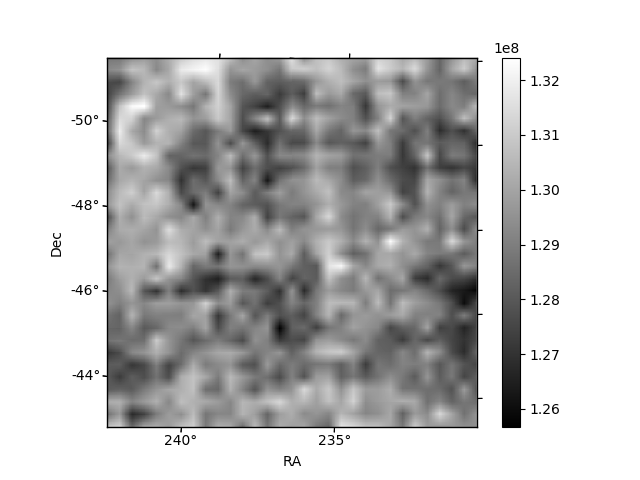
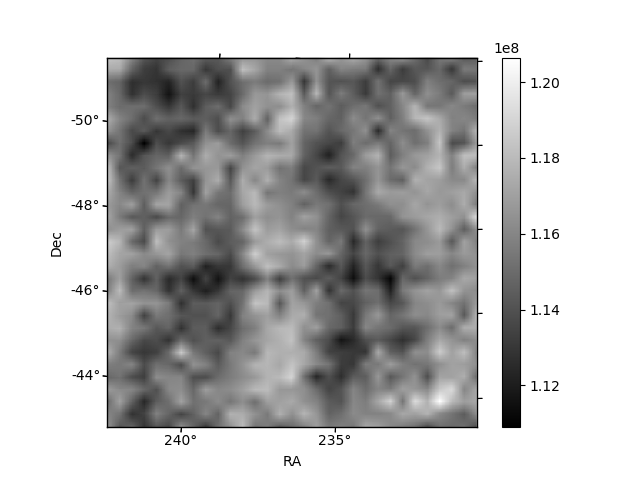
Histogram calculated using DETX and DETY for each event in the final _common_clean file
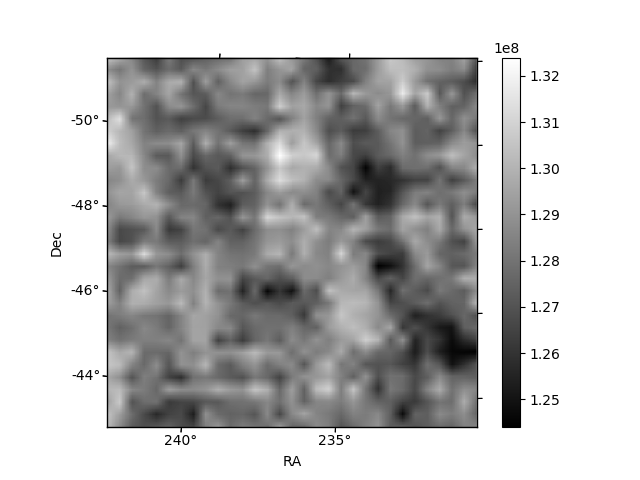
| Quadrant A | 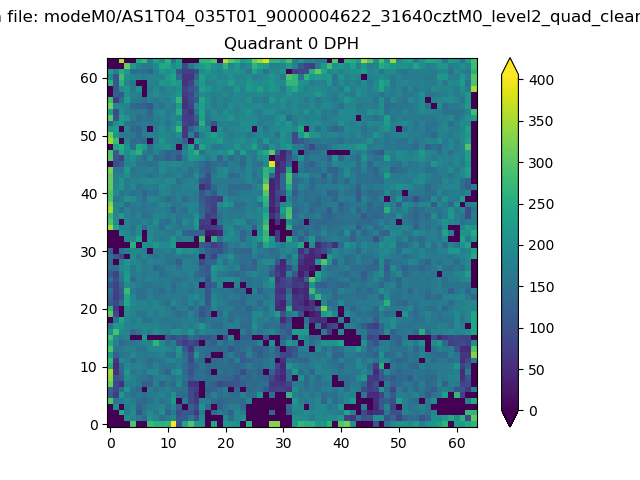 |
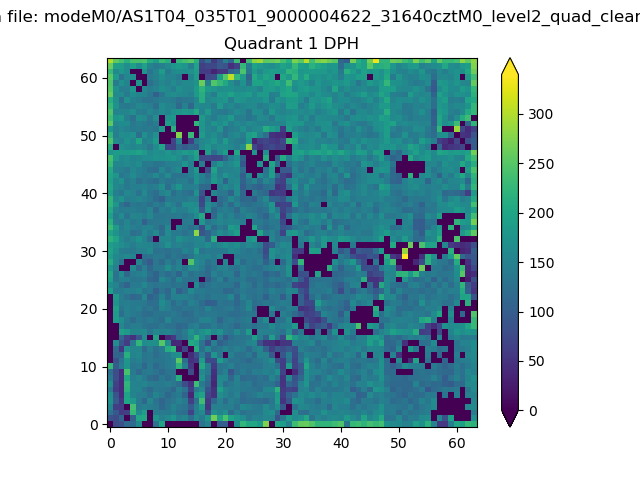 |
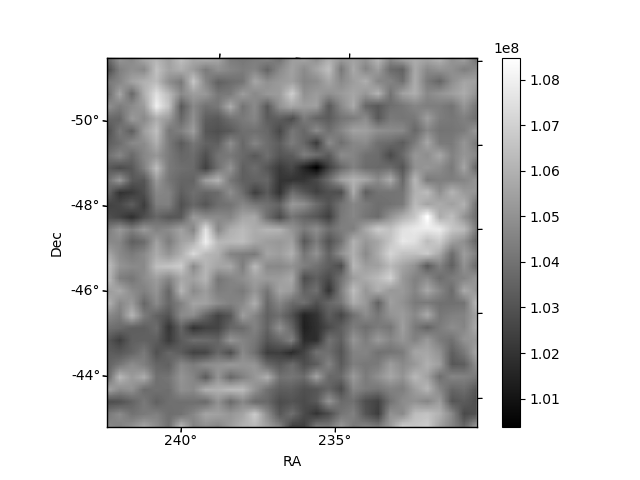
Quadrant B |
|---|---|---|---|
| Quadrant D | 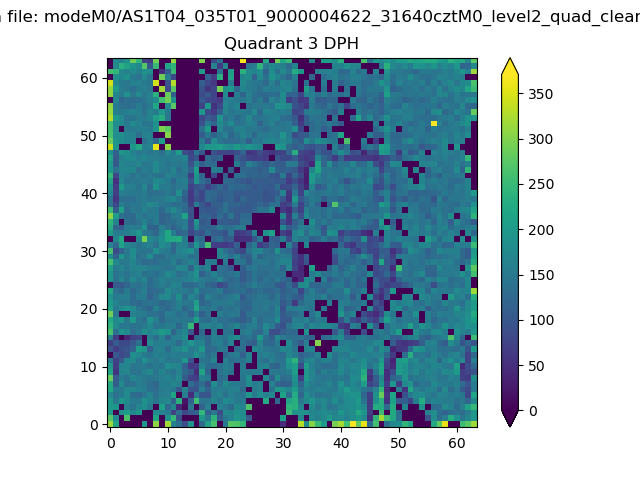 |
 |
Quadrant C |
| Plot type | Count rate plots | Images |
|---|---|---|
| Comparison with Poisson distribution Blue bars denote a histogram of data divided into 1 sec bins. Red curve is a Poisson curve with rate = median count rate of data. |
 |
 |
| Quadrant-wise count rates Data is divided into 100 sec bins |
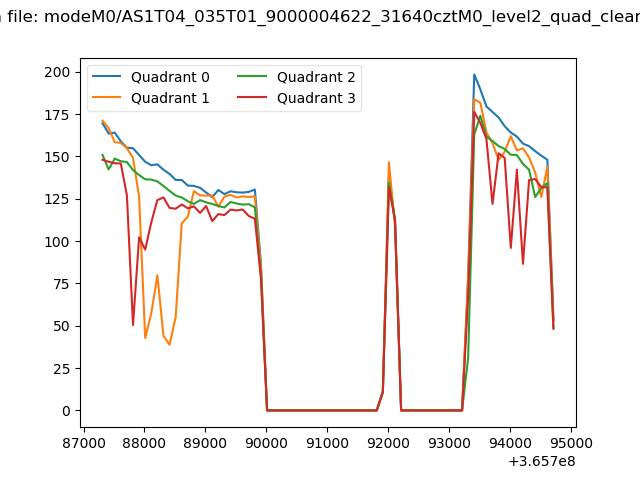 |
|
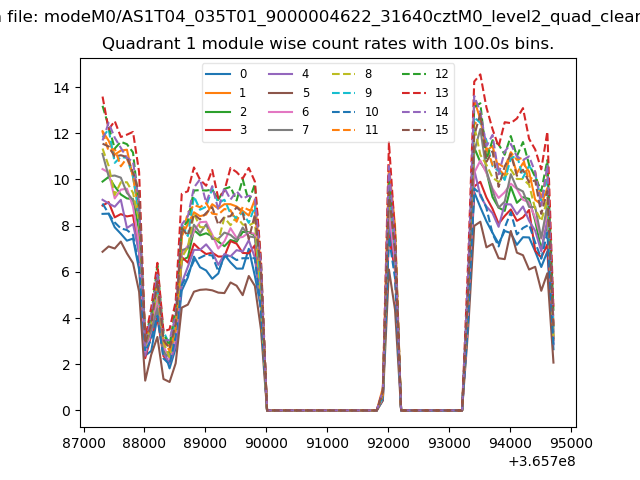
| Module-wise count rates for Quadrant A Data is divided into 100 sec bins |
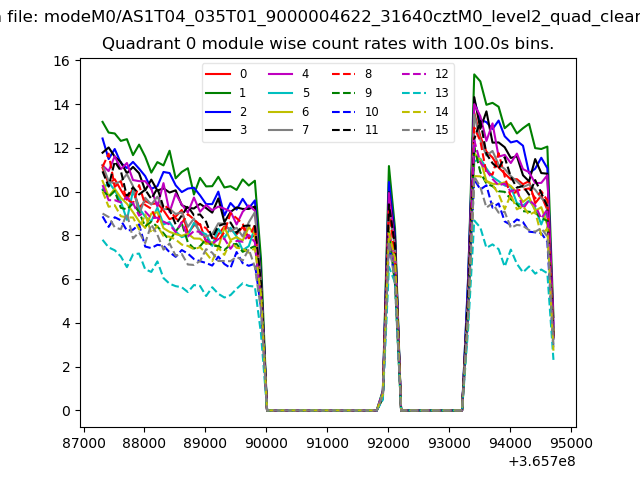 |
 |
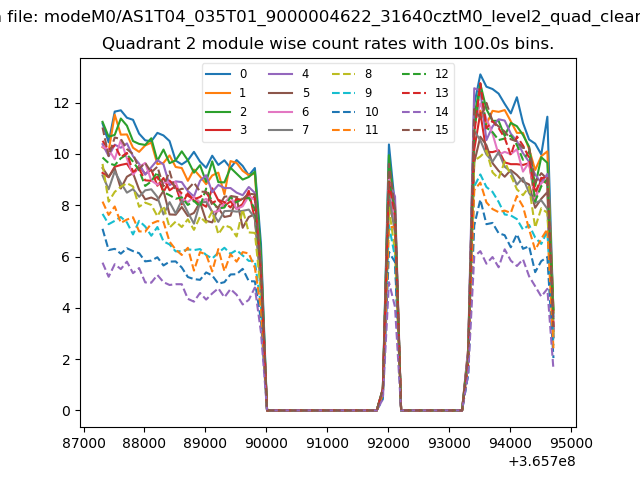
| Module-wise count rates for Quadrant B Data is divided into 100 sec bins |
 |
 |
| Module-wise count rates for Quadrant C Data is divided into 100 sec bins |
 |
 |
| Module-wise count rates for Quadrant D Data is divided into 100 sec bins |
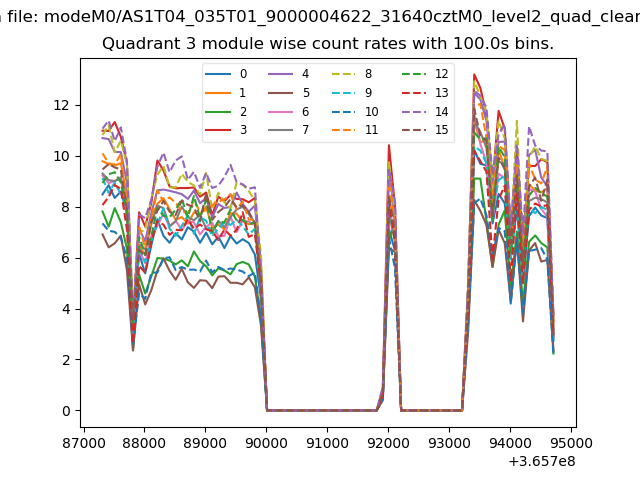 |
 |
| Parameter | Plot |
|---|---|
| CZT HV Monitor | 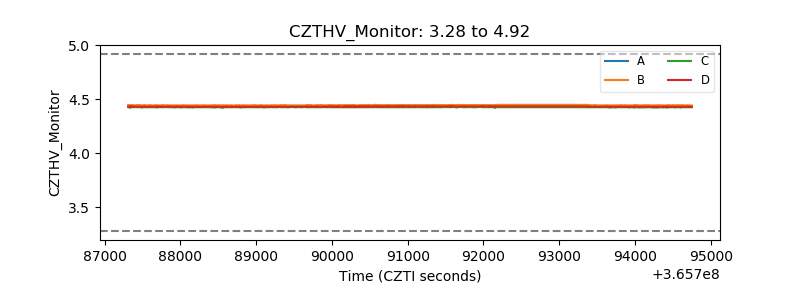 |
| D_VDD | 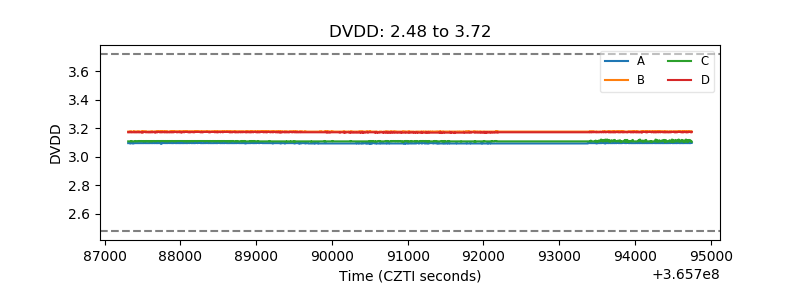 |
| Temperature 1 | 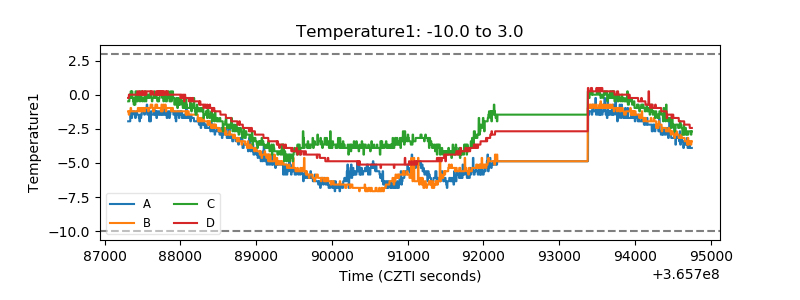 |
| Veto HV Monitor | 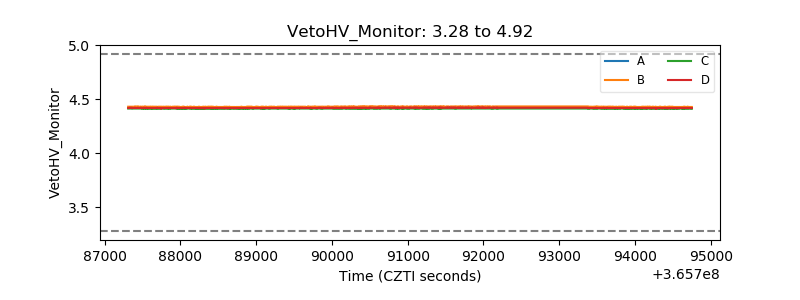 |
| Veto LLD | 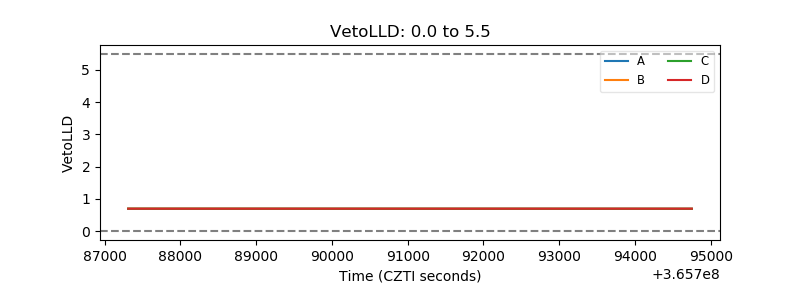 |
| Alpha Counter | 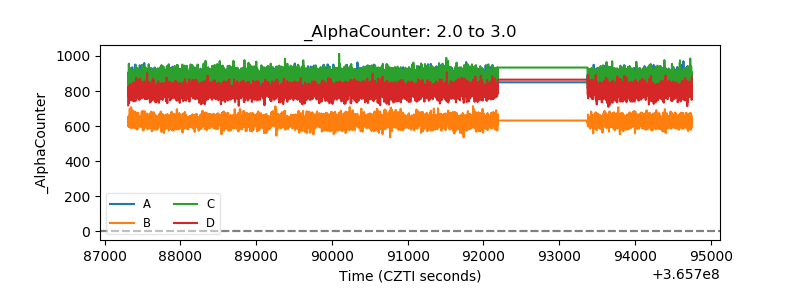 |
| _CPM_Rate | 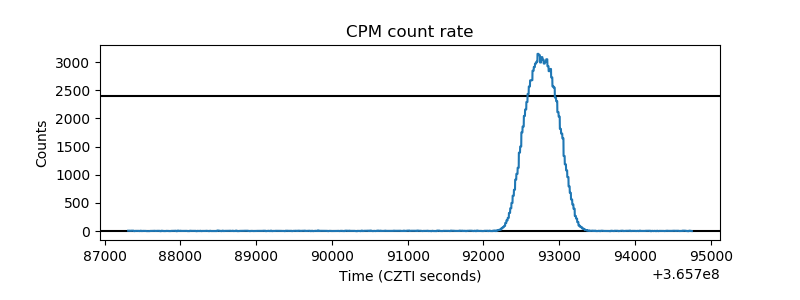 |
| CZT Counter | 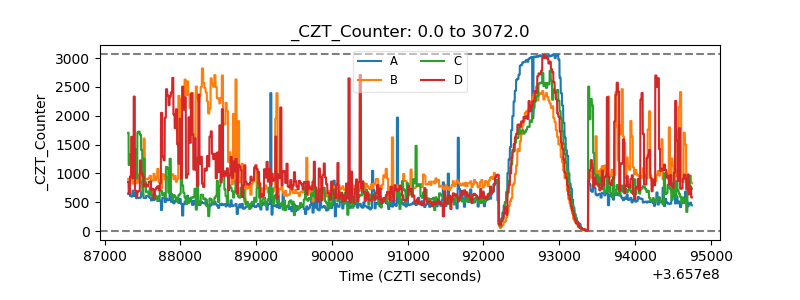 |
| +2.5 Volts monitor |  |
| +5 Volts monitor |  |
| _ROLL_ROT | 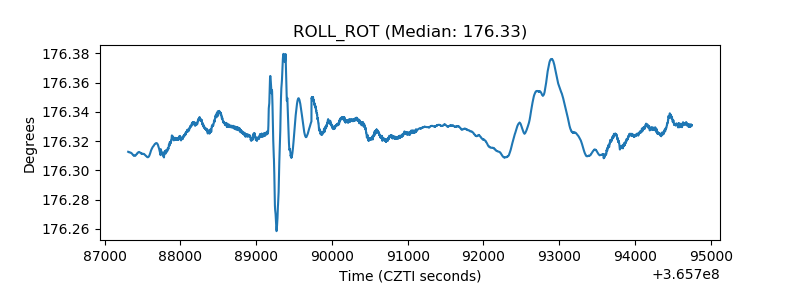 |
| _Roll_DEC | 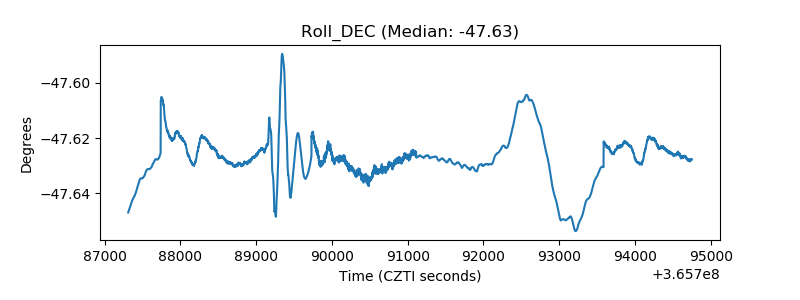 |
| _Roll_RA | 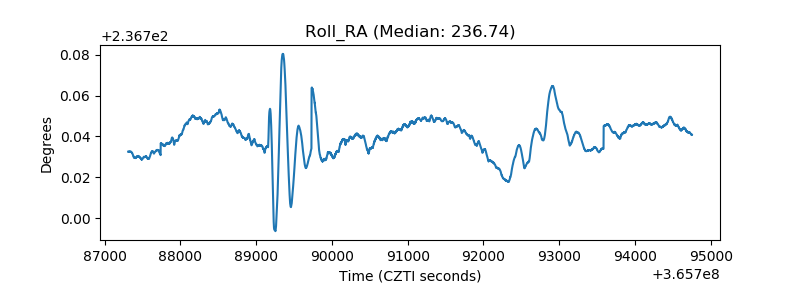 |
| Veto Counter | 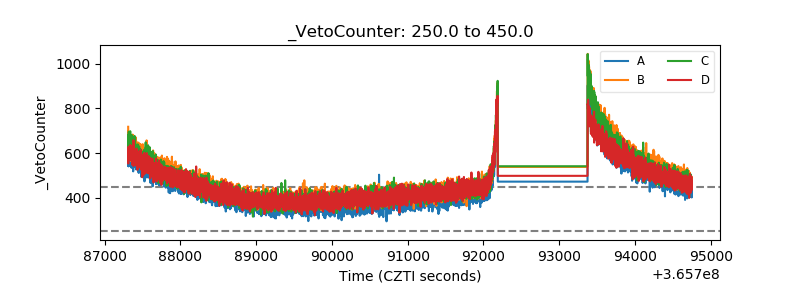 |