| Param | Original file | Final file |
|---|---|---|
| Filename | modeM0/AS1T04_035T01_9000004622_31641cztM0_level2.evt | modeM0/AS1T04_035T01_9000004622_31641cztM0_level2_quad_clean.evt |
| Size (bytes) | 662,333,760 | 85,438,080 |
| Size | 631.7 MB | 81.5 MB |
| Events in quadrant A | 5,288,931 | 557,594 |
| Events in quadrant B | 5,783,336 | 557,901 |
| Events in quadrant C | 4,103,880 | 546,688 |
| Events in quadrant D | 4,488,957 | 516,426 |
| Mode M0 | |||
|---|---|---|---|
| Quadrant | BADHDUFLAG | Total packets | Discarded packets |
| A | 0 | 19657 | 1 |
| B | 0 | 21349 | 1 |
| C | 0 | 16215 | 1 |
| D | 0 | 17321 | 1 |
| Mode SS | |||
|---|---|---|---|
| Quadrant | BADHDUFLAG | Total packets | Discarded packets |
| A | 0 | 118 | 0 |
| B | 0 | 118 | 0 |
| C | 0 | 118 | 0 |
| D | 0 | 118 | 0 |
| Mode M9 | |||
|---|---|---|---|
| Quadrant | BADHDUFLAG | Total packets | Discarded packets |
| A | 0 | 13 | 0 |
| B | 0 | 13 | 0 |
| C | 0 | 13 | 0 |
| D | 0 | 13 | 0 |
| Quadrant | Total seconds | Saturated seconds | Saturation percentage |
|---|---|---|---|
| A | 5843 | 536 | 9.173370% |
| B | 5843 | 459 | 7.855554% |
| C | 5843 | 292 | 4.997433% |
| D | 5843 | 241 | 4.124594% |
Noise dominated data is calculated using 1-second bins in cleaned event files. If a bin has >2000 counts, and if more than 50% of those come from <1% of pixels, then it is considered to be noise-dominated and hence unusable.
| Quadrant | # 1 sec bins | Bins with >0 counts | Bins with >2000 counts | High rate bins dominated by noise | Noise dominated (total time) | Noise dominated (detector-on time) | Marked lightcurve |
|---|---|---|---|---|---|---|---|
| A | 7133 | 5844 | 432 | 432 | 6.06% | 7.39% | 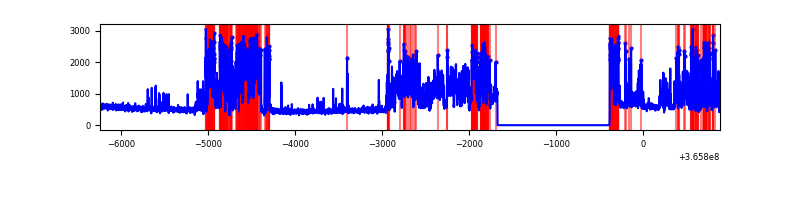 |
| B | 7133 | 5844 | 311 | 311 | 4.36% | 5.32% | 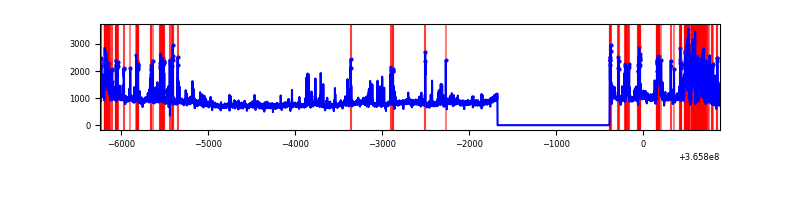 |
| C | 7133 | 5844 | 31 | 31 | 0.43% | 0.53% | 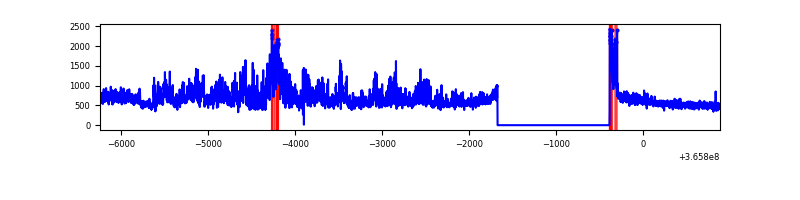 |
| D | 7133 | 5844 | 241 | 241 | 3.38% | 4.12% | 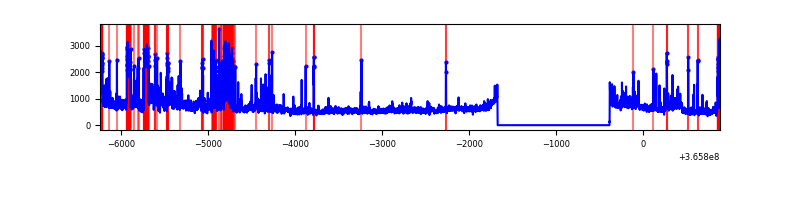 |
Top three noisy pixels from each quadrant. If the there are fewer than three noisy pixels in the level2.evt file, extra rows are filled as -1
| Pixel properties | Quadrant properties | ||||||
|---|---|---|---|---|---|---|---|
| Quadrant | DetID | PixID | Counts | Sigma | Mean | Median | Sigma |
| A | 0 | 13 | 2452378 | 16653.51 | 732 | 719 | 147.2 |
| A | 13 | 254 | 11684 | 74.48 | 732 | 719 | 147.2 |
| A | 15 | 174 | 9118 | 57.05 | 732 | 719 | 147.2 |
| B | 6 | 159 | 1757329 | 12836.76 | 726 | 711 | 136.8 |
| B | 5 | 172 | 702565 | 5128.91 | 726 | 711 | 136.8 |
| B | 10 | 245 | 274493 | 2000.7 | 726 | 711 | 136.8 |
| C | 3 | 233 | 909387 | 5600.45 | 698 | 704 | 162.3 |
| C | 14 | 238 | 190756 | 1171.34 | 698 | 704 | 162.3 |
| C | 0 | 10 | 127889 | 783.87 | 698 | 704 | 162.3 |
| D | 8 | 195 | 816093 | 4895.66 | 696 | 678 | 166.6 |
| D | 13 | 249 | 575003 | 3448.18 | 696 | 678 | 166.6 |
| D | 10 | 199 | 169694 | 1014.75 | 696 | 678 | 166.6 |
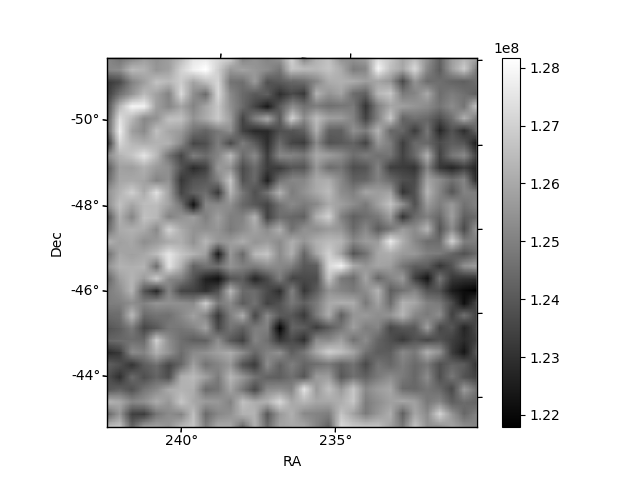
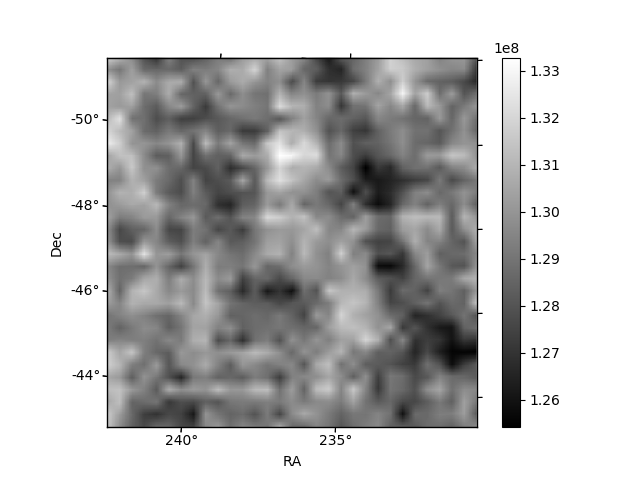
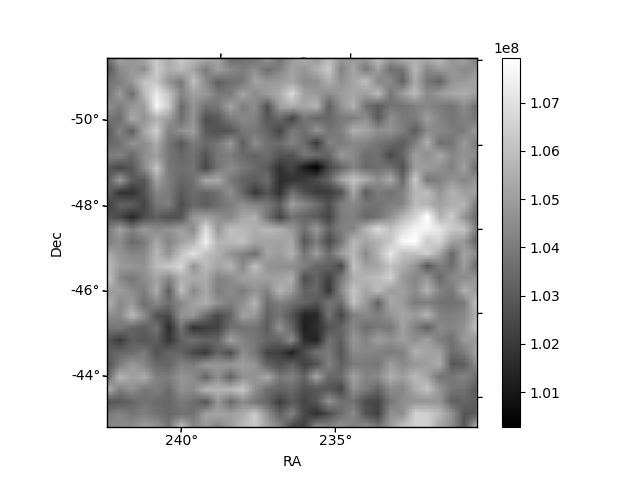
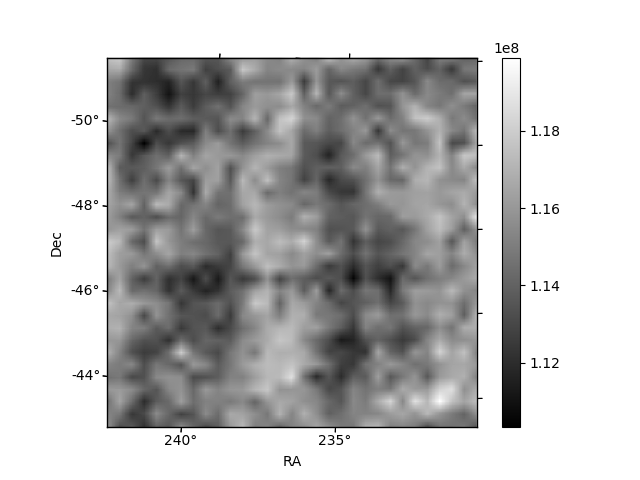
Histogram calculated using DETX and DETY for each event in the final _common_clean file
| Quadrant A | 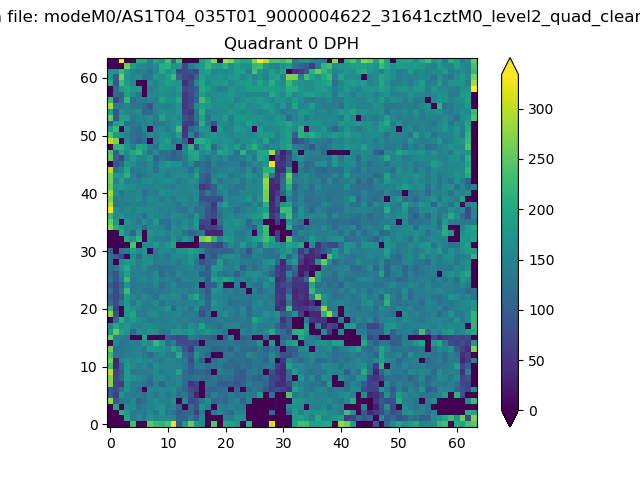 |
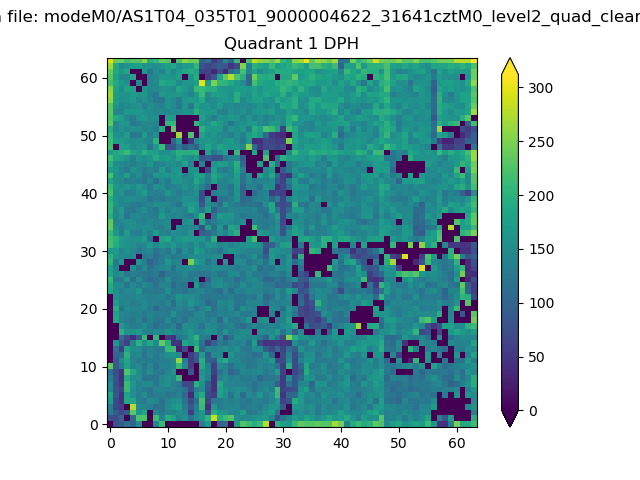 |
Quadrant B |
|---|---|---|---|
| Quadrant D |  |
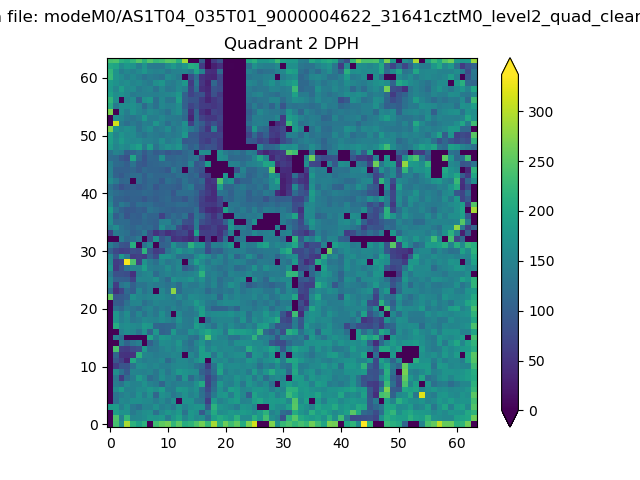 |
Quadrant C |
| Plot type | Count rate plots | Images |
|---|---|---|
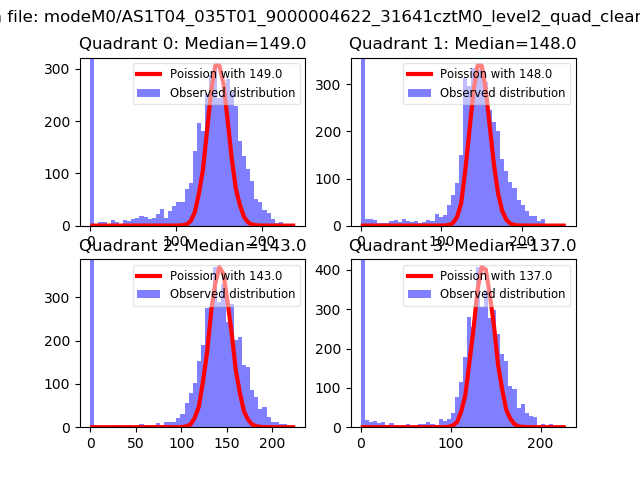
| Comparison with Poisson distribution Blue bars denote a histogram of data divided into 1 sec bins. Red curve is a Poisson curve with rate = median count rate of data. |
 |
 |
| Quadrant-wise count rates Data is divided into 100 sec bins |
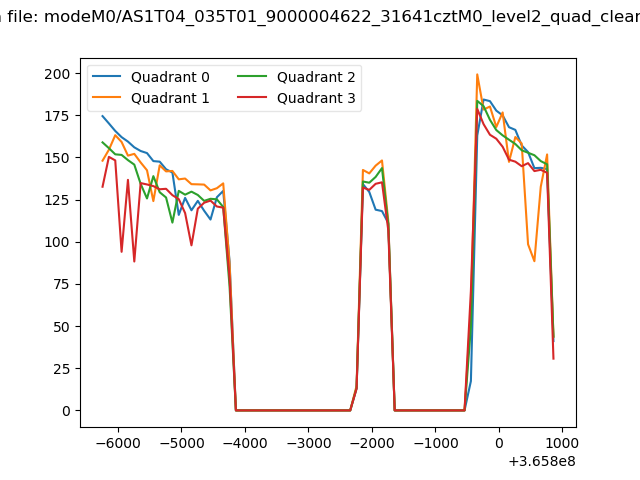 |
|
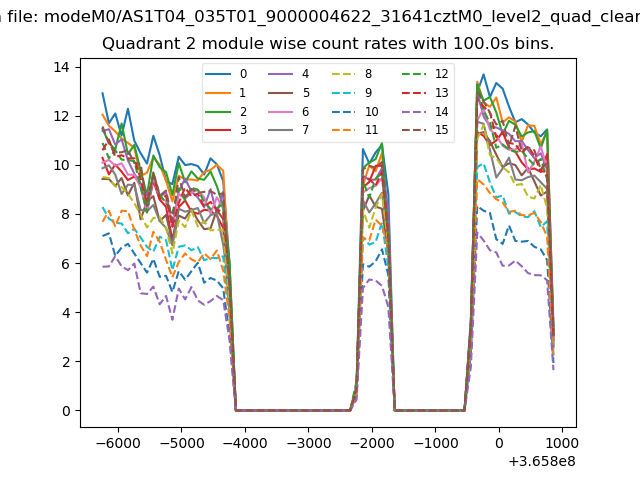
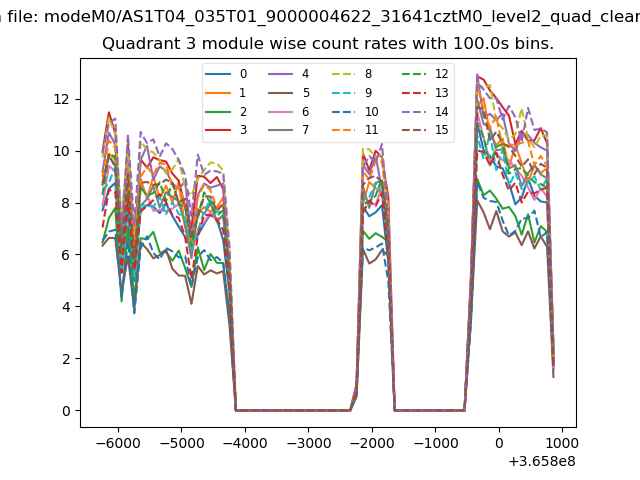
| Module-wise count rates for Quadrant A Data is divided into 100 sec bins |
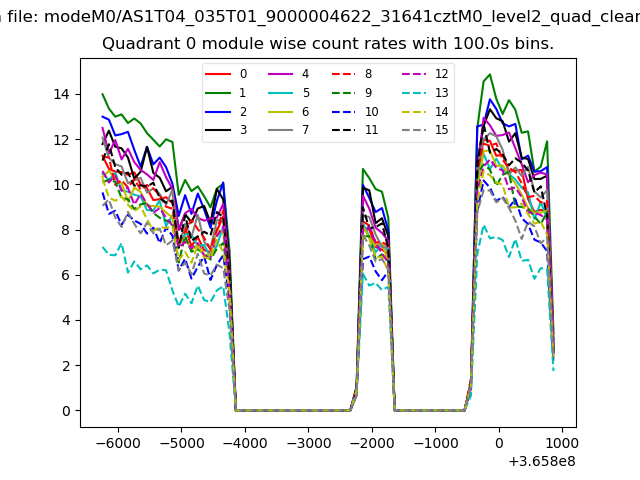 |
 |
| Module-wise count rates for Quadrant B Data is divided into 100 sec bins |
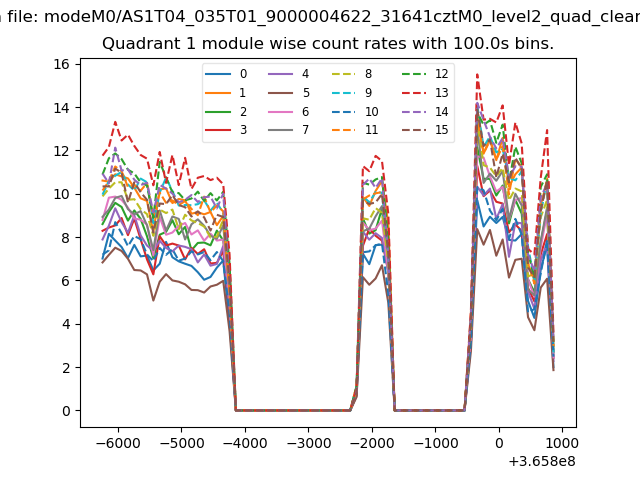 |
 |
| Module-wise count rates for Quadrant C Data is divided into 100 sec bins |
 |
 |
| Module-wise count rates for Quadrant D Data is divided into 100 sec bins |
 |
 |
| Parameter | Plot |
|---|---|
| CZT HV Monitor | 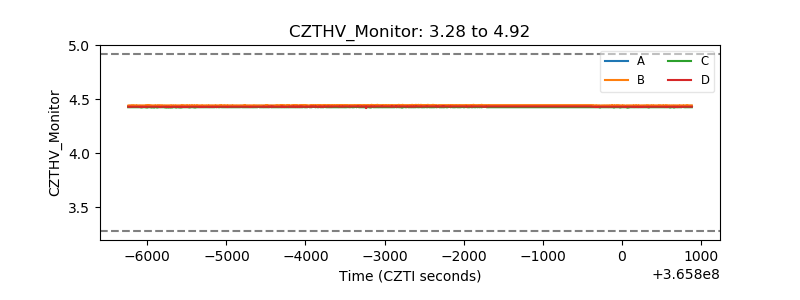 |
| D_VDD | 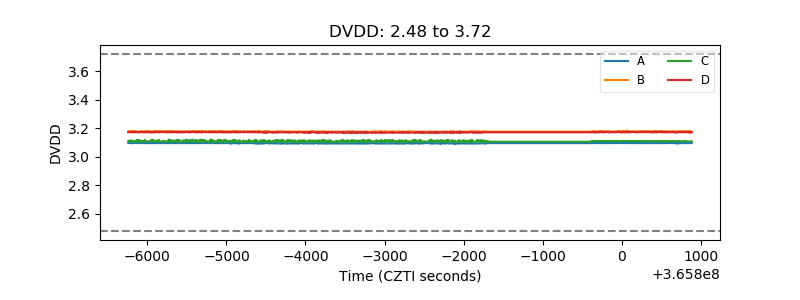 |
| Temperature 1 | 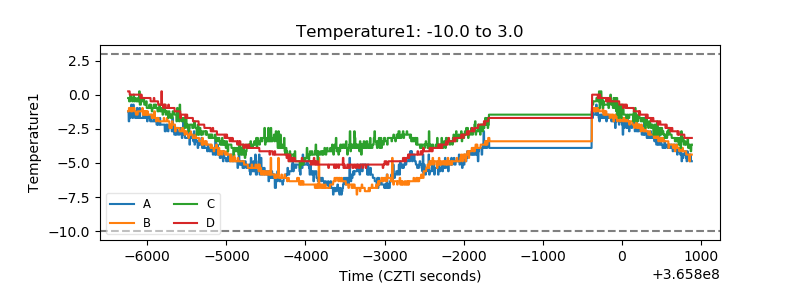 |
| Veto HV Monitor |  |
| Veto LLD | 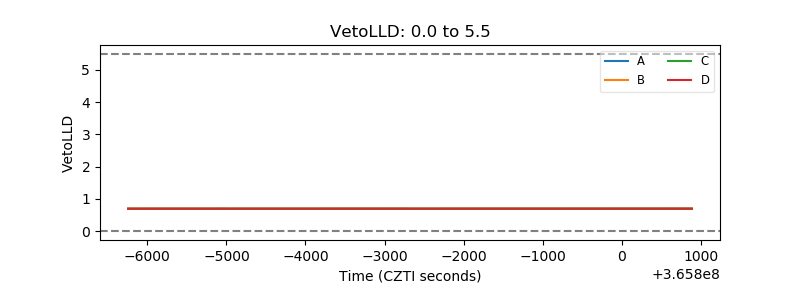 |
| Alpha Counter | 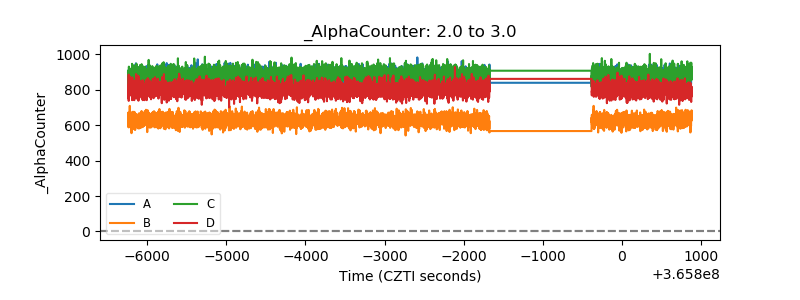 |
| _CPM_Rate |  |
| CZT Counter | 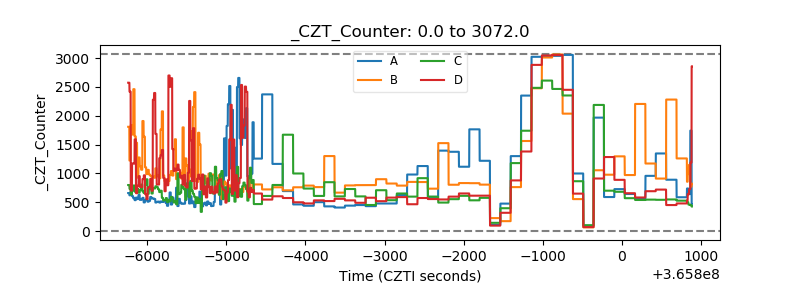 |
| +2.5 Volts monitor |  |
| +5 Volts monitor |  |
| _ROLL_ROT | 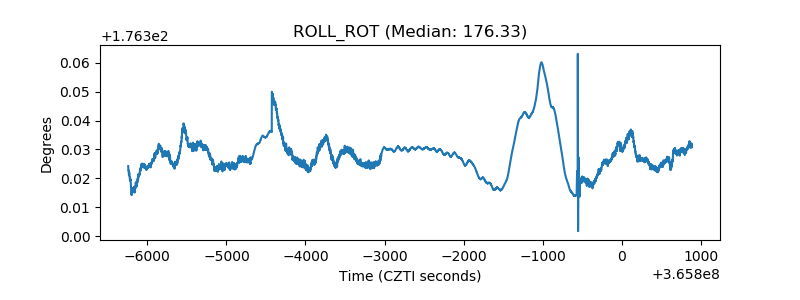 |
| _Roll_DEC | 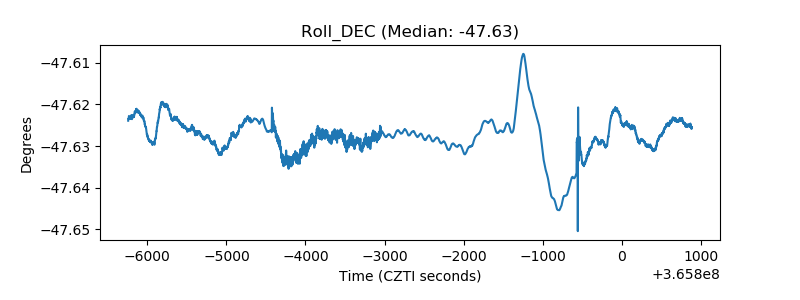 |
| _Roll_RA | 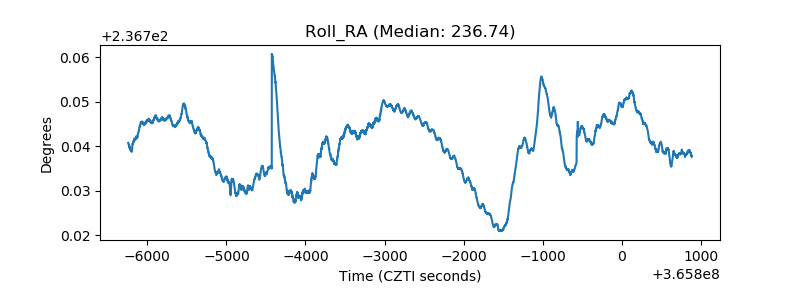 |
| Veto Counter | 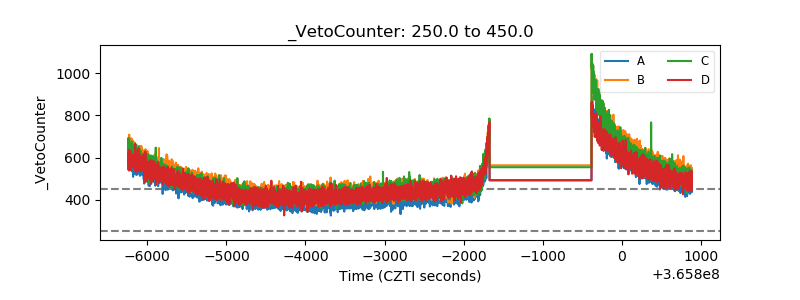 |