| Param | Original file | Final file |
|---|---|---|
| Filename | modeM0/AS1T04_035T01_9000004622_31642cztM0_level2.evt | modeM0/AS1T04_035T01_9000004622_31642cztM0_level2_quad_clean.evt |
| Size (bytes) | 727,044,480 | 95,319,360 |
| Size | 693.4 MB | 90.9 MB |
| Events in quadrant A | 6,720,516 | 613,456 |
| Events in quadrant B | 6,116,199 | 631,566 |
| Events in quadrant C | 4,450,575 | 603,656 |
| Events in quadrant D | 4,313,901 | 605,339 |
| Mode M0 | |||
|---|---|---|---|
| Quadrant | BADHDUFLAG | Total packets | Discarded packets |
| A | 0 | 24337 | 2 |
| B | 0 | 22592 | 2 |
| C | 0 | 17145 | 2 |
| D | 0 | 17057 | 2 |
| Mode SS | |||
|---|---|---|---|
| Quadrant | BADHDUFLAG | Total packets | Discarded packets |
| A | 0 | 124 | 0 |
| B | 0 | 124 | 0 |
| C | 0 | 124 | 0 |
| D | 0 | 124 | 0 |
| Mode M9 | |||
|---|---|---|---|
| Quadrant | BADHDUFLAG | Total packets | Discarded packets |
| A | 0 | 14 | 0 |
| B | 0 | 15 | 0 |
| C | 0 | 15 | 0 |
| D | 0 | 15 | 0 |
| Quadrant | Total seconds | Saturated seconds | Saturation percentage |
|---|---|---|---|
| A | 6194 | 1186 | 19.147562% |
| B | 6194 | 550 | 8.879561% |
| C | 6194 | 680 | 10.978366% |
| D | 6194 | 101 | 1.630610% |
Noise dominated data is calculated using 1-second bins in cleaned event files. If a bin has >2000 counts, and if more than 50% of those come from <1% of pixels, then it is considered to be noise-dominated and hence unusable.
| Quadrant | # 1 sec bins | Bins with >0 counts | Bins with >2000 counts | High rate bins dominated by noise | Noise dominated (total time) | Noise dominated (detector-on time) | Marked lightcurve |
|---|---|---|---|---|---|---|---|
| A | 7524 | 6195 | 951 | 951 | 12.64% | 15.35% | 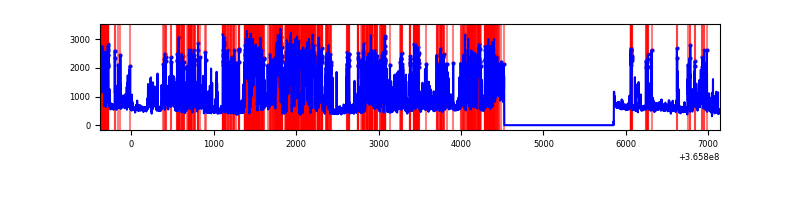 |
| B | 7524 | 6195 | 380 | 380 | 5.05% | 6.13% | 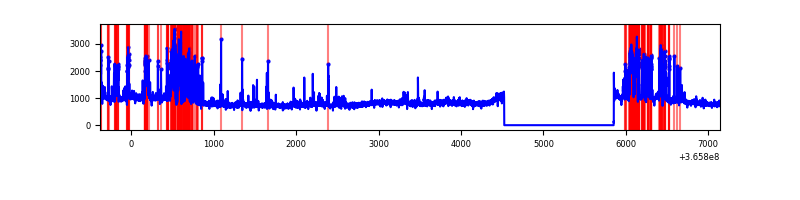 |
| C | 7524 | 6195 | 203 | 203 | 2.70% | 3.28% | 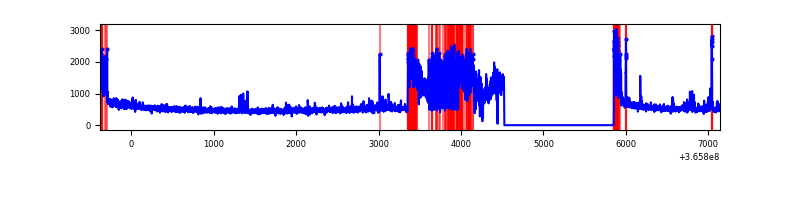 |
| D | 7524 | 6195 | 79 | 79 | 1.05% | 1.28% | 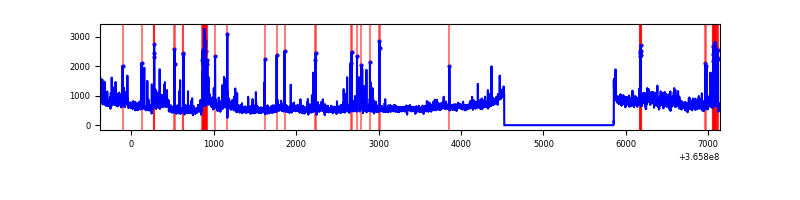 |
Top three noisy pixels from each quadrant. If the there are fewer than three noisy pixels in the level2.evt file, extra rows are filled as -1
| Pixel properties | Quadrant properties | ||||||
|---|---|---|---|---|---|---|---|
| Quadrant | DetID | PixID | Counts | Sigma | Mean | Median | Sigma |
| A | 0 | 13 | 3770929 | 25189.63 | 753 | 742 | 149.7 |
| A | 15 | 174 | 24744 | 160.36 | 753 | 742 | 149.7 |
| A | 14 | 238 | 13322 | 84.05 | 753 | 742 | 149.7 |
| B | 6 | 159 | 1812278 | 12340.08 | 788 | 770 | 146.8 |
| B | 5 | 172 | 852743 | 5803.68 | 788 | 770 | 146.8 |
| B | 10 | 245 | 222843 | 1512.77 | 788 | 770 | 146.8 |
| C | 0 | 10 | 1196235 | 6952.59 | 744 | 751 | 171.9 |
| C | 14 | 238 | 160142 | 926.97 | 744 | 751 | 171.9 |
| C | 3 | 233 | 64753 | 372.22 | 744 | 751 | 171.9 |
| D | 8 | 195 | 840285 | 4595.37 | 771 | 752 | 182.7 |
| D | 11 | 176 | 187185 | 1020.48 | 771 | 752 | 182.7 |
| D | 13 | 249 | 120834 | 657.3 | 771 | 752 | 182.7 |
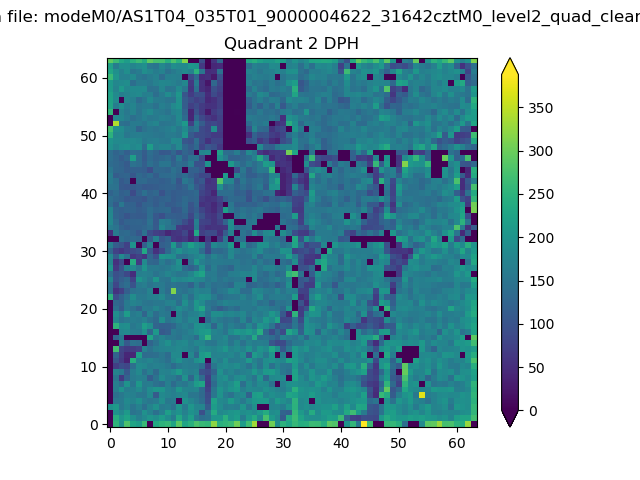
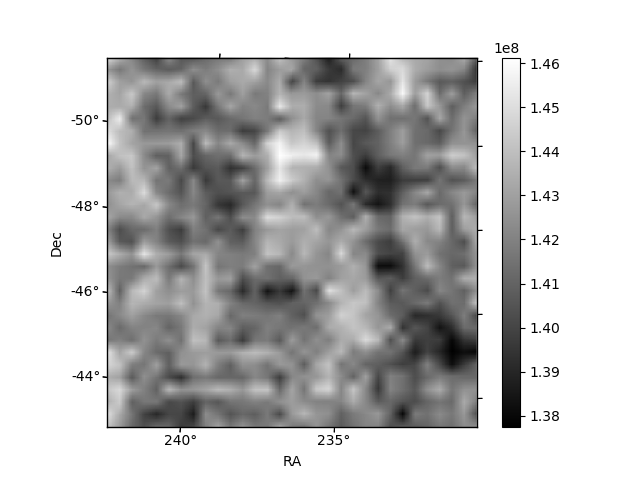
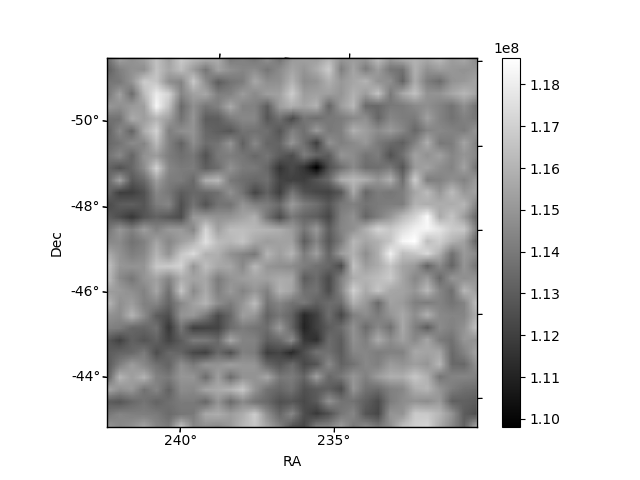
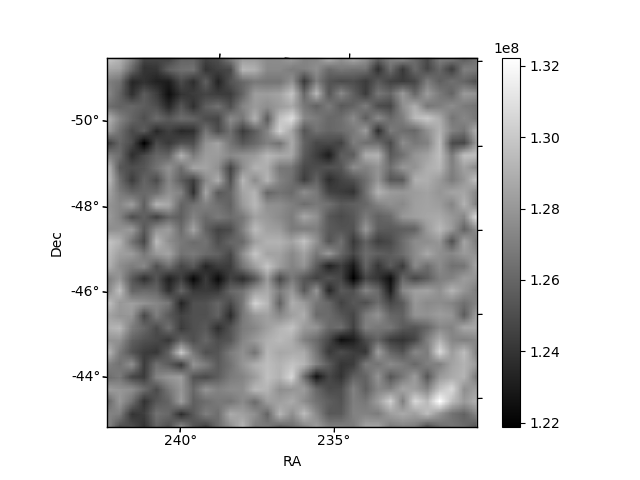
Histogram calculated using DETX and DETY for each event in the final _common_clean file
| Quadrant A | 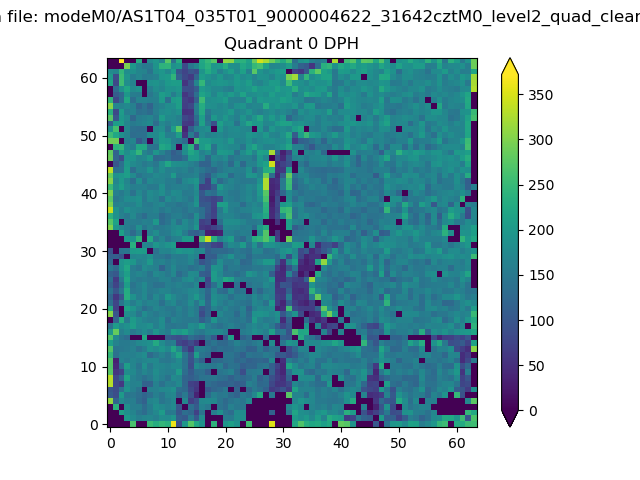 |
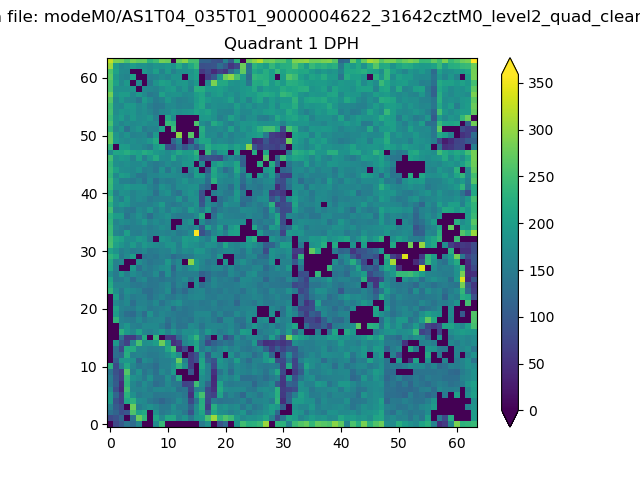 |
Quadrant B |
|---|---|---|---|
| Quadrant D | 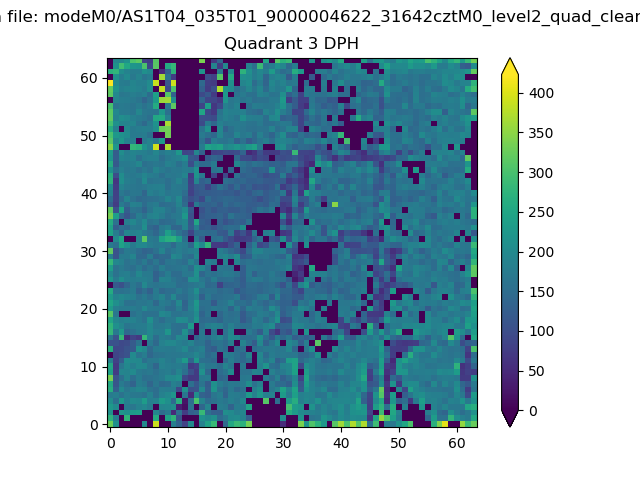 |
 |
Quadrant C |
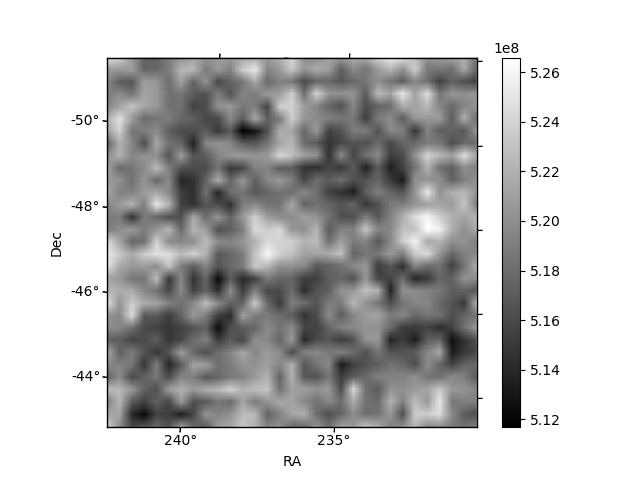
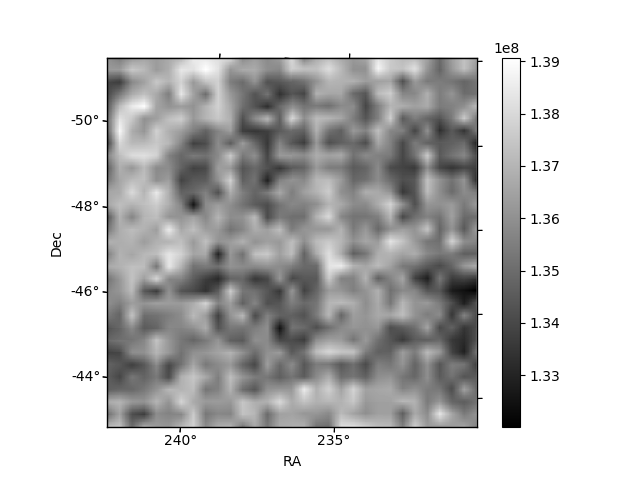
| Plot type | Count rate plots | Images |
|---|---|---|
| Comparison with Poisson distribution Blue bars denote a histogram of data divided into 1 sec bins. Red curve is a Poisson curve with rate = median count rate of data. |
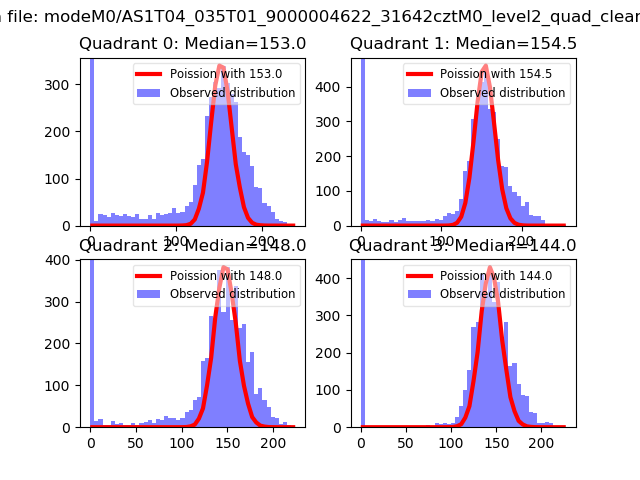 |
 |
| Quadrant-wise count rates Data is divided into 100 sec bins |
 |
|
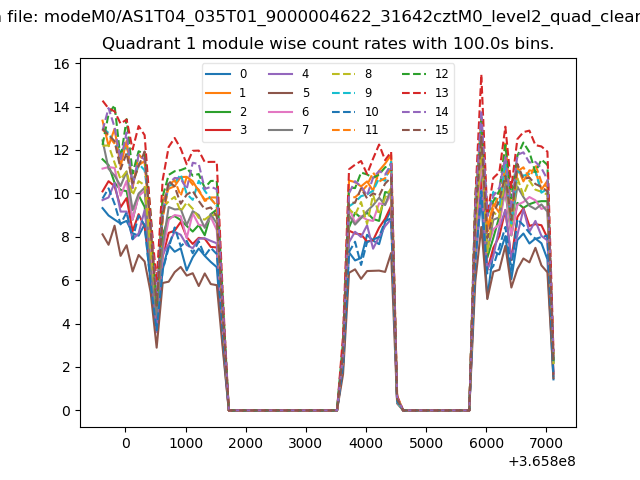
| Module-wise count rates for Quadrant A Data is divided into 100 sec bins |
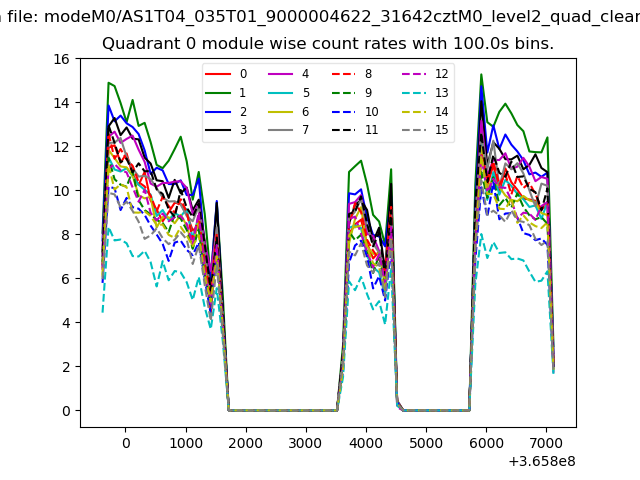 |
 |
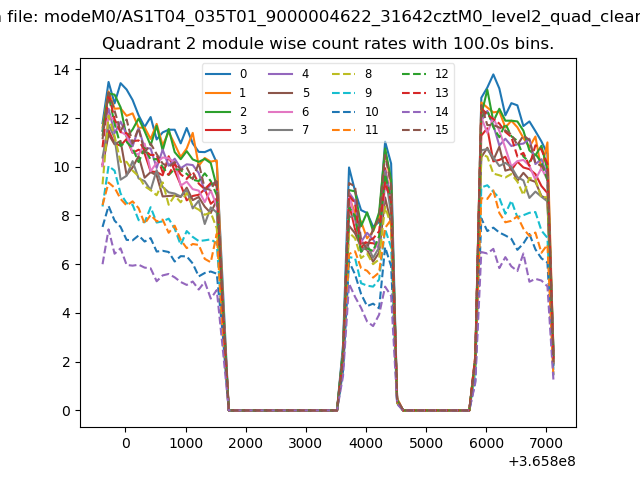
| Module-wise count rates for Quadrant B Data is divided into 100 sec bins |
 |
 |
| Module-wise count rates for Quadrant C Data is divided into 100 sec bins |
 |
 |
| Module-wise count rates for Quadrant D Data is divided into 100 sec bins |
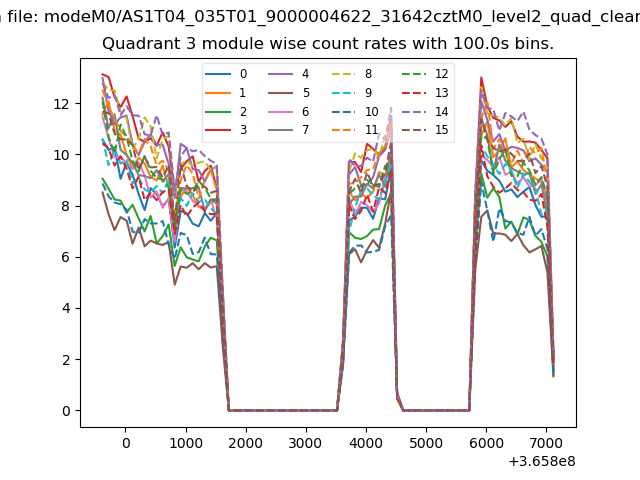 |
 |
| Parameter | Plot |
|---|---|
| CZT HV Monitor | 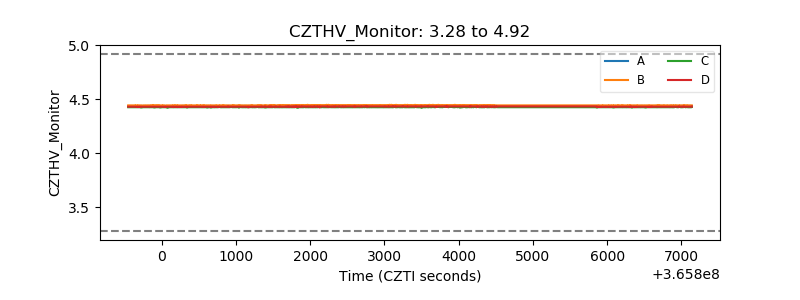 |
| D_VDD | 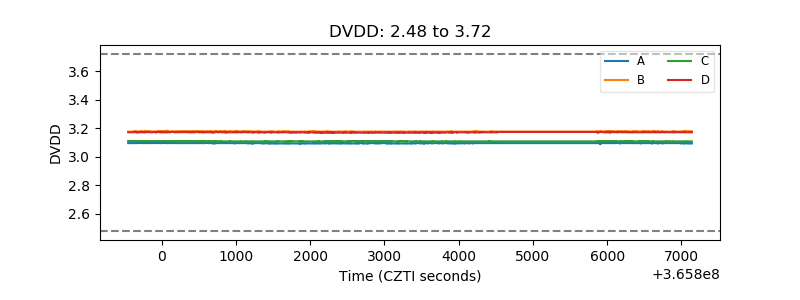 |
| Temperature 1 | 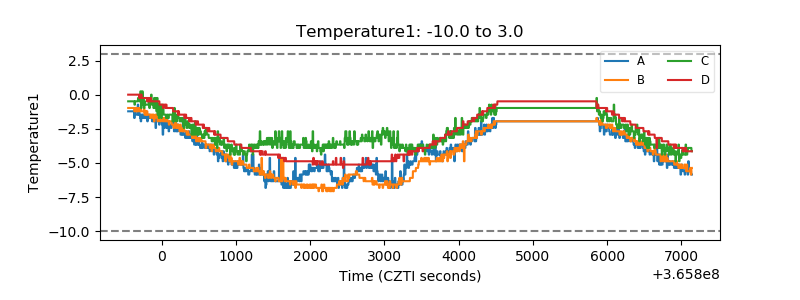 |
| Veto HV Monitor |  |
| Veto LLD | 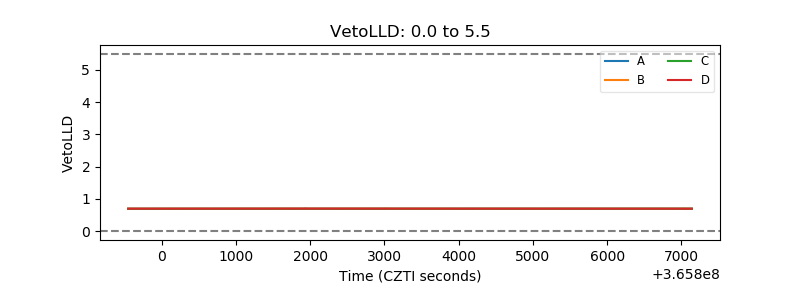 |
| Alpha Counter | 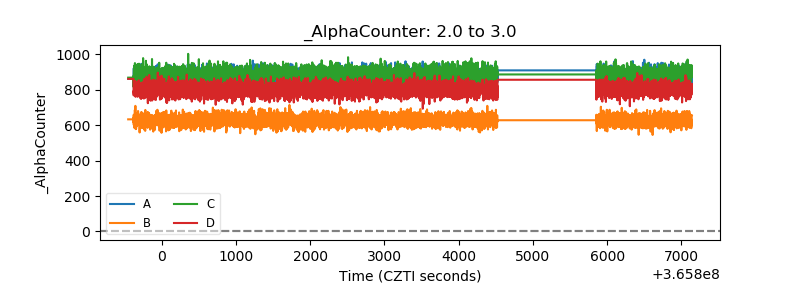 |
| _CPM_Rate |  |
| CZT Counter | 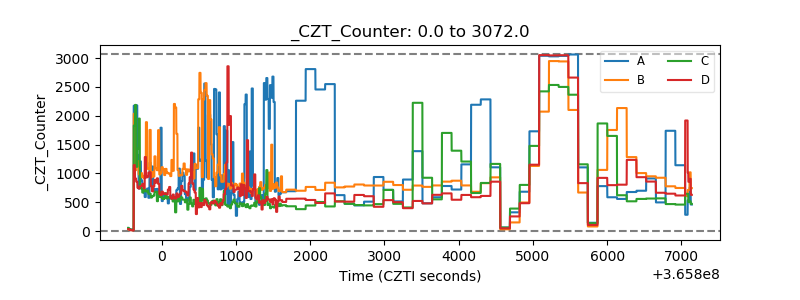 |
| +2.5 Volts monitor |  |
| +5 Volts monitor |  |
| _ROLL_ROT | 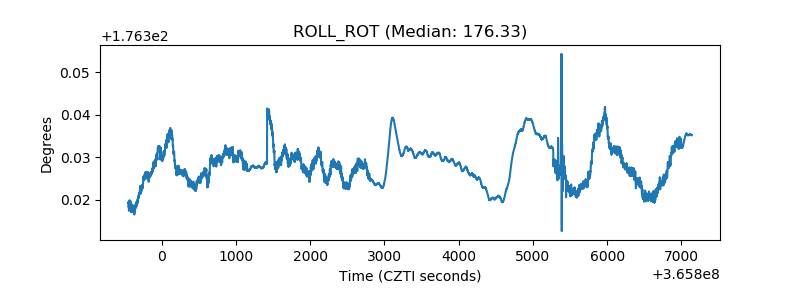 |
| _Roll_DEC | 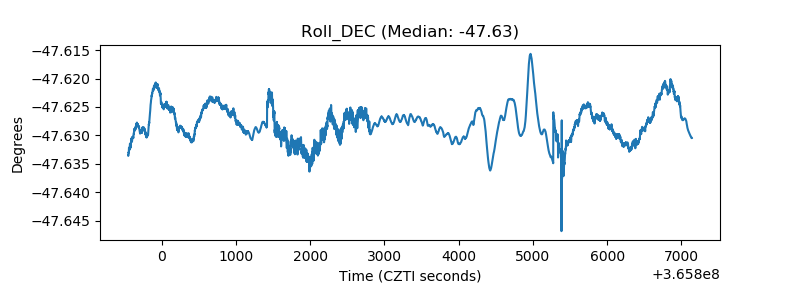 |
| _Roll_RA | 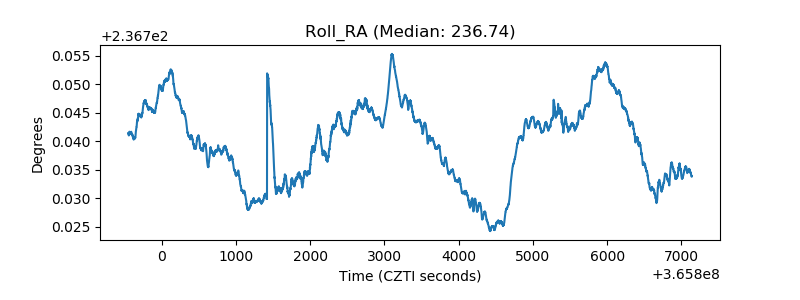 |
| Veto Counter | 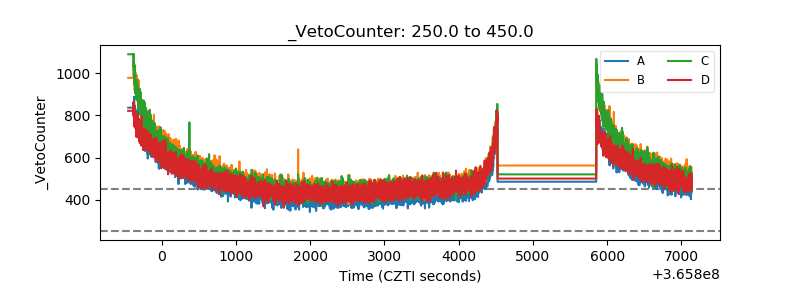 |