| Param | Original file | Final file |
|---|---|---|
| Filename | modeM0/AS1T04_035T01_9000004622_31646cztM0_level2.evt | modeM0/AS1T04_035T01_9000004622_31646cztM0_level2_quad_clean.evt |
| Size (bytes) | 774,794,880 | 74,203,200 |
| Size | 738.9 MB | 70.8 MB |
| Events in quadrant A | 7,610,625 | 393,367 |
| Events in quadrant B | 5,922,271 | 466,451 |
| Events in quadrant C | 3,806,241 | 454,505 |
| Events in quadrant D | 5,643,462 | 434,227 |
| Mode M0 | |||
|---|---|---|---|
| Quadrant | BADHDUFLAG | Total packets | Discarded packets |
| A | 0 | 27444 | 1 |
| B | 0 | 22889 | 1 |
| C | 0 | 15682 | 1 |
| D | 0 | 21957 | 1 |
| Mode SS | |||
|---|---|---|---|
| Quadrant | BADHDUFLAG | Total packets | Discarded packets |
| A | 0 | 144 | 0 |
| B | 0 | 144 | 0 |
| C | 0 | 144 | 0 |
| D | 0 | 144 | 0 |
| Mode M9 | |||
|---|---|---|---|
| Quadrant | BADHDUFLAG | Total packets | Discarded packets |
| A | 0 | 5 | 0 |
| B | 0 | 5 | 0 |
| C | 0 | 5 | 0 |
| D | 0 | 5 | 0 |
| Quadrant | Total seconds | Saturated seconds | Saturation percentage |
|---|---|---|---|
| A | 7150 | 1673 | 23.398601% |
| B | 7151 | 190 | 2.656971% |
| C | 7151 | 127 | 1.775975% |
| D | 7151 | 138 | 1.929800% |
Noise dominated data is calculated using 1-second bins in cleaned event files. If a bin has >2000 counts, and if more than 50% of those come from <1% of pixels, then it is considered to be noise-dominated and hence unusable.
| Quadrant | # 1 sec bins | Bins with >0 counts | Bins with >2000 counts | High rate bins dominated by noise | Noise dominated (total time) | Noise dominated (detector-on time) | Marked lightcurve |
|---|---|---|---|---|---|---|---|
| A | 7665 | 7151 | 1178 | 1178 | 15.37% | 16.47% | 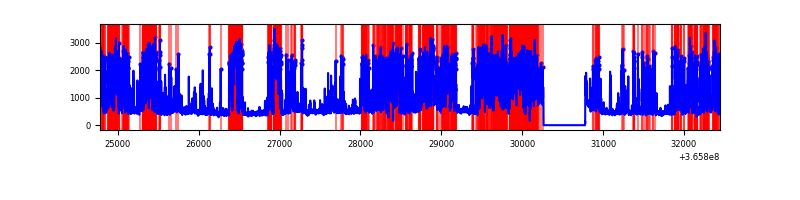 |
| B | 7666 | 7152 | 30 | 30 | 0.39% | 0.42% | 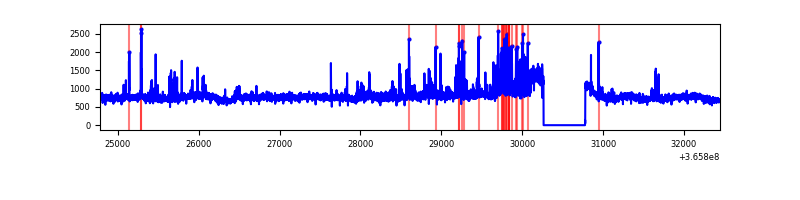 |
| C | 7666 | 7152 | 10 | 10 | 0.13% | 0.14% | 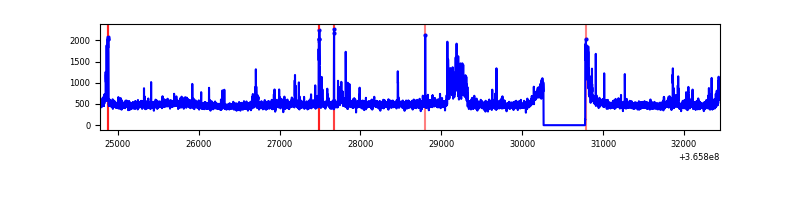 |
| D | 7666 | 7152 | 57 | 57 | 0.74% | 0.80% | 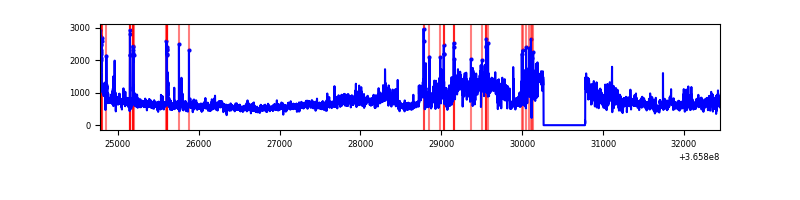 |
Top three noisy pixels from each quadrant. If the there are fewer than three noisy pixels in the level2.evt file, extra rows are filled as -1
| Pixel properties | Quadrant properties | ||||||
|---|---|---|---|---|---|---|---|
| Quadrant | DetID | PixID | Counts | Sigma | Mean | Median | Sigma |
| A | 0 | 13 | 4333778 | 28476.56 | 759 | 744 | 152.2 |
| A | 12 | 96 | 341101 | 2236.82 | 759 | 744 | 152.2 |
| A | 13 | 254 | 11784 | 72.55 | 759 | 744 | 152.2 |
| B | 6 | 159 | 2029513 | 12504.1 | 847 | 825 | 162.2 |
| B | 10 | 245 | 382885 | 2354.88 | 847 | 825 | 162.2 |
| B | 0 | 190 | 59881 | 364.0 | 847 | 825 | 162.2 |
| C | 10 | 22 | 269358 | 1380.27 | 822 | 823 | 194.6 |
| C | 14 | 238 | 136775 | 698.79 | 822 | 823 | 194.6 |
| C | 0 | 10 | 127673 | 652.01 | 822 | 823 | 194.6 |
| D | 8 | 195 | 2193032 | 11293.72 | 814 | 792 | 194.1 |
| D | 13 | 249 | 132725 | 679.67 | 814 | 792 | 194.1 |
| D | 11 | 176 | 96556 | 493.34 | 814 | 792 | 194.1 |
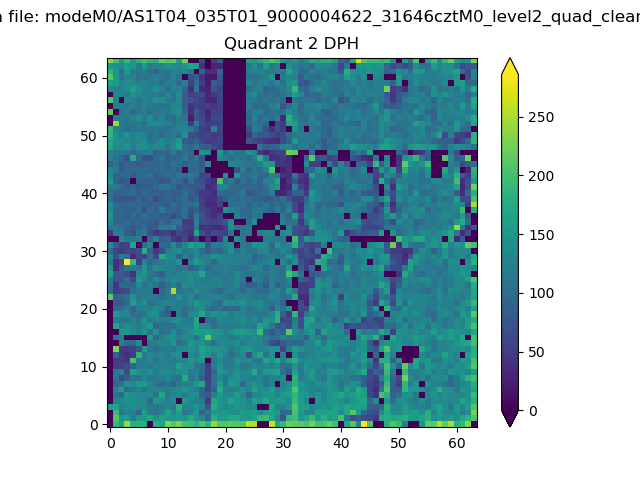
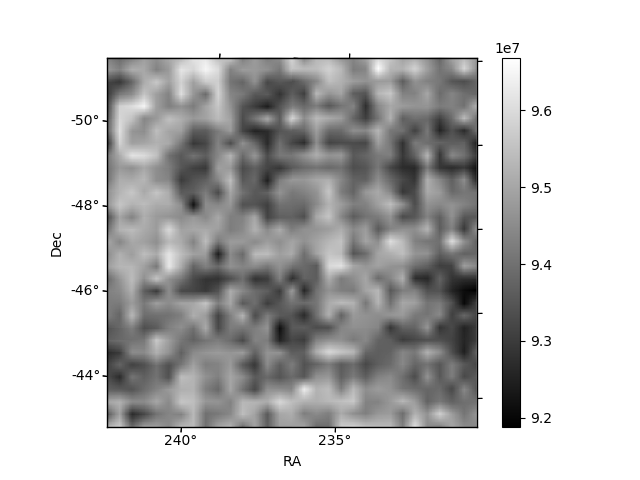
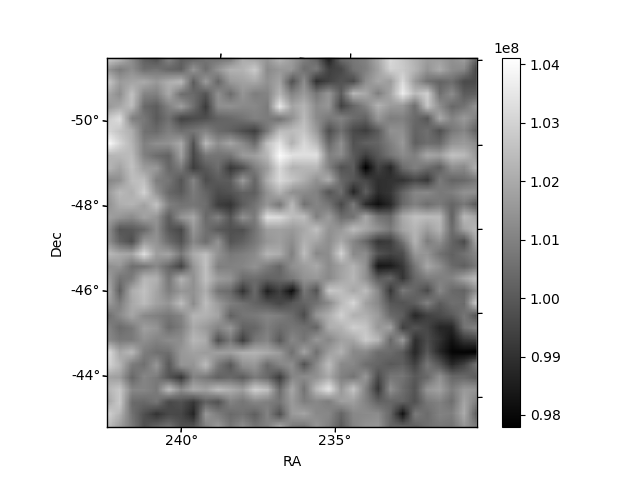
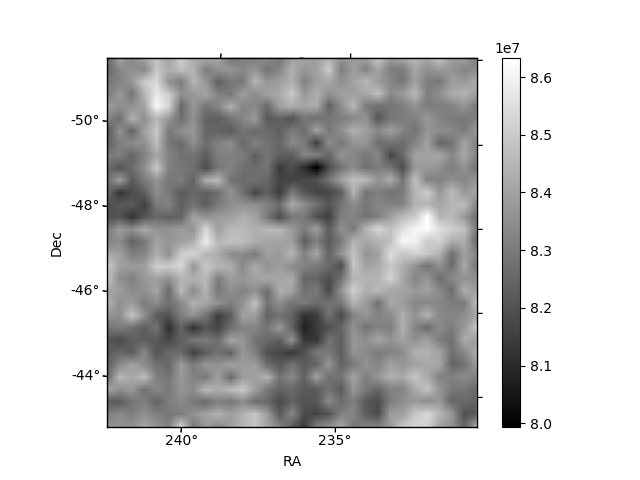
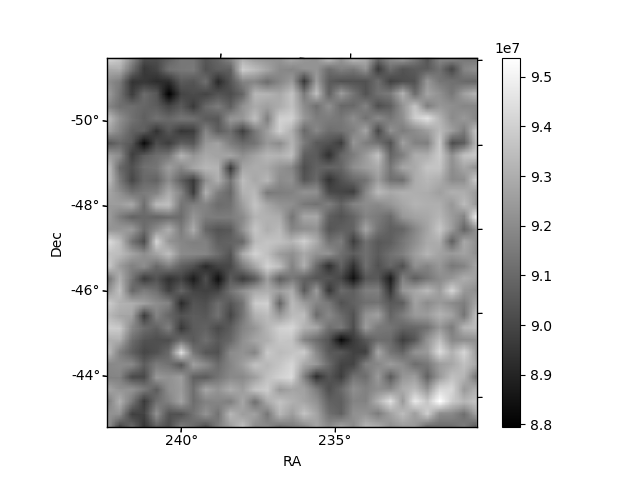
Histogram calculated using DETX and DETY for each event in the final _common_clean file
| Quadrant A | 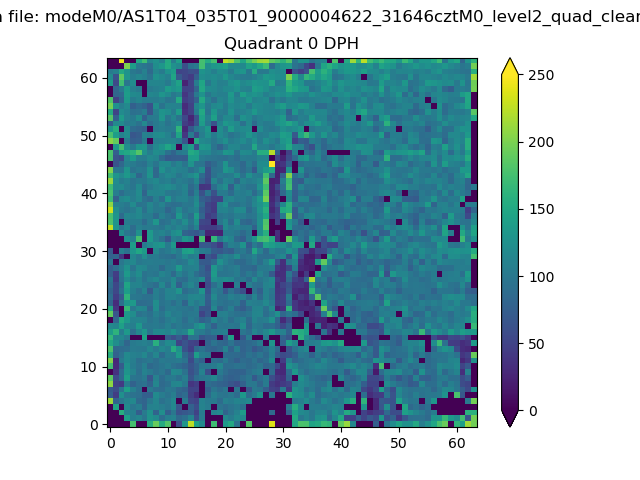 |
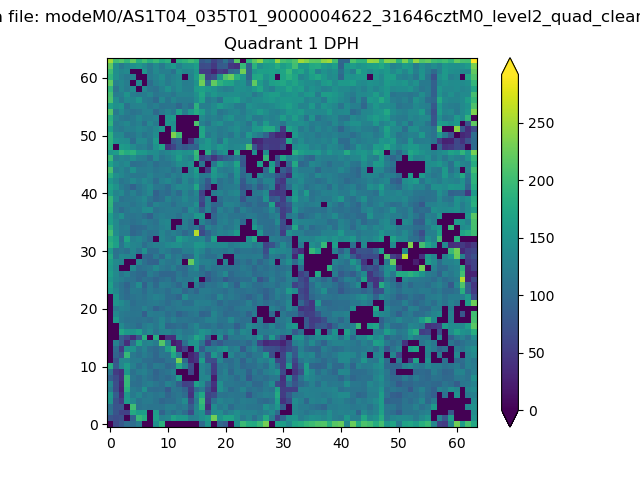 |
Quadrant B |
|---|---|---|---|
| Quadrant D | 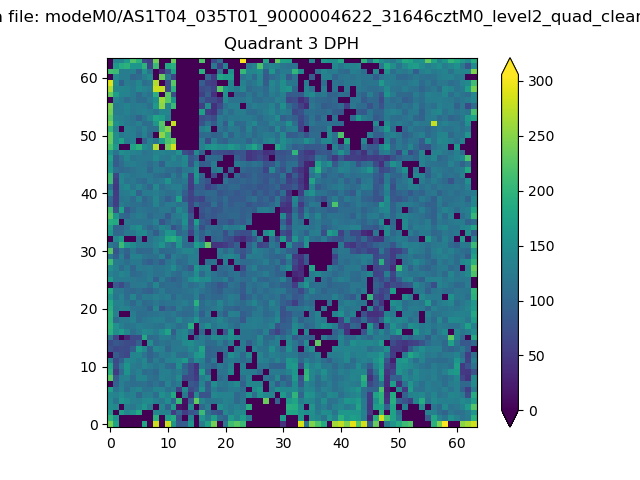 |
 |
Quadrant C |
| Plot type | Count rate plots | Images |
|---|---|---|
| Comparison with Poisson distribution Blue bars denote a histogram of data divided into 1 sec bins. Red curve is a Poisson curve with rate = median count rate of data. |
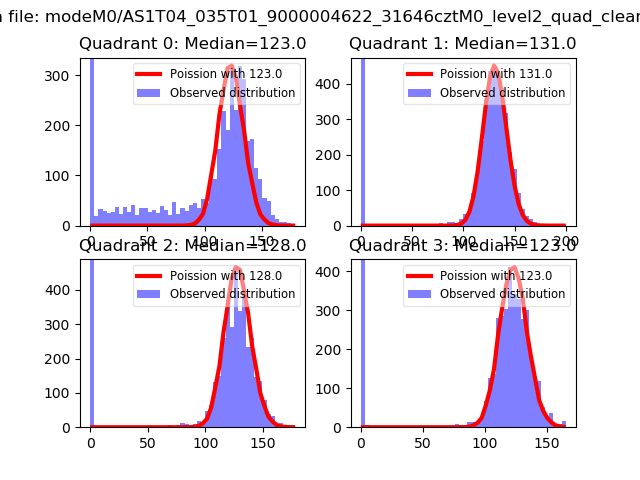 |
 |
| Quadrant-wise count rates Data is divided into 100 sec bins |
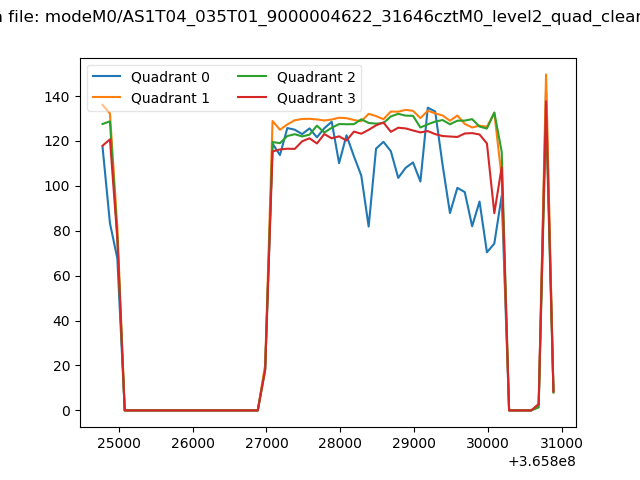 |
|
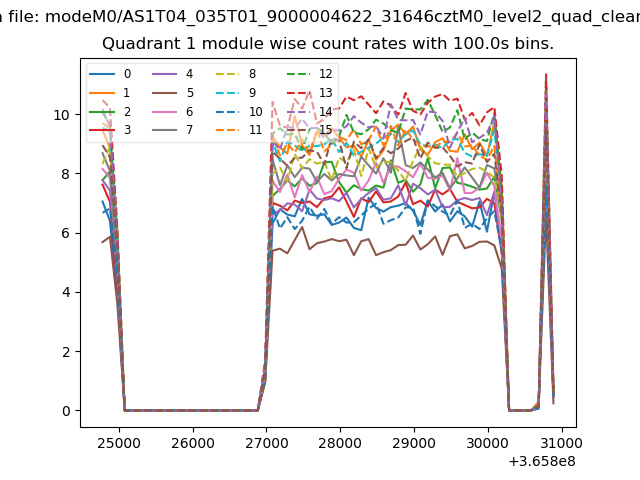
| Module-wise count rates for Quadrant A Data is divided into 100 sec bins |
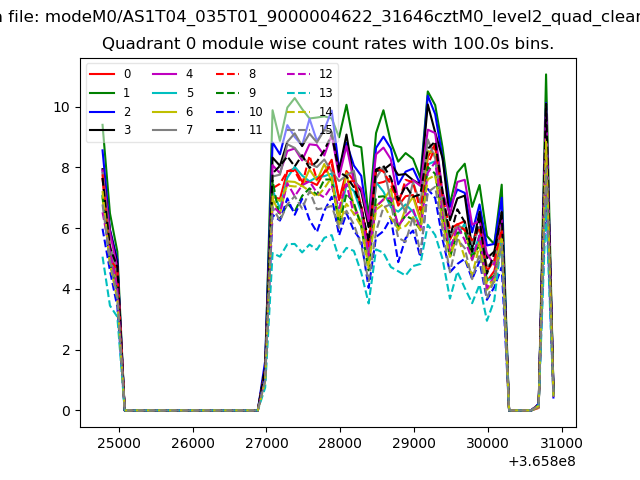 |
 |
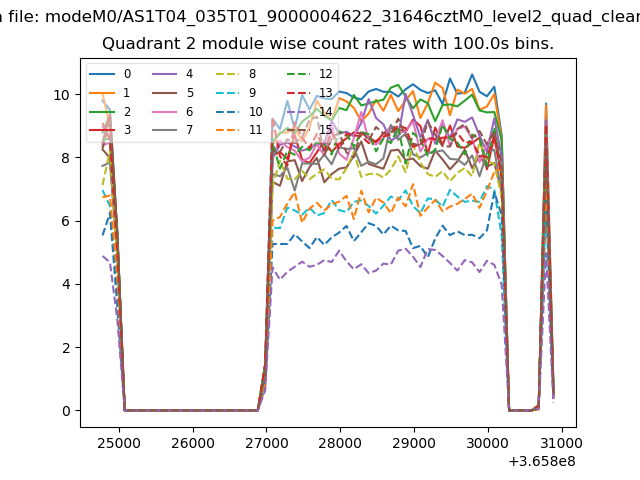
| Module-wise count rates for Quadrant B Data is divided into 100 sec bins |
 |
 |
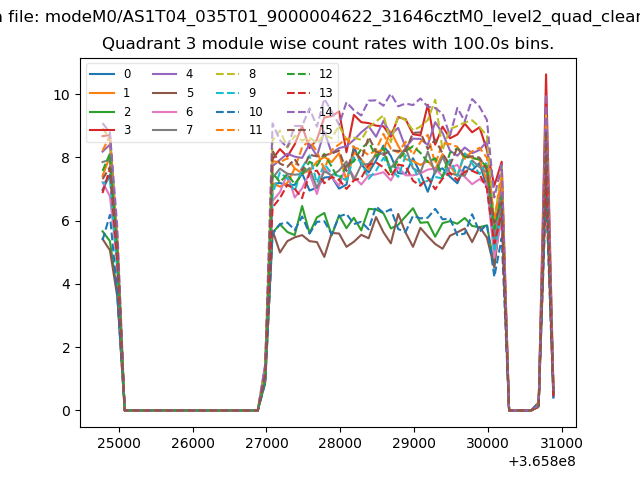
| Module-wise count rates for Quadrant C Data is divided into 100 sec bins |
 |
 |
| Module-wise count rates for Quadrant D Data is divided into 100 sec bins |
 |
 |
| Parameter | Plot |
|---|---|
| CZT HV Monitor | 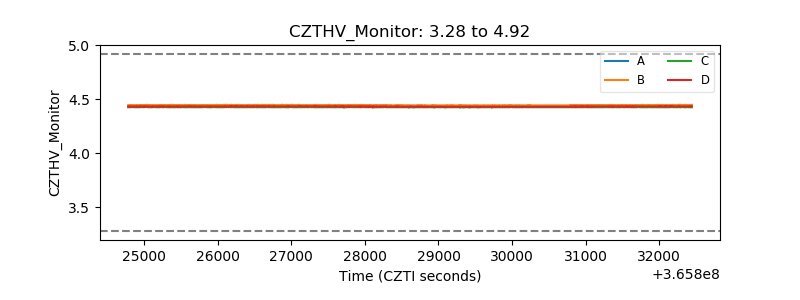 |
| D_VDD | 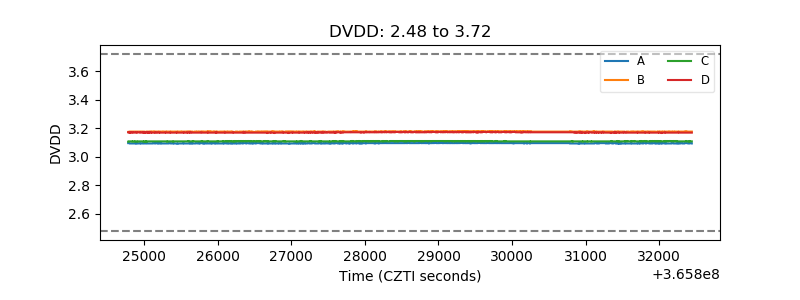 |
| Temperature 1 | 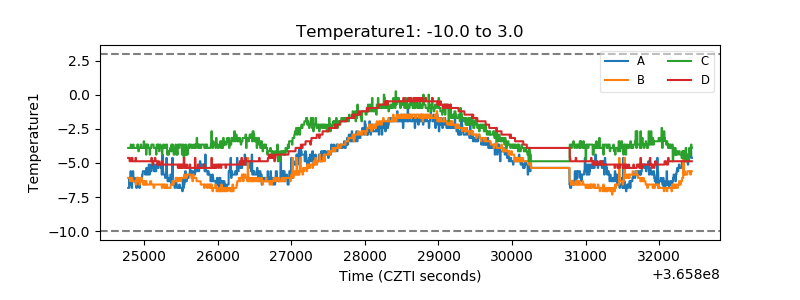 |
| Veto HV Monitor | 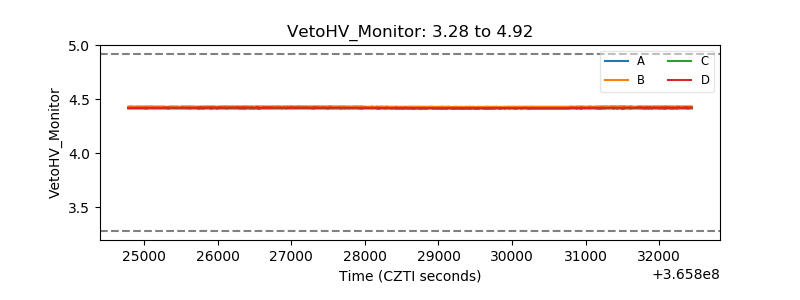 |
| Veto LLD | 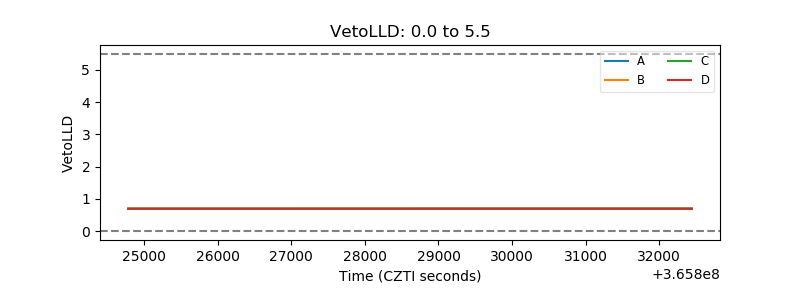 |
| Alpha Counter | 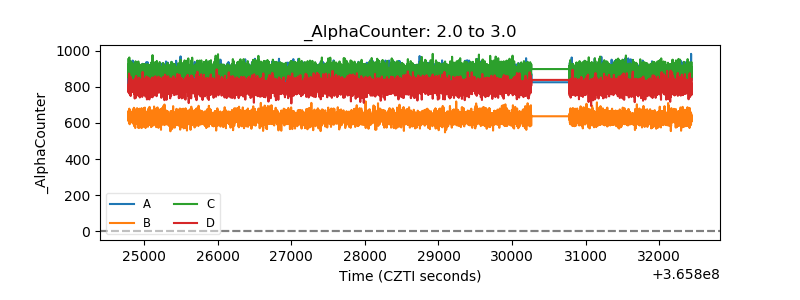 |
| _CPM_Rate |  |
| CZT Counter | 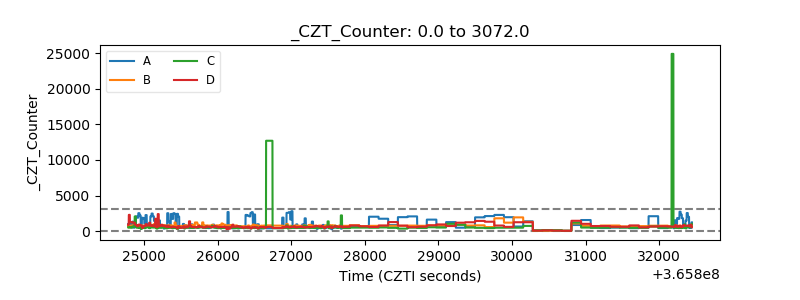 |
| +2.5 Volts monitor |  |
| +5 Volts monitor |  |
| _ROLL_ROT | 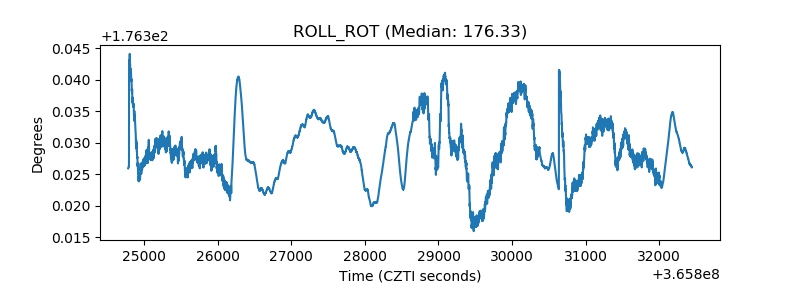 |
| _Roll_DEC | 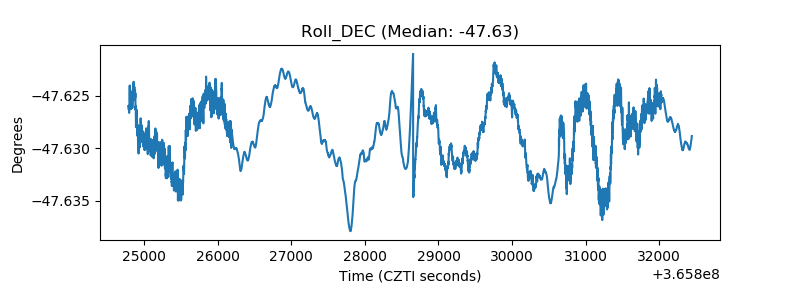 |
| _Roll_RA |  |
| Veto Counter | 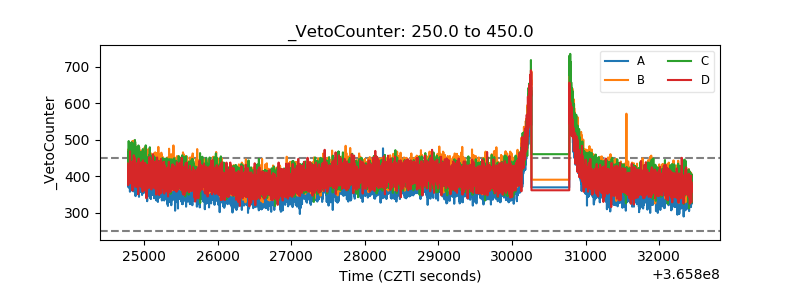 |