| Param | Original file | Final file |
|---|---|---|
| Filename | modeM0/AS1A10_056T01_9000004626cztM0_level2.fits | modeM0/AS1A10_056T01_9000004626cztM0_level2_quad_clean.evt |
| Size (bytes) | 877,282,560 | 712,203,840 |
| Size | 836.6 MB | 679.2 MB |
| Events in quadrant A | 5,433,624 | 4,017,098 |
| Events in quadrant B | 5,199,262 | 4,105,013 |
| Events in quadrant C | 5,321,854 | 3,913,096 |
| Events in quadrant D | 4,762,802 | 3,682,206 |
| Mode M0 | |||
|---|---|---|---|
| Quadrant | BADHDUFLAG | Total packets | Discarded packets |
| A | 0 | 194546 | 0 |
| B | 0 | 266458 | 0 |
| C | 0 | 221407 | 0 |
| D | 0 | 210365 | 0 |
| Mode M9 | |||
|---|---|---|---|
| Quadrant | BADHDUFLAG | Total packets | Discarded packets |
| A | 0 | 176 | 0 |
| B | 0 | 176 | 0 |
| C | 0 | 176 | 0 |
| D | 0 | 176 | 0 |
| Mode SS | |||
|---|---|---|---|
| Quadrant | BADHDUFLAG | Total packets | Discarded packets |
| A | 0 | 1736 | 0 |
| B | 0 | 1736 | 0 |
| C | 0 | 1736 | 0 |
| D | 0 | 1736 | 0 |
| Quadrant | Total seconds | Saturated seconds | Saturation percentage |
|---|---|---|---|
| A | 85340 | 3017 | 3.535271% |
| B | 85341 | 2261 | 2.649371% |
| C | 85341 | 4298 | 5.036266% |
| D | 85341 | 926 | 1.085059% |
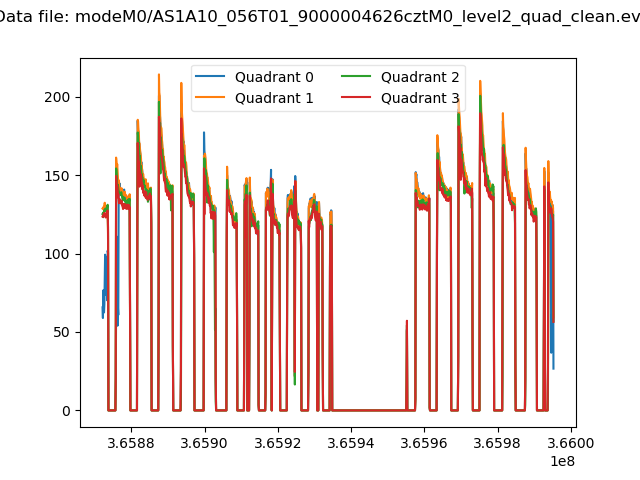
Noise dominated data is calculated using 1-second bins in cleaned event files. If a bin has >2000 counts, and if more than 50% of those come from <1% of pixels, then it is considered to be noise-dominated and hence unusable.
| Quadrant | # 1 sec bins | Bins with >0 counts | Bins with >2000 counts | High rate bins dominated by noise | Noise dominated (total time) | Noise dominated (detector-on time) | Marked lightcurve |
|---|---|---|---|---|---|---|---|
| A | 123150 | 85266 | 0 | 0 | 0.00% | 0.00% |  |
| B | 123149 | 85337 | 0 | 0 | 0.00% | 0.00% | 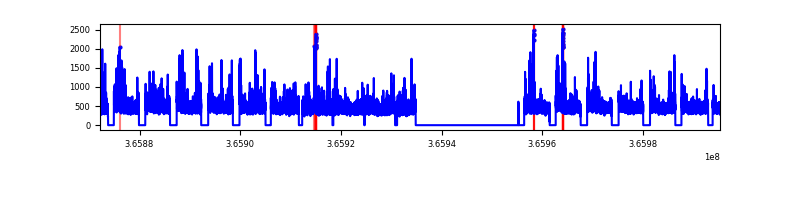 |
| C | 123149 | 85325 | 0 | 0 | 0.00% | 0.00% |  |
| D | 123148 | 85326 | 0 | 0 | 0.00% | 0.00% | 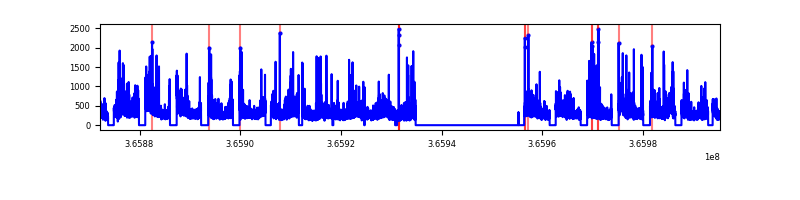 |
Top three noisy pixels from each quadrant. If the there are fewer than three noisy pixels in the level2.evt file, extra rows are filled as -1
| Pixel properties | Quadrant properties | ||||||
|---|---|---|---|---|---|---|---|
| Quadrant | DetID | PixID | Counts | Sigma | Mean | Median | Sigma |
| A | 0 | 29 | 4528 | 9.24 | 1418 | 1343 | 344.9 |
| A | 7 | 110 | 4387 | 8.83 | 1418 | 1343 | 344.9 |
| A | 9 | 19 | 4048 | 7.84 | 1418 | 1343 | 344.9 |
| B | 2 | 9 | 4216 | 10.8 | 1381 | 1325 | 267.7 |
| B | 2 | 8 | 3495 | 8.11 | 1381 | 1325 | 267.7 |
| B | 3 | 17 | 3433 | 7.87 | 1381 | 1325 | 267.7 |
| C | 1 | 81 | 4149 | 7.93 | 1412 | 1333 | 355.2 |
| C | 1 | 80 | 4078 | 7.73 | 1412 | 1333 | 355.2 |
| C | 3 | 187 | 3609 | 6.41 | 1412 | 1333 | 355.2 |
| D | 10 | 189 | 3456 | 6.21 | 1365 | 1251 | 355.1 |
| D | 7 | 3 | 3305 | 5.78 | 1365 | 1251 | 355.1 |
| D | 10 | 113 | 3290 | 5.74 | 1365 | 1251 | 355.1 |
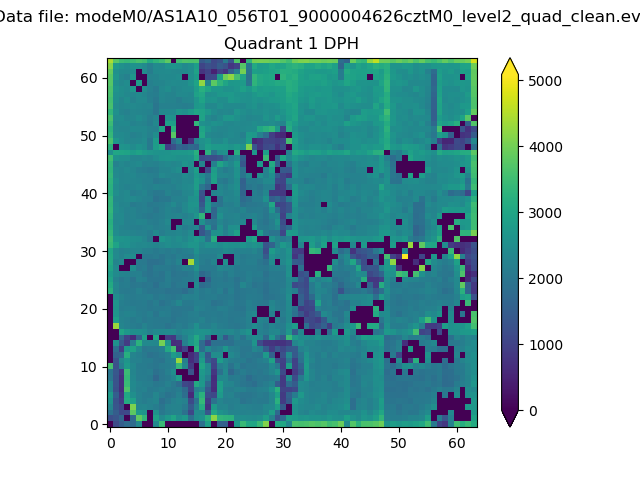
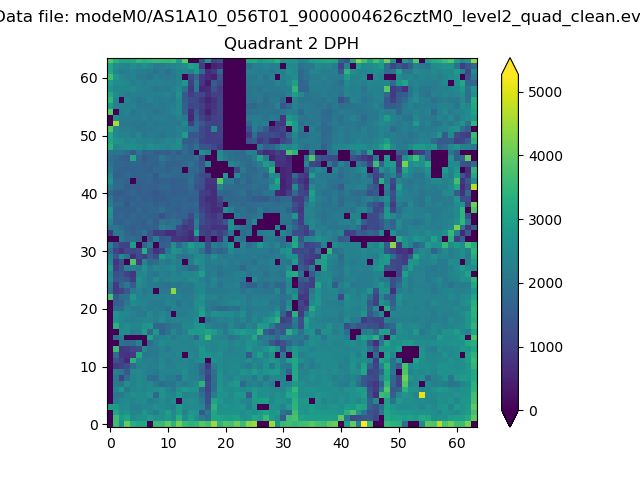
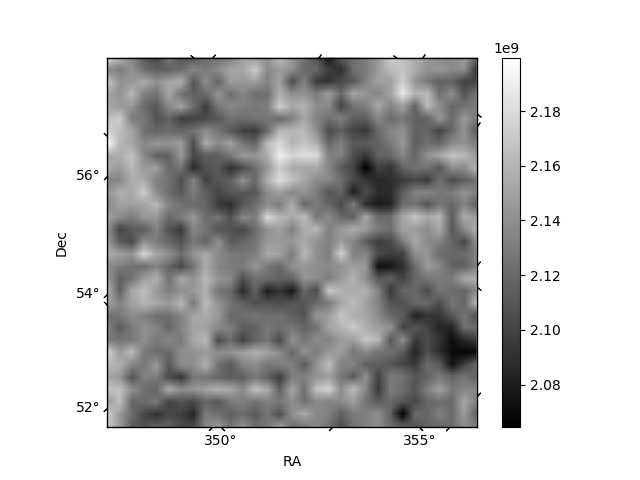
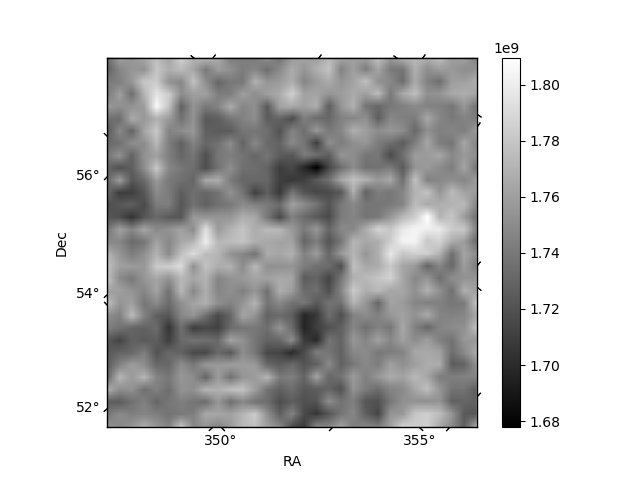
Histogram calculated using DETX and DETY for each event in the final _common_clean file
| Quadrant A |  |
 |
Quadrant B |
|---|---|---|---|
| Quadrant D |  |
 |
Quadrant C |
| Plot type | Count rate plots | Images |
|---|---|---|
| Comparison with Poisson distribution Blue bars denote a histogram of data divided into 1 sec bins. Red curve is a Poisson curve with rate = median count rate of data. |
 |
 |
| Quadrant-wise count rates Data is divided into 100 sec bins |
 |
|
| Module-wise count rates for Quadrant A Data is divided into 100 sec bins |
 |
 |
| Module-wise count rates for Quadrant B Data is divided into 100 sec bins |
 |
 |
| Module-wise count rates for Quadrant C Data is divided into 100 sec bins |
 |
 |
| Module-wise count rates for Quadrant D Data is divided into 100 sec bins |
 |
 |
| Parameter | Plot |
|---|---|
| CZT HV Monitor |  |
| D_VDD | 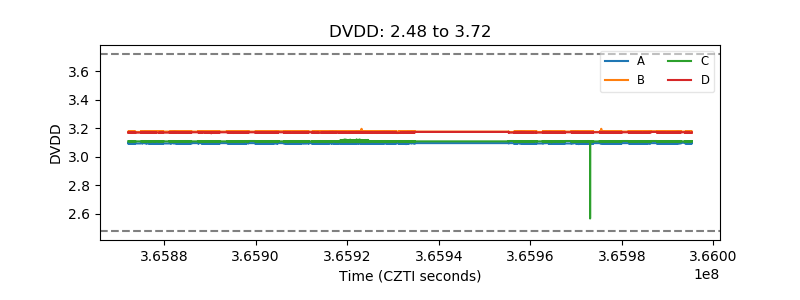 |
| Temperature 1 | 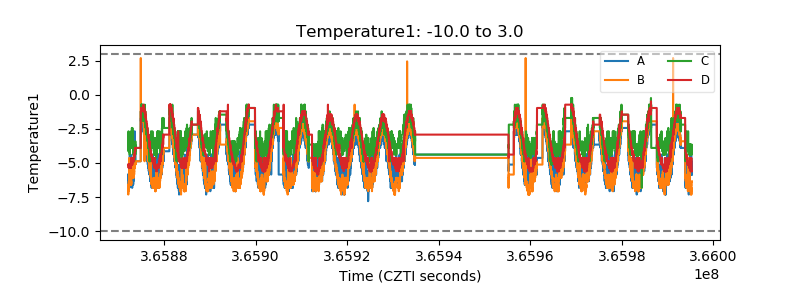 |
| Veto HV Monitor |  |
| Veto LLD |  |
| Alpha Counter | 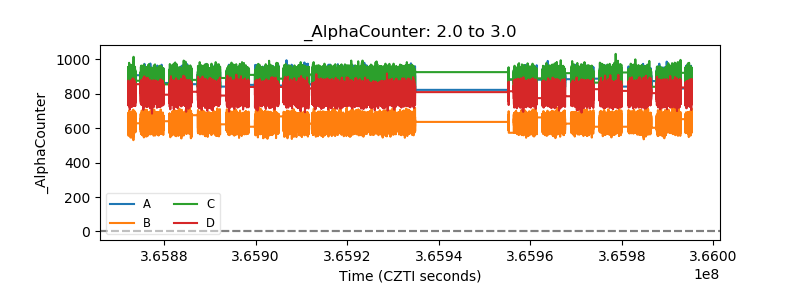 |
| _CPM_Rate |  |
| CZT Counter |  |
| +2.5 Volts monitor | 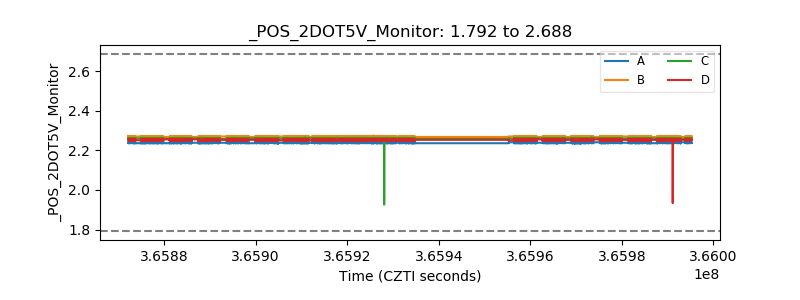 |
| +5 Volts monitor |  |
| _ROLL_ROT |  |
| _Roll_DEC | 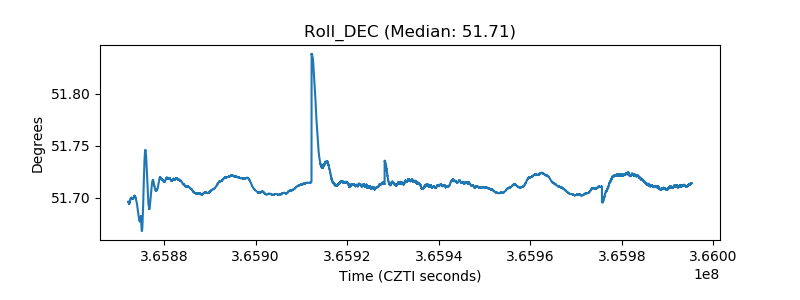 |
| _Roll_RA |  |
| Veto Counter |  |