| Param | Original file | Final file |
|---|---|---|
| Filename | modeM0/AS1A10_056T01_9000004626_31656cztM0_level2.evt | modeM0/AS1A10_056T01_9000004626_31656cztM0_level2_quad_clean.evt |
| Size (bytes) | 638,717,760 | 116,614,080 |
| Size | 609.1 MB | 111.2 MB |
| Events in quadrant A | 3,416,966 | 786,560 |
| Events in quadrant B | 5,575,862 | 797,057 |
| Events in quadrant C | 5,037,868 | 762,408 |
| Events in quadrant D | 4,885,079 | 743,758 |
| Mode M0 | |||
|---|---|---|---|
| Quadrant | BADHDUFLAG | Total packets | Discarded packets |
| A | 0 | 14337 | 2 |
| B | 0 | 20952 | 2 |
| C | 0 | 19259 | 2 |
| D | 0 | 18835 | 2 |
| Mode M9 | |||
|---|---|---|---|
| Quadrant | BADHDUFLAG | Total packets | Discarded packets |
| A | 0 | 26 | 0 |
| B | 0 | 26 | 0 |
| C | 0 | 26 | 0 |
| D | 0 | 26 | 0 |
| Mode SS | |||
|---|---|---|---|
| Quadrant | BADHDUFLAG | Total packets | Discarded packets |
| A | 0 | 130 | 0 |
| B | 0 | 130 | 0 |
| C | 0 | 130 | 0 |
| D | 0 | 130 | 0 |
| Quadrant | Total seconds | Saturated seconds | Saturation percentage |
|---|---|---|---|
| A | 6338 | 87 | 1.372673% |
| B | 6339 | 226 | 3.565231% |
| C | 6339 | 630 | 9.938476% |
| D | 6339 | 133 | 2.098123% |
Noise dominated data is calculated using 1-second bins in cleaned event files. If a bin has >2000 counts, and if more than 50% of those come from <1% of pixels, then it is considered to be noise-dominated and hence unusable.
| Quadrant | # 1 sec bins | Bins with >0 counts | Bins with >2000 counts | High rate bins dominated by noise | Noise dominated (total time) | Noise dominated (detector-on time) | Marked lightcurve |
|---|---|---|---|---|---|---|---|
| A | 8938 | 6340 | 2 | 2 | 0.02% | 0.03% | 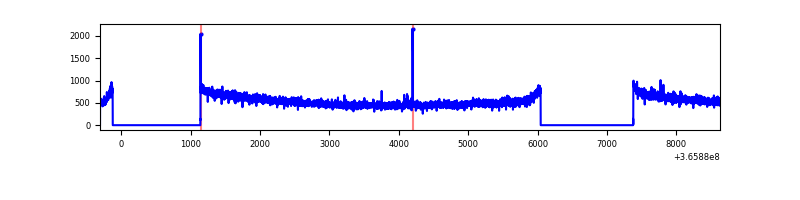 |
| B | 8939 | 6341 | 25 | 25 | 0.28% | 0.39% | 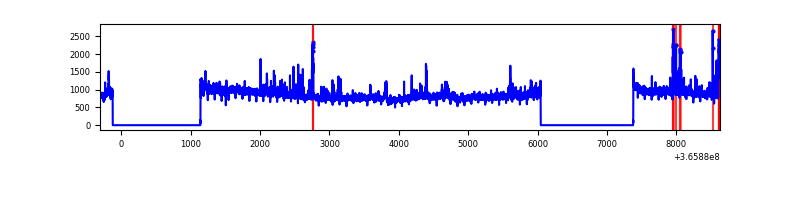 |
| C | 8939 | 6341 | 254 | 254 | 2.84% | 4.01% | 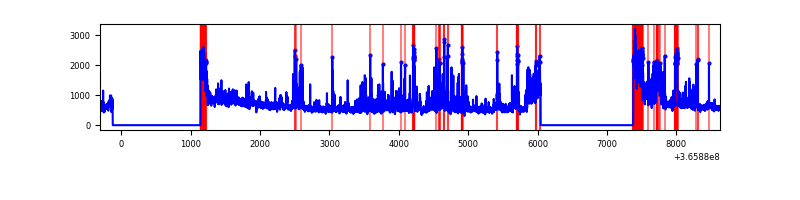 |
| D | 8939 | 6341 | 36 | 36 | 0.40% | 0.57% | 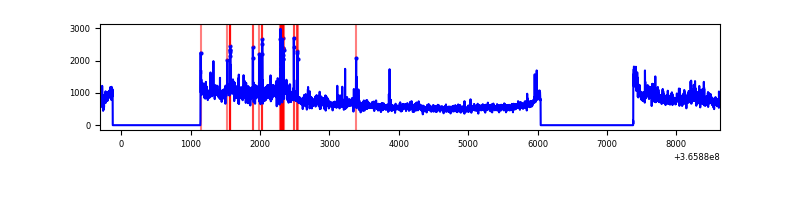 |
Top three noisy pixels from each quadrant. If the there are fewer than three noisy pixels in the level2.evt file, extra rows are filled as -1
| Pixel properties | Quadrant properties | ||||||
|---|---|---|---|---|---|---|---|
| Quadrant | DetID | PixID | Counts | Sigma | Mean | Median | Sigma |
| A | 13 | 254 | 12394 | 66.41 | 882 | 866 | 173.6 |
| A | 12 | 96 | 8996 | 46.83 | 882 | 866 | 173.6 |
| A | 3 | 137 | 8115 | 41.76 | 882 | 866 | 173.6 |
| B | 6 | 159 | 1797248 | 11202.64 | 881 | 862 | 160.4 |
| B | 10 | 245 | 105348 | 651.6 | 881 | 862 | 160.4 |
| B | 0 | 190 | 51606 | 316.45 | 881 | 862 | 160.4 |
| C | 0 | 10 | 811010 | 4209.95 | 833 | 841 | 192.4 |
| C | 10 | 22 | 469422 | 2434.93 | 833 | 841 | 192.4 |
| C | 3 | 233 | 324199 | 1680.29 | 833 | 841 | 192.4 |
| D | 8 | 195 | 1407575 | 6929.14 | 867 | 849 | 203.0 |
| D | 12 | 233 | 92844 | 453.14 | 867 | 849 | 203.0 |
| D | 13 | 249 | 35825 | 172.28 | 867 | 849 | 203.0 |
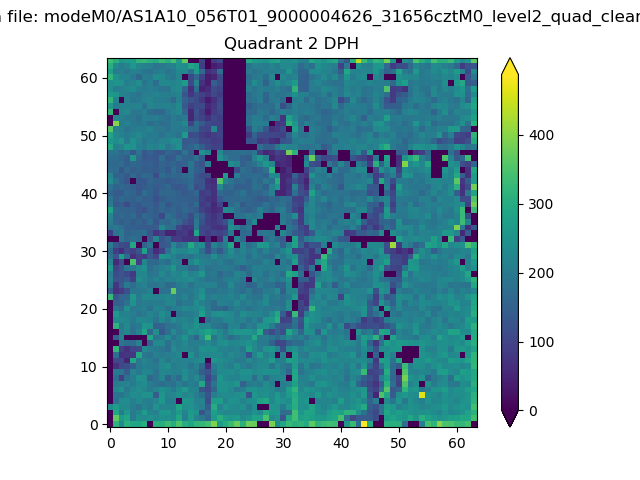
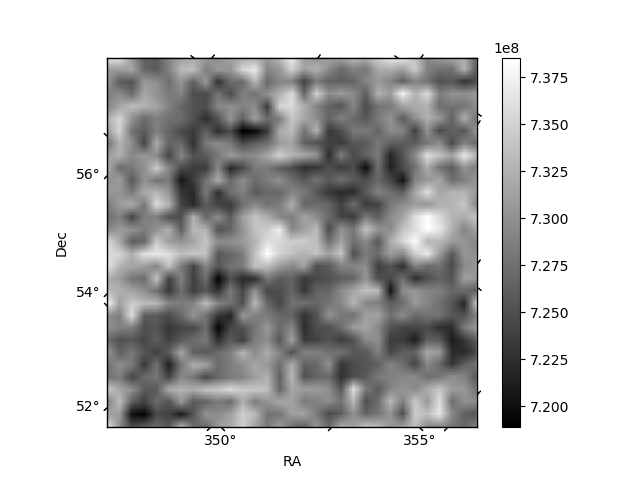
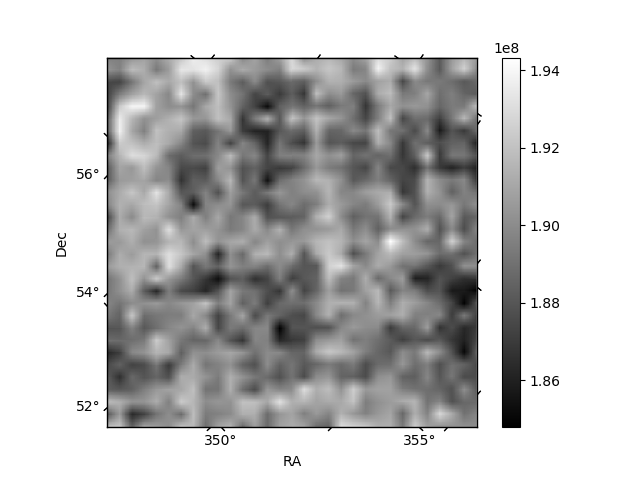
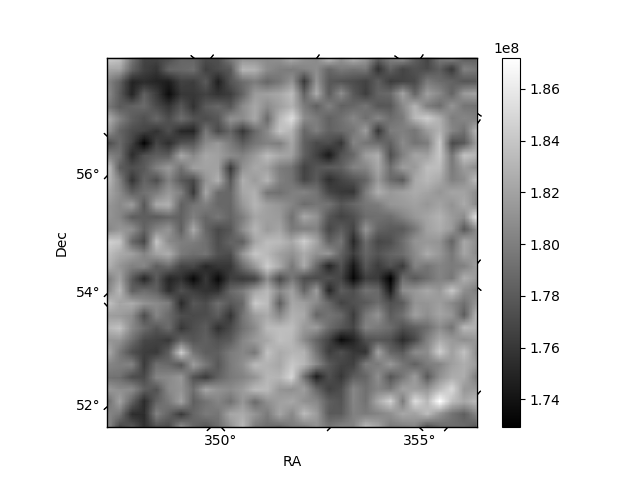
Histogram calculated using DETX and DETY for each event in the final _common_clean file
| Quadrant A | 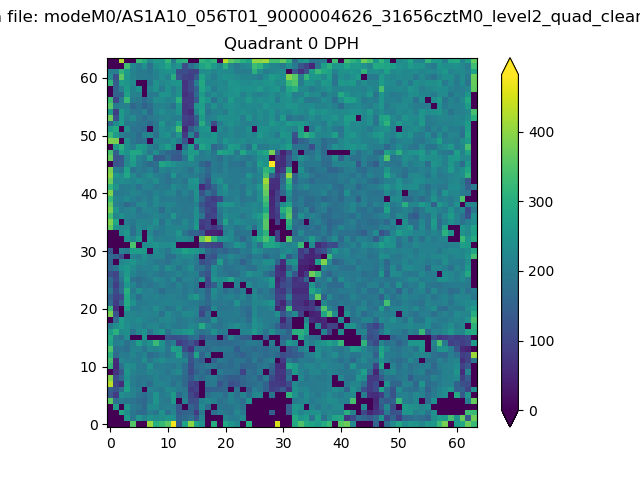 |
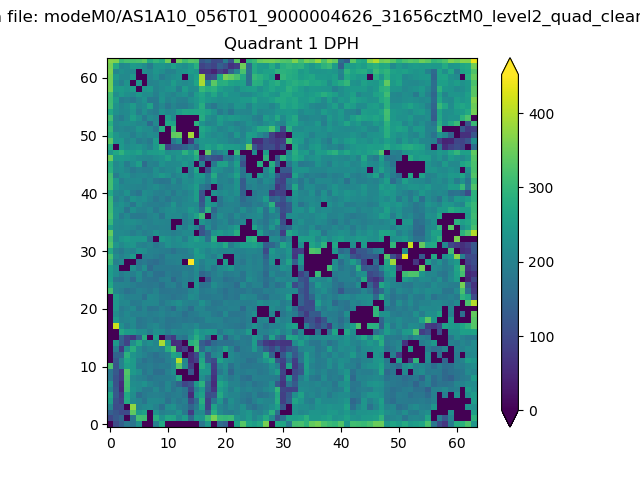 |
Quadrant B |
|---|---|---|---|
| Quadrant D | 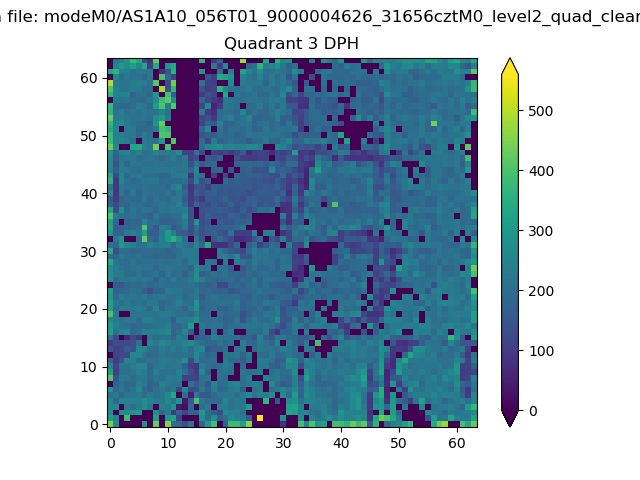 |
 |
Quadrant C |
| Plot type | Count rate plots | Images |
|---|---|---|
| Comparison with Poisson distribution Blue bars denote a histogram of data divided into 1 sec bins. Red curve is a Poisson curve with rate = median count rate of data. |
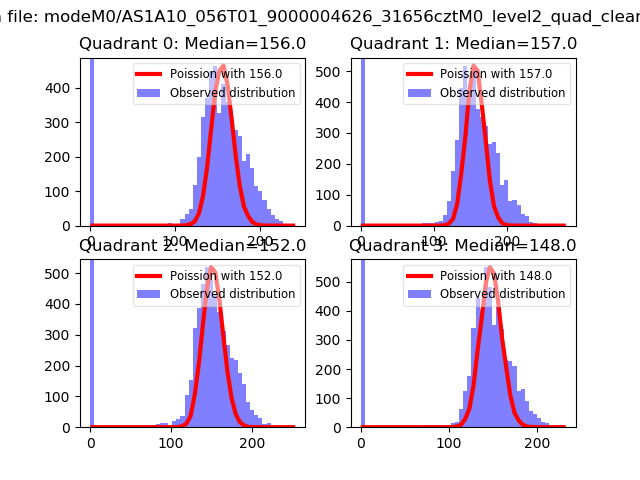 |
 |
| Quadrant-wise count rates Data is divided into 100 sec bins |
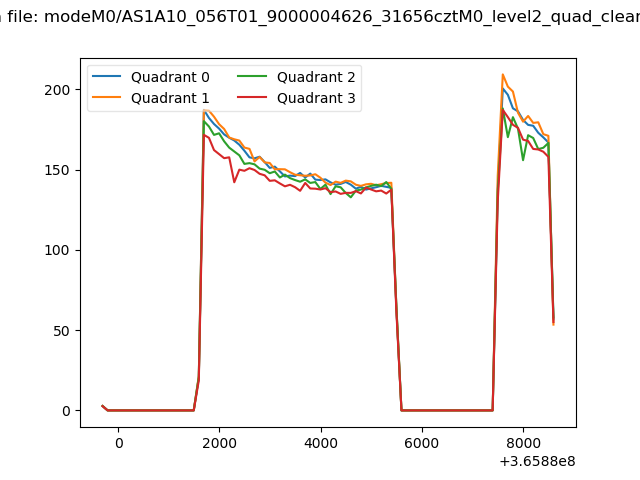 |
|
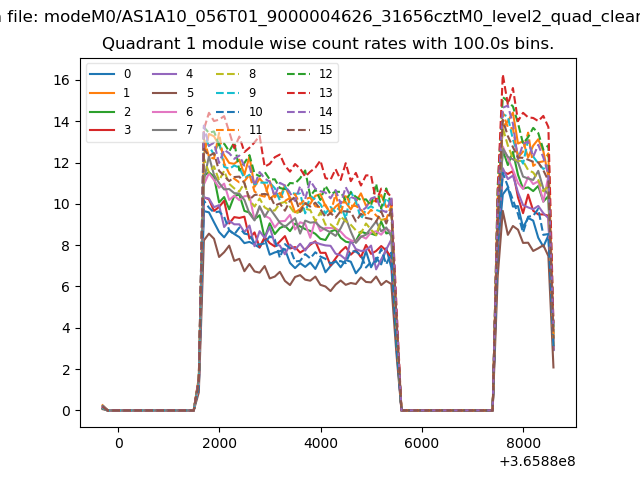
| Module-wise count rates for Quadrant A Data is divided into 100 sec bins |
 |
 |
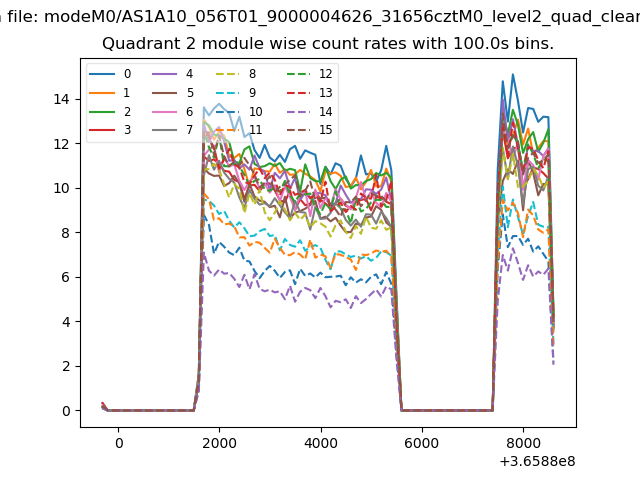
| Module-wise count rates for Quadrant B Data is divided into 100 sec bins |
 |
 |
| Module-wise count rates for Quadrant C Data is divided into 100 sec bins |
 |
 |
| Module-wise count rates for Quadrant D Data is divided into 100 sec bins |
 |
 |
| Parameter | Plot |
|---|---|
| CZT HV Monitor | 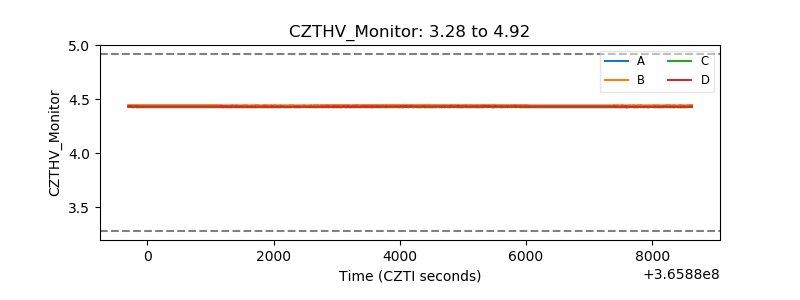 |
| D_VDD | 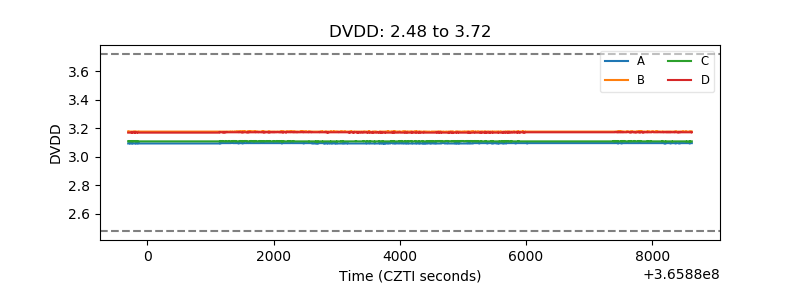 |
| Temperature 1 | 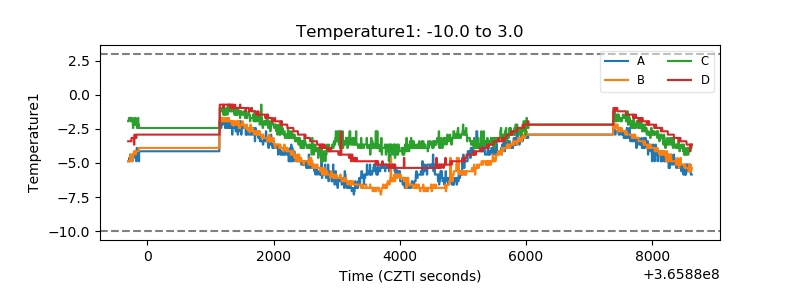 |
| Veto HV Monitor |  |
| Veto LLD | 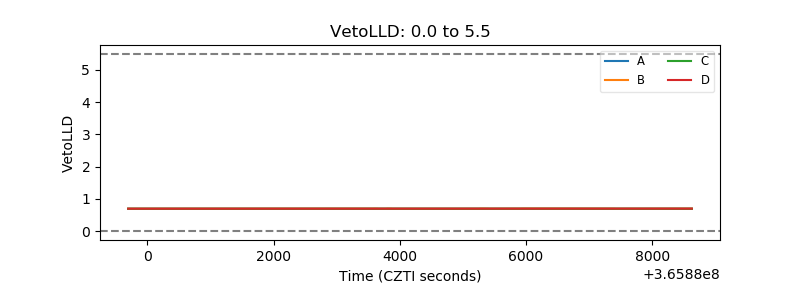 |
| Alpha Counter | 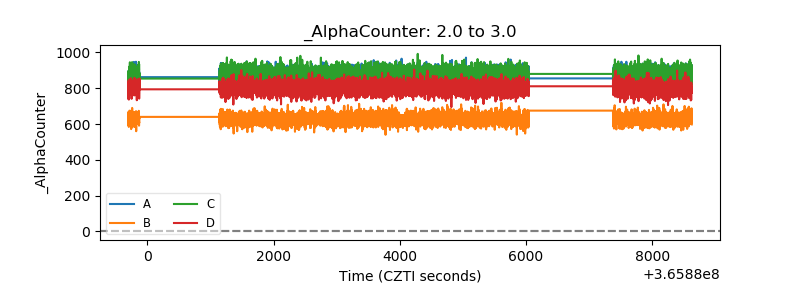 |
| _CPM_Rate | 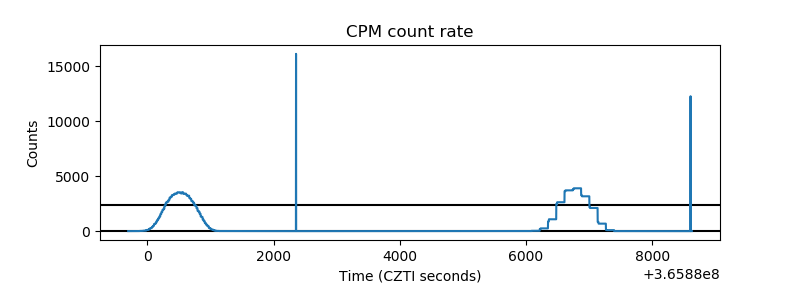 |
| CZT Counter | 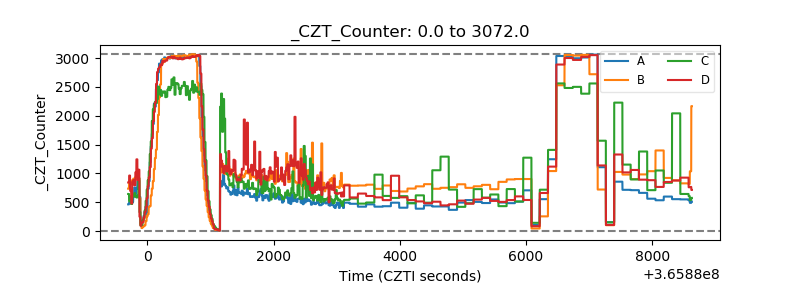 |
| +2.5 Volts monitor | 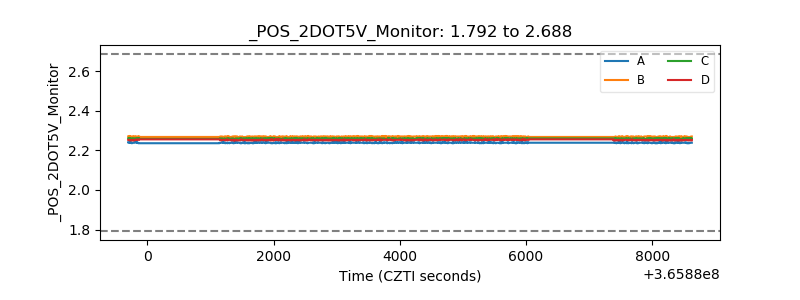 |
| +5 Volts monitor |  |
| _ROLL_ROT | 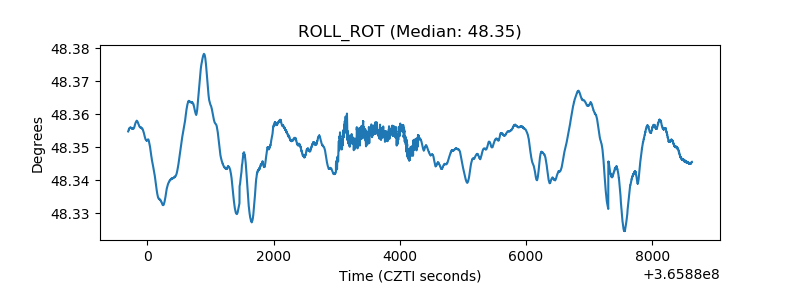 |
| _Roll_DEC | 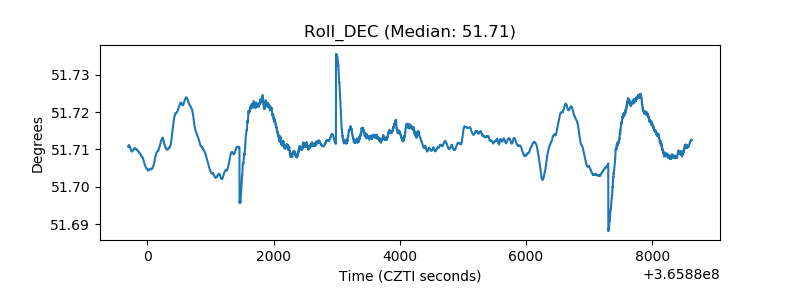 |
| _Roll_RA |  |
| Veto Counter | 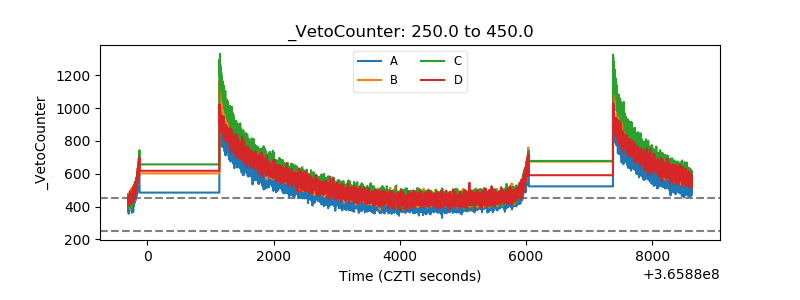 |