| Param | Original file | Final file |
|---|---|---|
| Filename | modeM0/AS1A10_056T01_9000004626_31657cztM0_level2.evt | modeM0/AS1A10_056T01_9000004626_31657cztM0_level2_quad_clean.evt |
| Size (bytes) | 611,069,760 | 121,780,800 |
| Size | 582.8 MB | 116.1 MB |
| Events in quadrant A | 3,370,226 | 821,434 |
| Events in quadrant B | 5,565,850 | 841,371 |
| Events in quadrant C | 4,847,856 | 794,474 |
| Events in quadrant D | 4,289,535 | 784,325 |
| Mode M0 | |||
|---|---|---|---|
| Quadrant | BADHDUFLAG | Total packets | Discarded packets |
| A | 0 | 14104 | 2 |
| B | 0 | 20847 | 3 |
| C | 0 | 18594 | 2 |
| D | 0 | 17032 | 2 |
| Mode M9 | |||
|---|---|---|---|
| Quadrant | BADHDUFLAG | Total packets | Discarded packets |
| A | 0 | 28 | 0 |
| B | 0 | 28 | 0 |
| C | 0 | 28 | 0 |
| D | 0 | 28 | 0 |
| Mode SS | |||
|---|---|---|---|
| Quadrant | BADHDUFLAG | Total packets | Discarded packets |
| A | 0 | 130 | 0 |
| B | 0 | 130 | 0 |
| C | 0 | 130 | 0 |
| D | 0 | 130 | 0 |
| Quadrant | Total seconds | Saturated seconds | Saturation percentage |
|---|---|---|---|
| A | 6410 | 74 | 1.154446% |
| B | 6410 | 216 | 3.369735% |
| C | 6410 | 632 | 9.859594% |
| D | 6410 | 110 | 1.716069% |
Noise dominated data is calculated using 1-second bins in cleaned event files. If a bin has >2000 counts, and if more than 50% of those come from <1% of pixels, then it is considered to be noise-dominated and hence unusable.
| Quadrant | # 1 sec bins | Bins with >0 counts | Bins with >2000 counts | High rate bins dominated by noise | Noise dominated (total time) | Noise dominated (detector-on time) | Marked lightcurve |
|---|---|---|---|---|---|---|---|
| A | 9150 | 6412 | 0 | 0 | 0.00% | 0.00% | 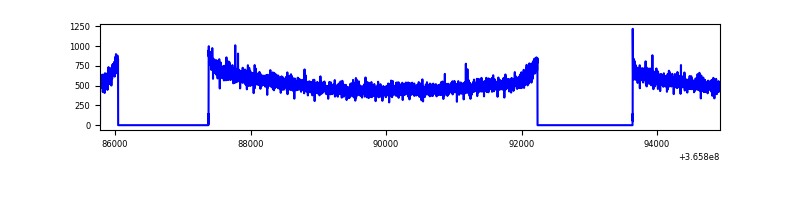 |
| B | 9150 | 6412 | 39 | 39 | 0.43% | 0.61% | 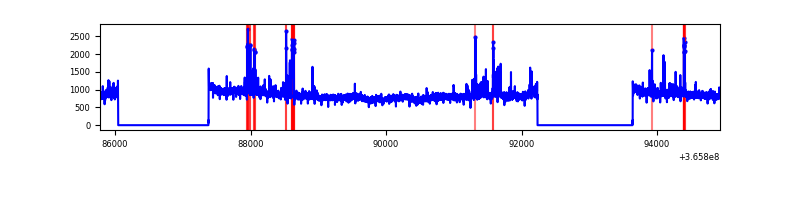 |
| C | 9150 | 6412 | 241 | 241 | 2.63% | 3.76% | 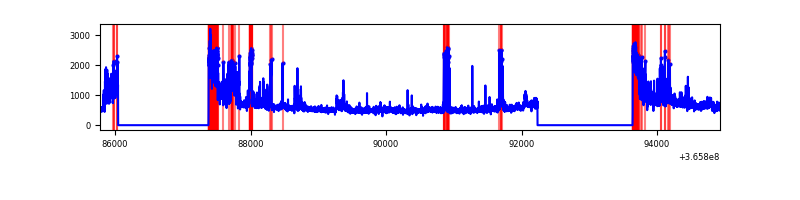 |
| D | 9150 | 6412 | 27 | 27 | 0.30% | 0.42% | 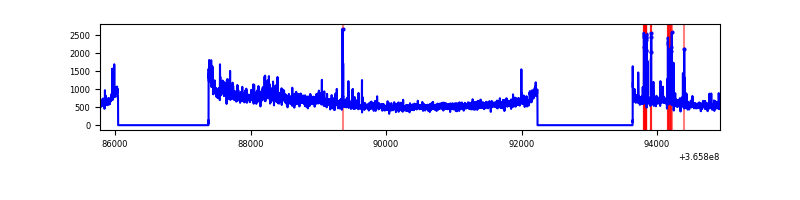 |
Top three noisy pixels from each quadrant. If the there are fewer than three noisy pixels in the level2.evt file, extra rows are filled as -1
| Pixel properties | Quadrant properties | ||||||
|---|---|---|---|---|---|---|---|
| Quadrant | DetID | PixID | Counts | Sigma | Mean | Median | Sigma |
| A | 13 | 254 | 12497 | 67.74 | 872 | 856 | 171.8 |
| A | 3 | 137 | 8020 | 41.69 | 872 | 856 | 171.8 |
| A | 0 | 226 | 7290 | 37.44 | 872 | 856 | 171.8 |
| B | 6 | 159 | 1794099 | 11022.0 | 877 | 855 | 162.7 |
| B | 10 | 245 | 135026 | 824.67 | 877 | 855 | 162.7 |
| B | 15 | 201 | 61767 | 374.39 | 877 | 855 | 162.7 |
| C | 0 | 10 | 608664 | 3182.91 | 825 | 832 | 191.0 |
| C | 10 | 22 | 561135 | 2934.03 | 825 | 832 | 191.0 |
| C | 3 | 233 | 282229 | 1473.54 | 825 | 832 | 191.0 |
| D | 8 | 195 | 864811 | 4330.91 | 858 | 840 | 199.5 |
| D | 13 | 249 | 120821 | 601.44 | 858 | 840 | 199.5 |
| D | 2 | 234 | 27915 | 135.72 | 858 | 840 | 199.5 |
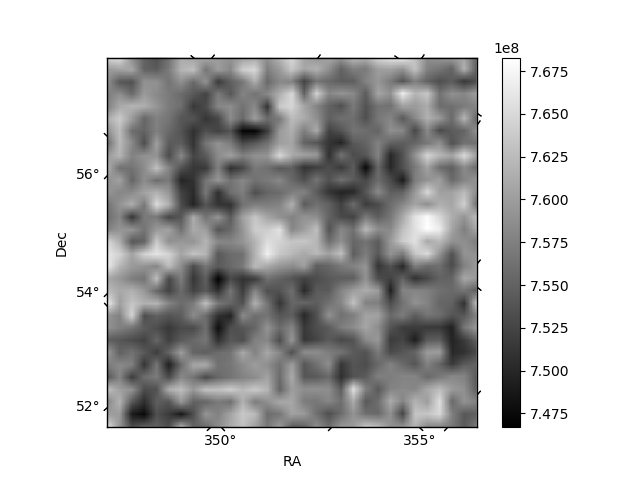
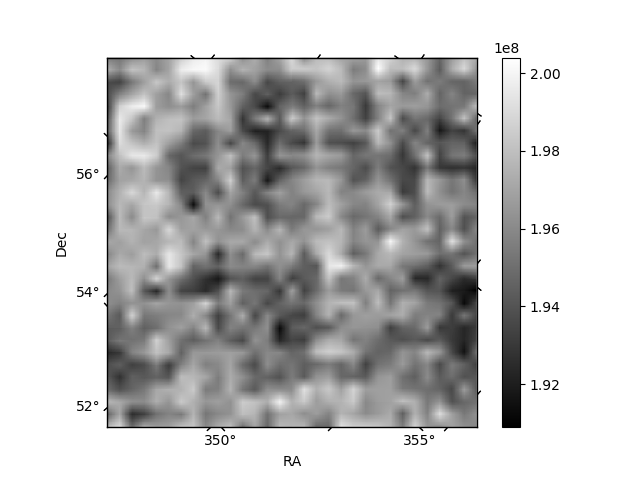
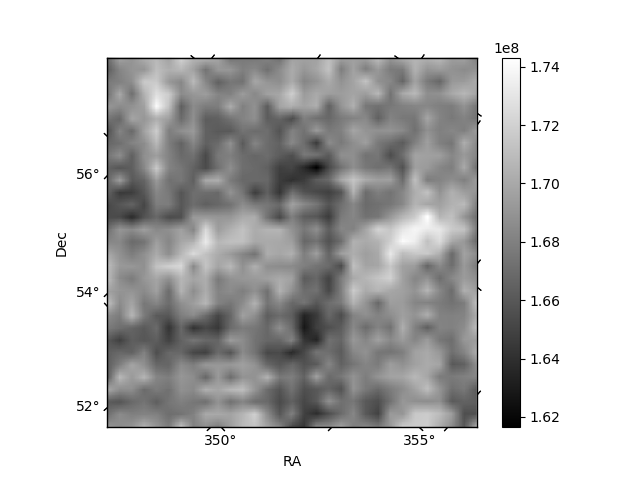
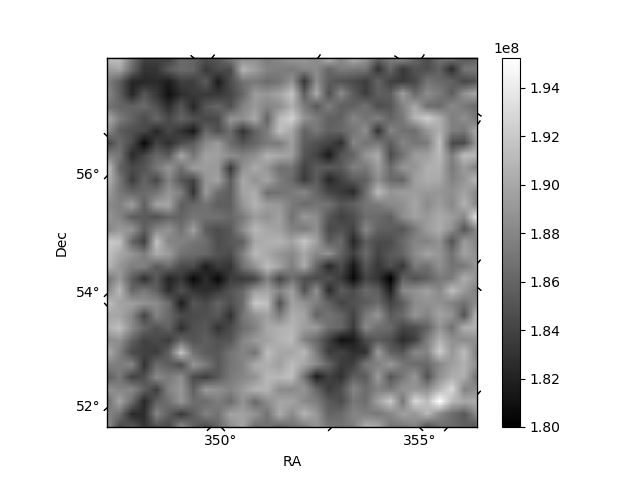
Histogram calculated using DETX and DETY for each event in the final _common_clean file
| Quadrant A | 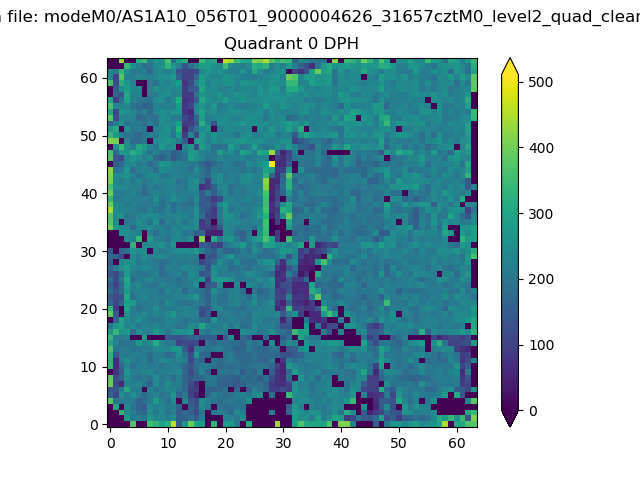 |
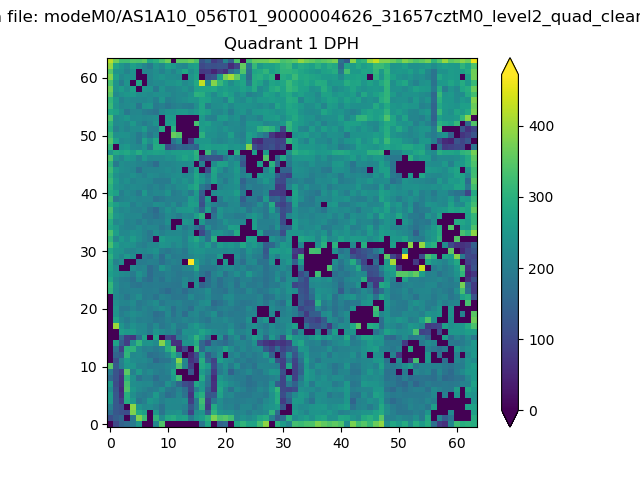 |
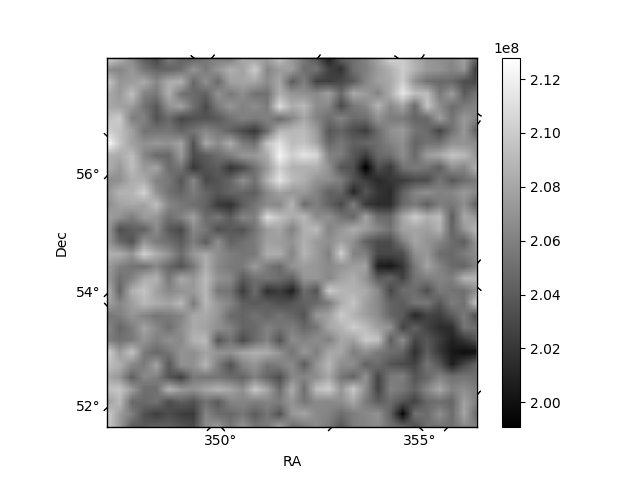
Quadrant B |
|---|---|---|---|
| Quadrant D | 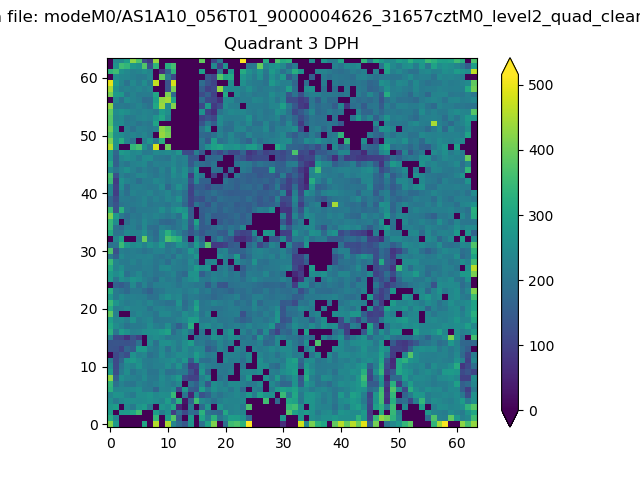 |
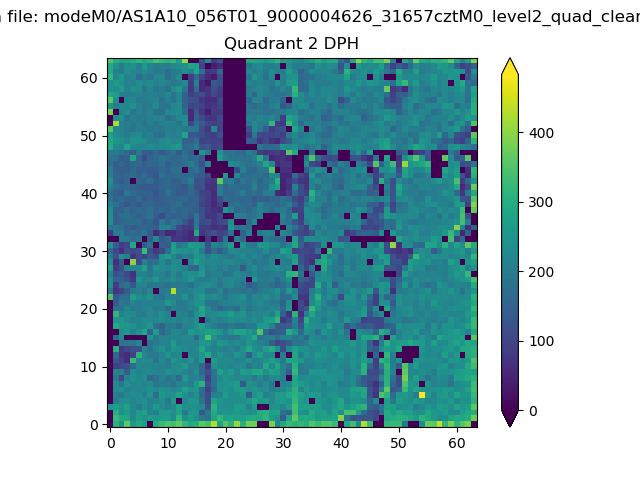 |
Quadrant C |
| Plot type | Count rate plots | Images |
|---|---|---|
| Comparison with Poisson distribution Blue bars denote a histogram of data divided into 1 sec bins. Red curve is a Poisson curve with rate = median count rate of data. |
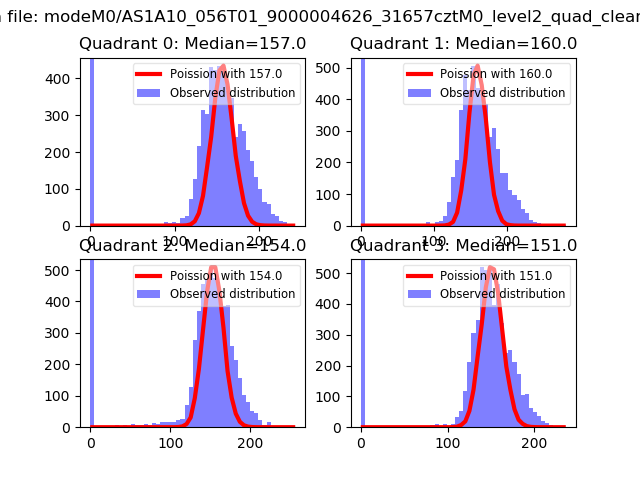 |
 |
| Quadrant-wise count rates Data is divided into 100 sec bins |
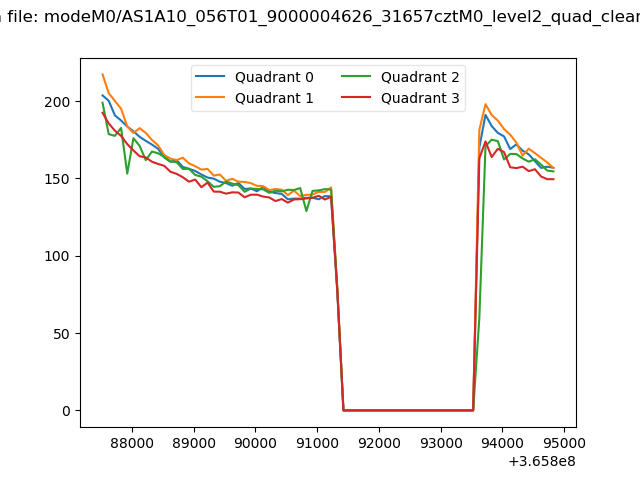 |
|
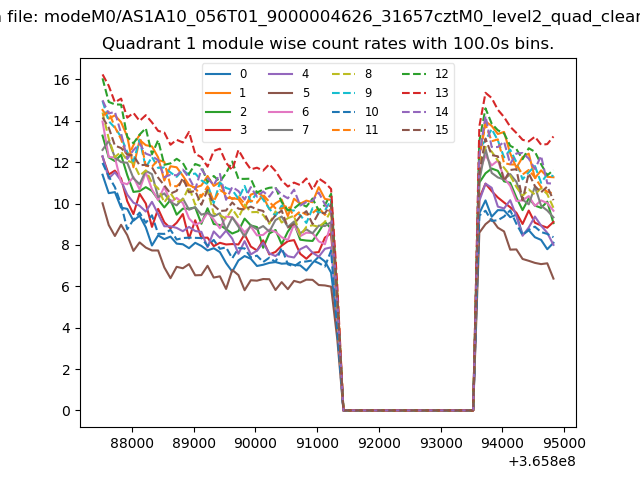
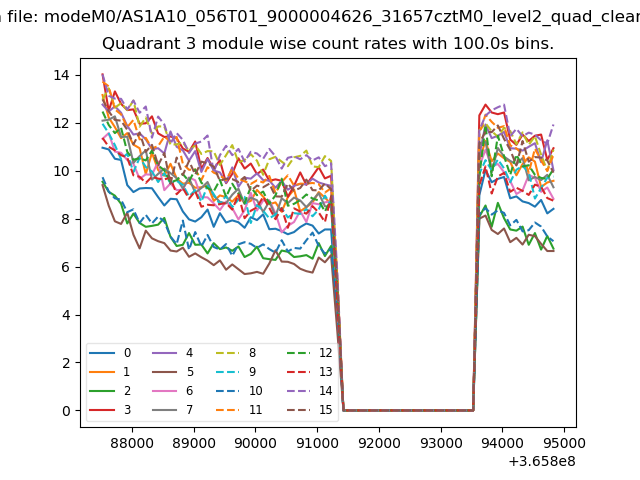
| Module-wise count rates for Quadrant A Data is divided into 100 sec bins |
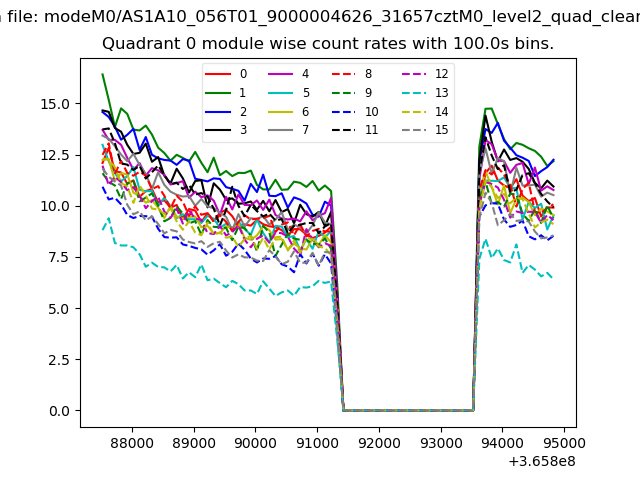 |
 |
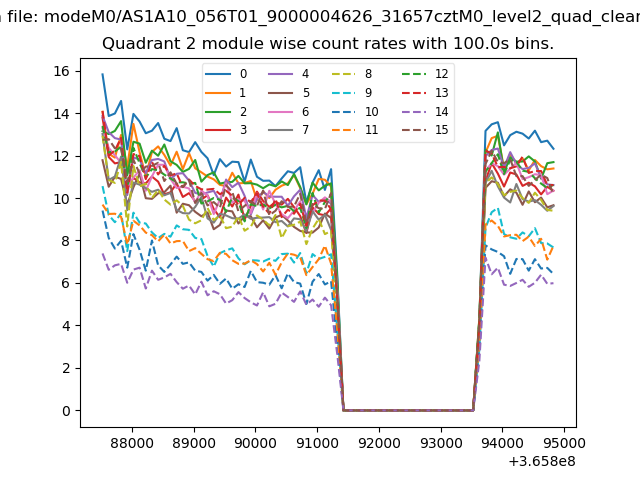
| Module-wise count rates for Quadrant B Data is divided into 100 sec bins |
 |
 |
| Module-wise count rates for Quadrant C Data is divided into 100 sec bins |
 |
 |
| Module-wise count rates for Quadrant D Data is divided into 100 sec bins |
 |
 |
| Parameter | Plot |
|---|---|
| CZT HV Monitor | 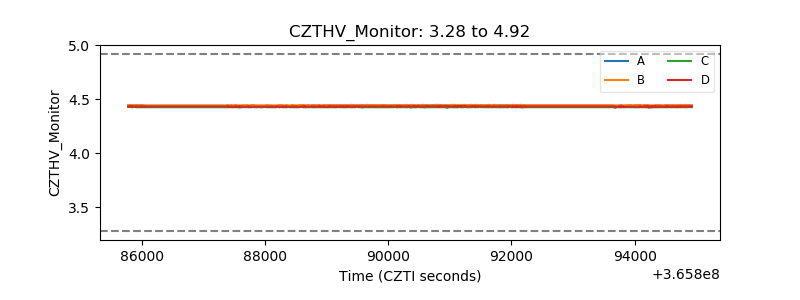 |
| D_VDD | 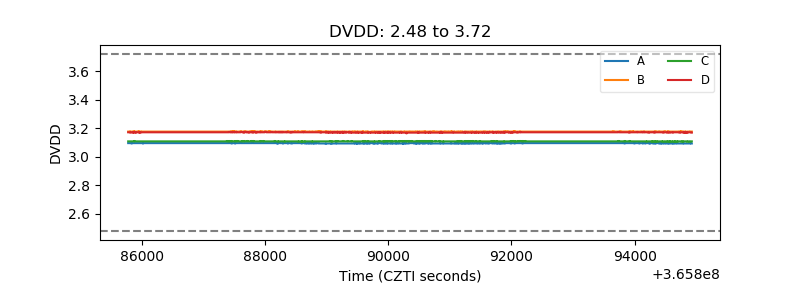 |
| Temperature 1 | 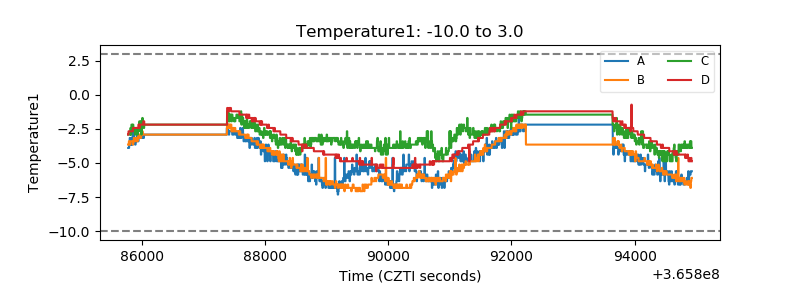 |
| Veto HV Monitor | 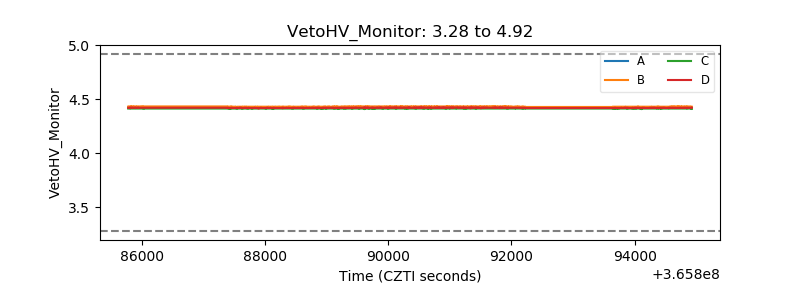 |
| Veto LLD | 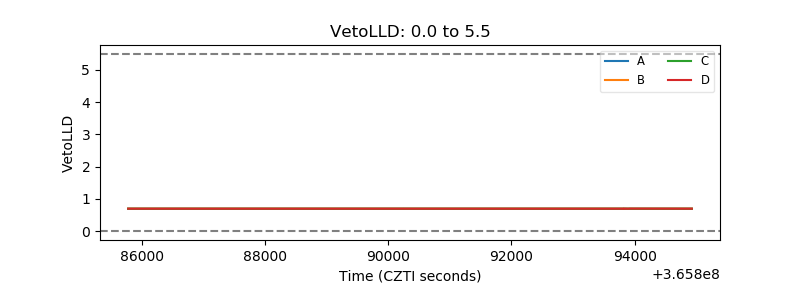 |
| Alpha Counter | 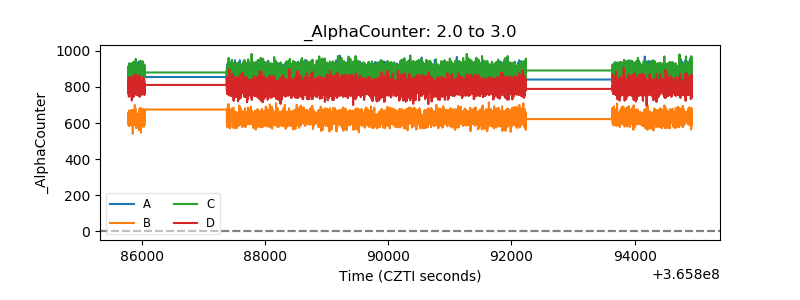 |
| _CPM_Rate | 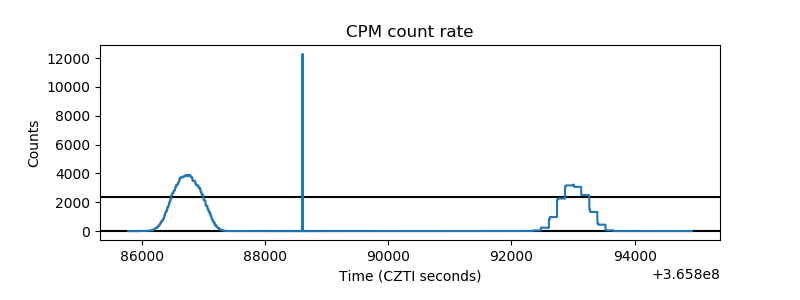 |
| CZT Counter | 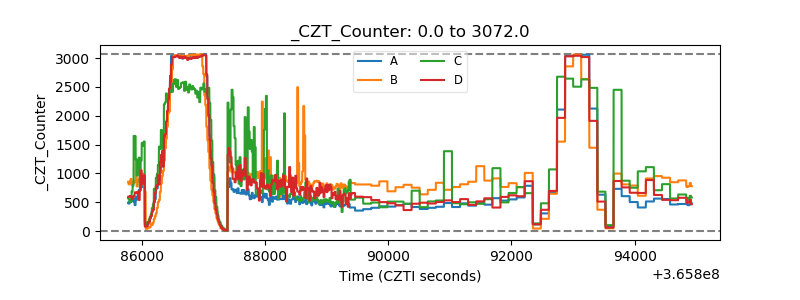 |
| +2.5 Volts monitor | 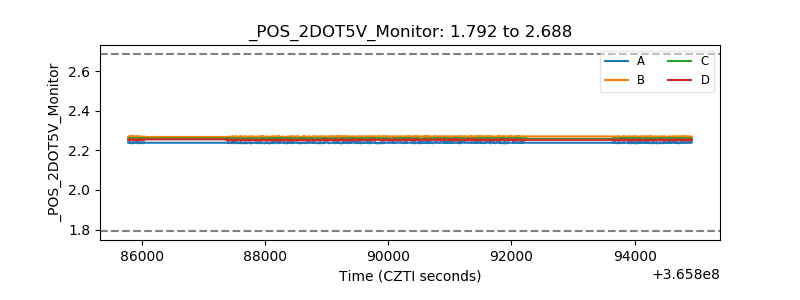 |
| +5 Volts monitor |  |
| _ROLL_ROT | 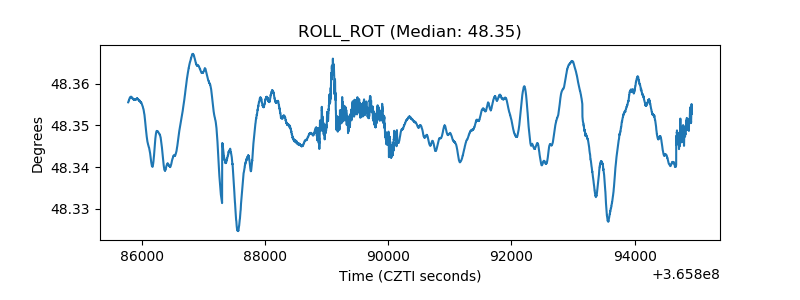 |
| _Roll_DEC | 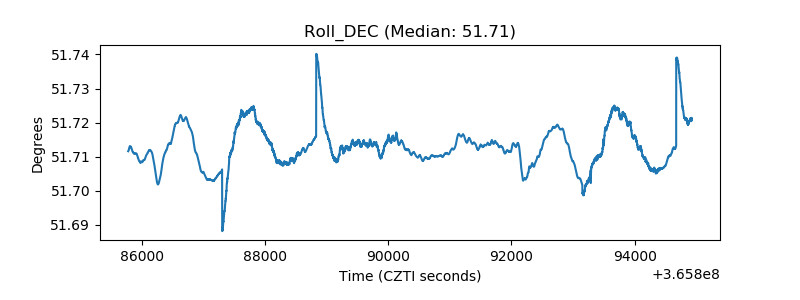 |
| _Roll_RA | 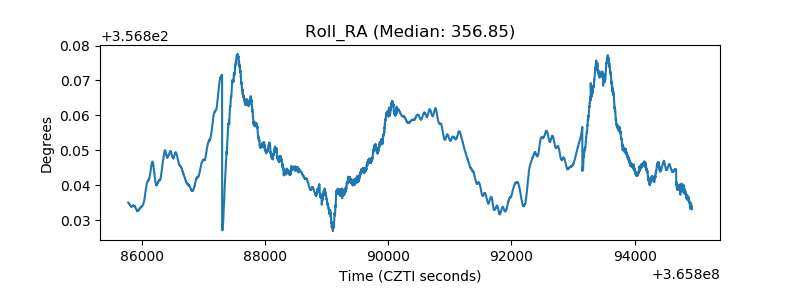 |
| Veto Counter | 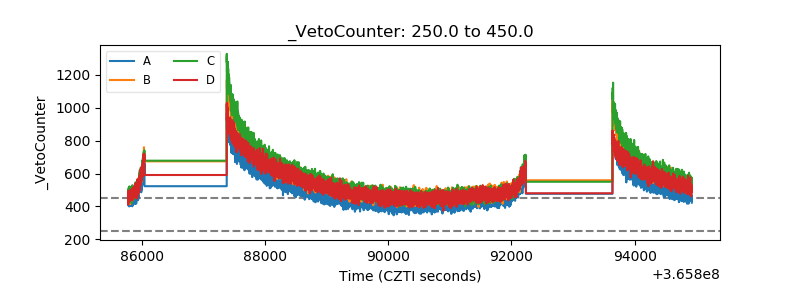 |