| Param | Original file | Final file |
|---|---|---|
| Filename | modeM0/AS1A10_056T01_9000004626_31658cztM0_level2.evt | modeM0/AS1A10_056T01_9000004626_31658cztM0_level2_quad_clean.evt |
| Size (bytes) | 577,915,200 | 112,671,360 |
| Size | 551.1 MB | 107.5 MB |
| Events in quadrant A | 3,280,718 | 755,984 |
| Events in quadrant B | 5,536,927 | 766,281 |
| Events in quadrant C | 4,220,884 | 723,471 |
| Events in quadrant D | 4,024,213 | 713,783 |
| Mode M0 | |||
|---|---|---|---|
| Quadrant | BADHDUFLAG | Total packets | Discarded packets |
| A | 0 | 13921 | 2 |
| B | 0 | 20716 | 2 |
| C | 0 | 16668 | 2 |
| D | 0 | 16254 | 2 |
| Mode M9 | |||
|---|---|---|---|
| Quadrant | BADHDUFLAG | Total packets | Discarded packets |
| A | 0 | 28 | 0 |
| B | 0 | 28 | 0 |
| C | 0 | 28 | 0 |
| D | 0 | 28 | 0 |
| Mode SS | |||
|---|---|---|---|
| Quadrant | BADHDUFLAG | Total packets | Discarded packets |
| A | 0 | 132 | 0 |
| B | 0 | 132 | 0 |
| C | 0 | 132 | 0 |
| D | 0 | 132 | 0 |
| Quadrant | Total seconds | Saturated seconds | Saturation percentage |
|---|---|---|---|
| A | 6499 | 56 | 0.861671% |
| B | 6500 | 247 | 3.800000% |
| C | 6500 | 373 | 5.738462% |
| D | 6500 | 149 | 2.292308% |
Noise dominated data is calculated using 1-second bins in cleaned event files. If a bin has >2000 counts, and if more than 50% of those come from <1% of pixels, then it is considered to be noise-dominated and hence unusable.
| Quadrant | # 1 sec bins | Bins with >0 counts | Bins with >2000 counts | High rate bins dominated by noise | Noise dominated (total time) | Noise dominated (detector-on time) | Marked lightcurve |
|---|---|---|---|---|---|---|---|
| A | 9214 | 6501 | 2 | 2 | 0.02% | 0.03% | 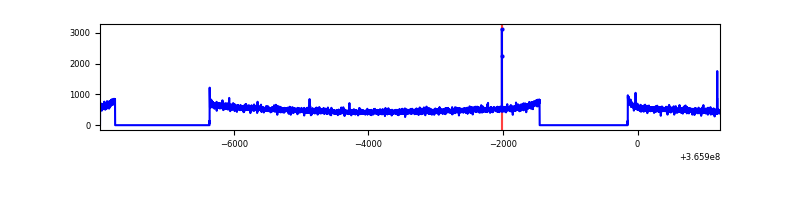 |
| B | 9215 | 6502 | 35 | 35 | 0.38% | 0.54% | 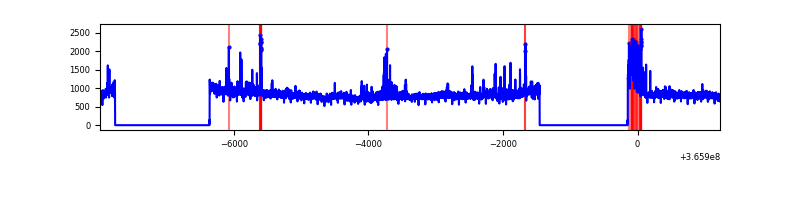 |
| C | 9215 | 6502 | 139 | 139 | 1.51% | 2.14% | 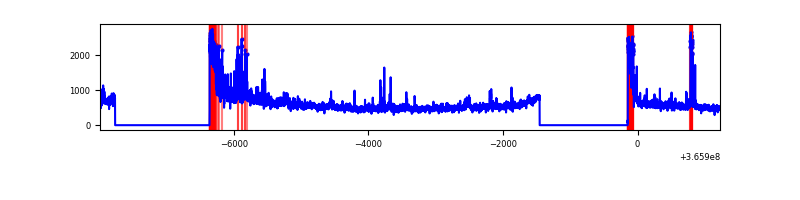 |
| D | 9215 | 6502 | 72 | 72 | 0.78% | 1.11% | 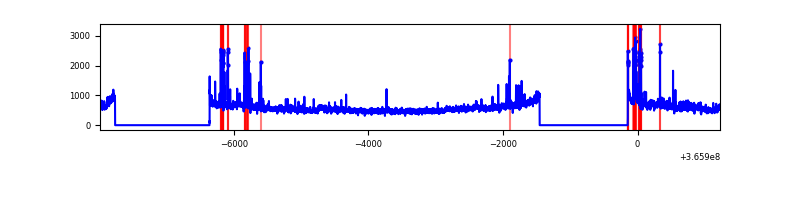 |
Top three noisy pixels from each quadrant. If the there are fewer than three noisy pixels in the level2.evt file, extra rows are filled as -1
| Pixel properties | Quadrant properties | ||||||
|---|---|---|---|---|---|---|---|
| Quadrant | DetID | PixID | Counts | Sigma | Mean | Median | Sigma |
| A | 13 | 254 | 12526 | 70.22 | 847 | 832 | 166.5 |
| A | 15 | 174 | 10250 | 56.55 | 847 | 832 | 166.5 |
| A | 3 | 137 | 8166 | 44.04 | 847 | 832 | 166.5 |
| B | 6 | 159 | 1853386 | 11696.92 | 849 | 830 | 158.4 |
| B | 10 | 245 | 193898 | 1219.02 | 849 | 830 | 158.4 |
| B | 0 | 190 | 52710 | 327.57 | 849 | 830 | 158.4 |
| C | 0 | 10 | 503646 | 2689.29 | 813 | 820 | 187.0 |
| C | 3 | 233 | 219239 | 1168.18 | 813 | 820 | 187.0 |
| C | 10 | 22 | 155880 | 829.31 | 813 | 820 | 187.0 |
| D | 8 | 195 | 655159 | 3403.62 | 823 | 803 | 192.3 |
| D | 13 | 249 | 206081 | 1067.75 | 823 | 803 | 192.3 |
| D | 2 | 250 | 31472 | 159.52 | 823 | 803 | 192.3 |
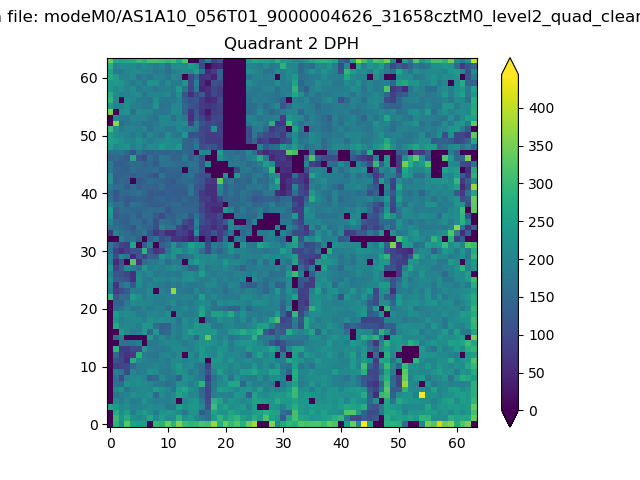
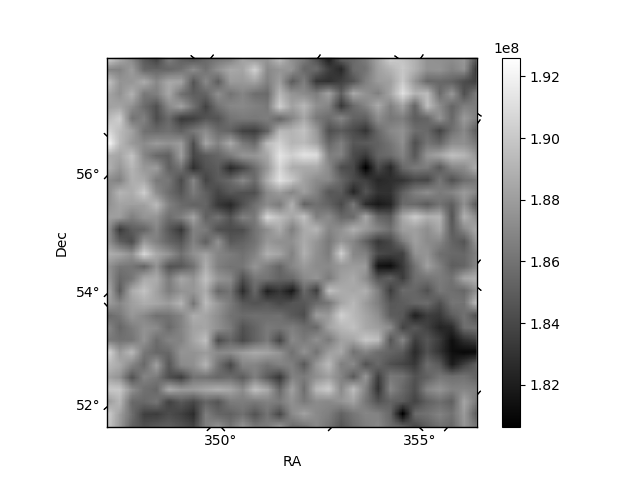
Histogram calculated using DETX and DETY for each event in the final _common_clean file
| Quadrant A | 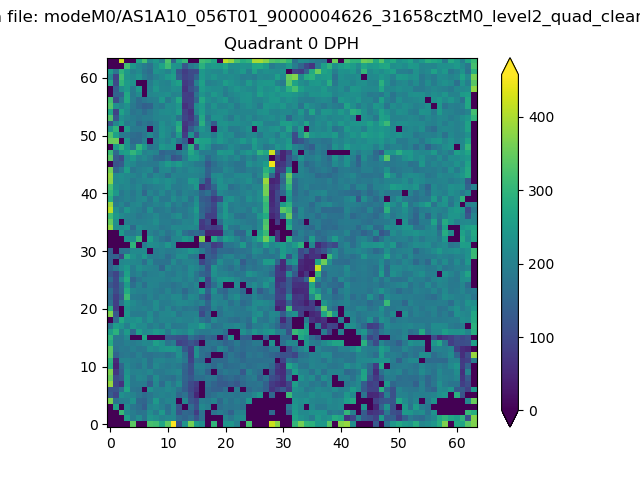 |
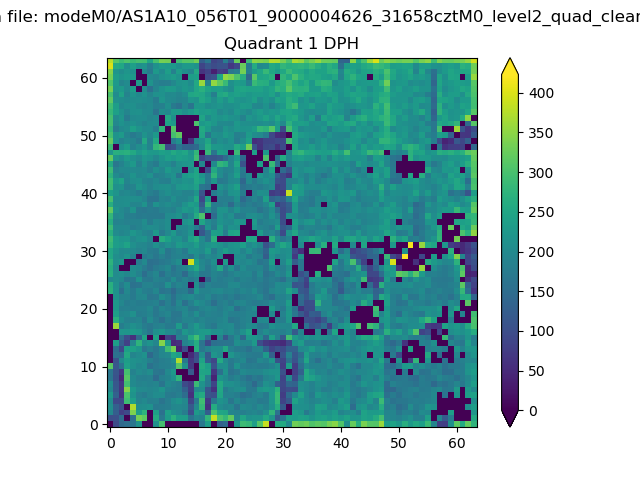 |
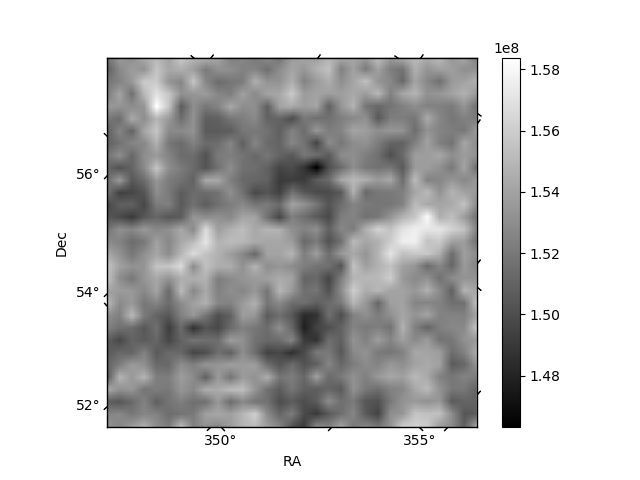
Quadrant B |
|---|---|---|---|
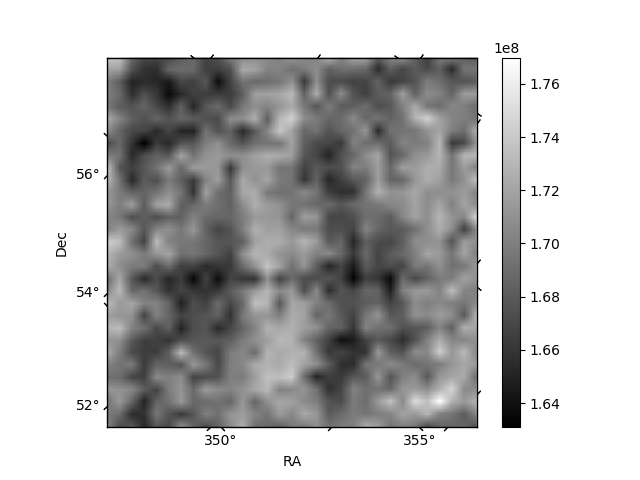
| Quadrant D | 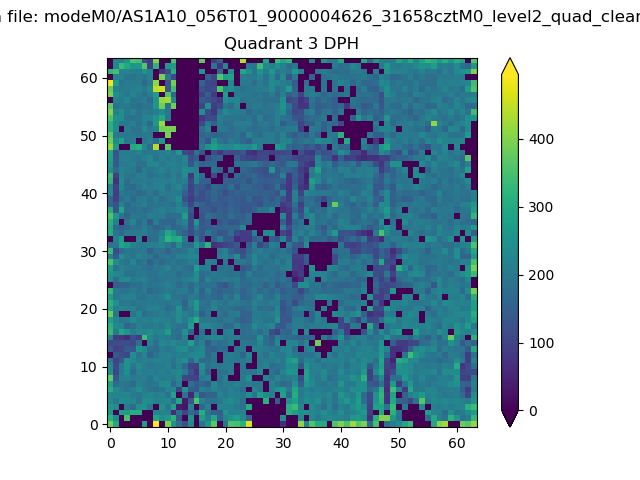 |
 |
Quadrant C |
| Plot type | Count rate plots | Images |
|---|---|---|
| Comparison with Poisson distribution Blue bars denote a histogram of data divided into 1 sec bins. Red curve is a Poisson curve with rate = median count rate of data. |
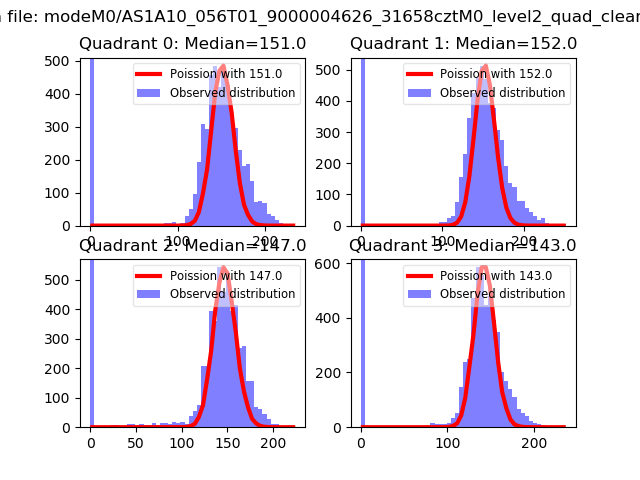 |
 |
| Quadrant-wise count rates Data is divided into 100 sec bins |
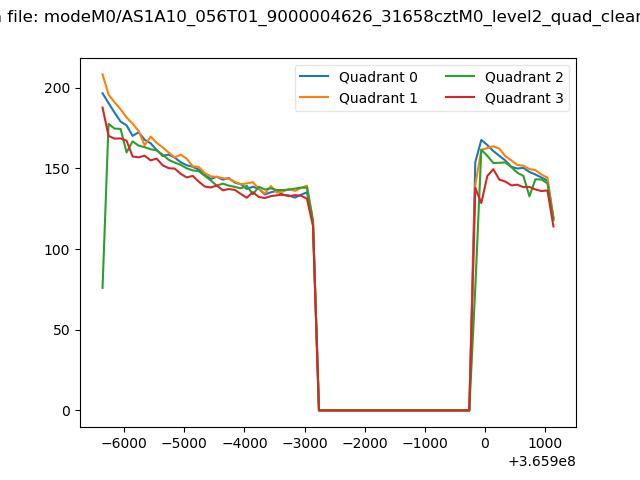 |
|
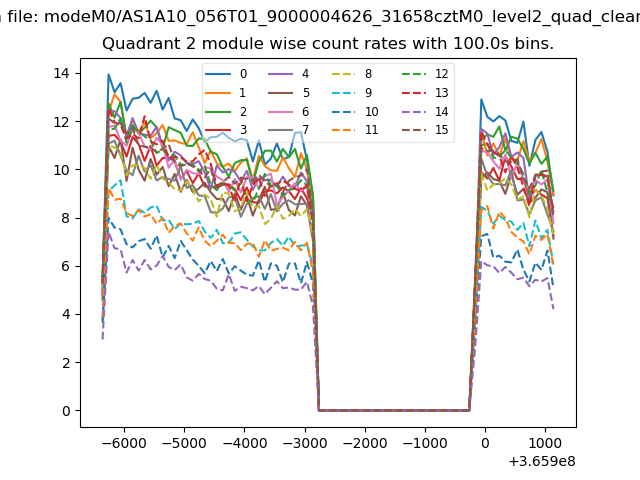
| Module-wise count rates for Quadrant A Data is divided into 100 sec bins |
 |
 |
| Module-wise count rates for Quadrant B Data is divided into 100 sec bins |
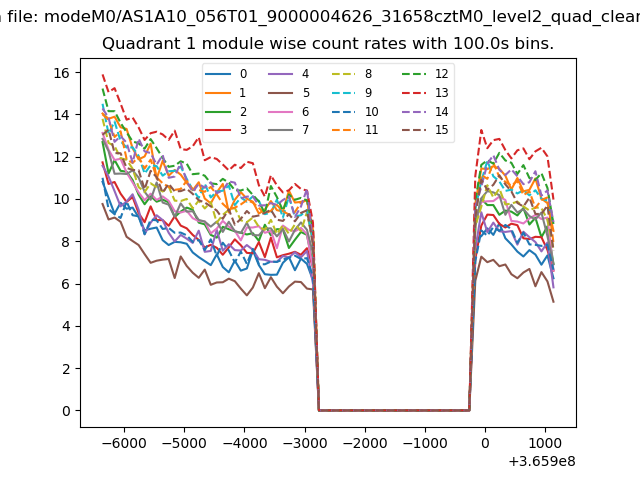 |
 |
| Module-wise count rates for Quadrant C Data is divided into 100 sec bins |
 |
 |
| Module-wise count rates for Quadrant D Data is divided into 100 sec bins |
 |
 |
| Parameter | Plot |
|---|---|
| CZT HV Monitor | 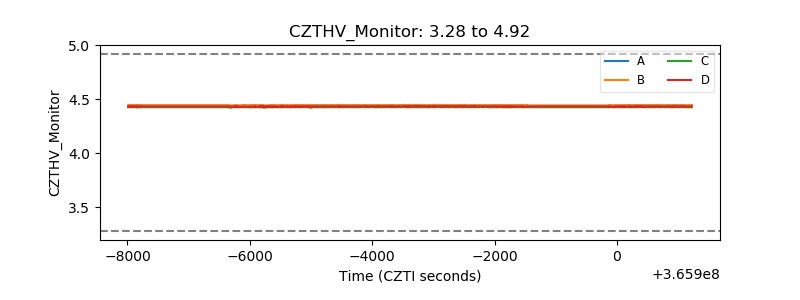 |
| D_VDD | 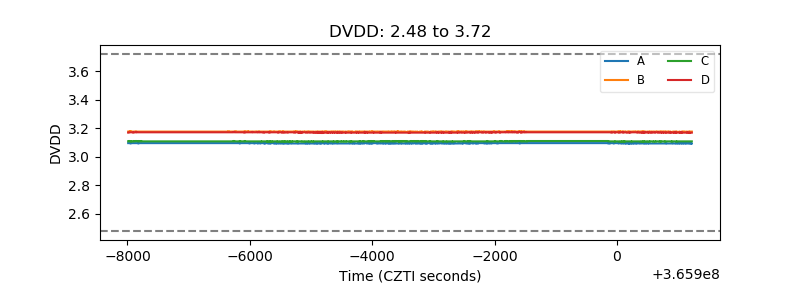 |
| Temperature 1 | 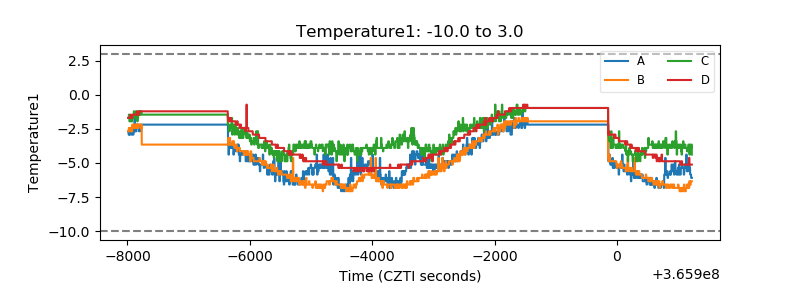 |
| Veto HV Monitor | 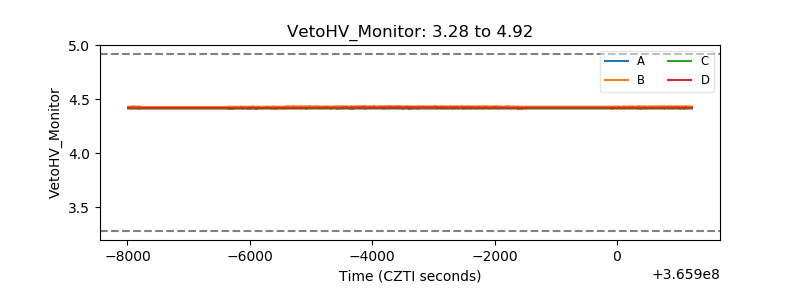 |
| Veto LLD | 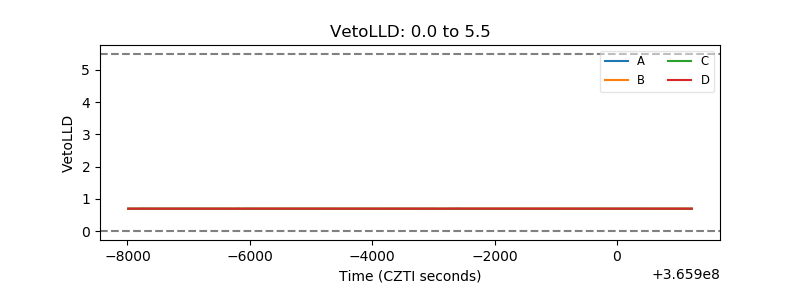 |
| Alpha Counter | 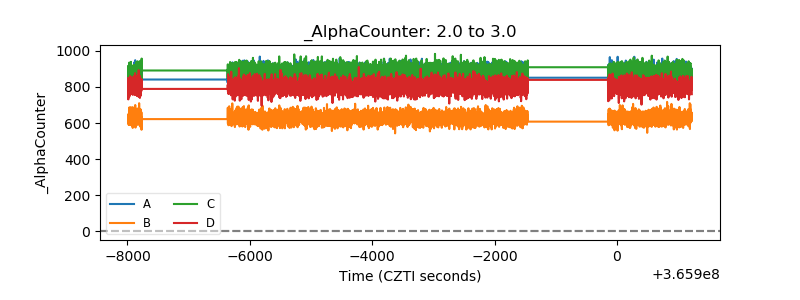 |
| _CPM_Rate | 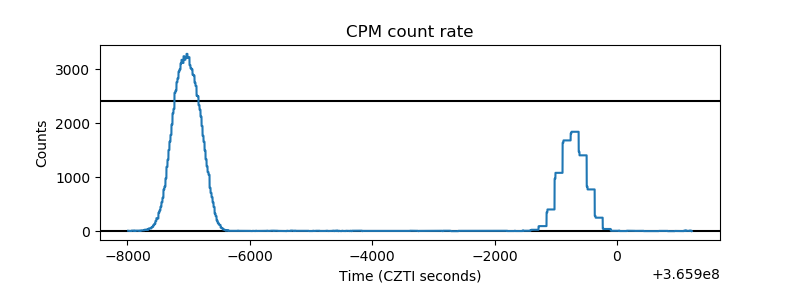 |
| CZT Counter |  |
| +2.5 Volts monitor |  |
| +5 Volts monitor |  |
| _ROLL_ROT |  |
| _Roll_DEC |  |
| _Roll_RA |  |
| Veto Counter | 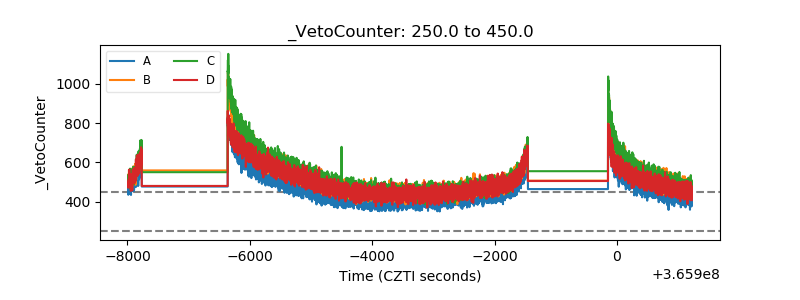 |