| Param | Original file | Final file |
|---|---|---|
| Filename | modeM0/AS1A10_056T01_9000004626_31659cztM0_level2.evt | modeM0/AS1A10_056T01_9000004626_31659cztM0_level2_quad_clean.evt |
| Size (bytes) | 595,316,160 | 96,304,320 |
| Size | 567.7 MB | 91.8 MB |
| Events in quadrant A | 3,202,588 | 632,808 |
| Events in quadrant B | 5,511,827 | 636,971 |
| Events in quadrant C | 4,793,095 | 589,978 |
| Events in quadrant D | 4,079,245 | 600,717 |
| Mode M0 | |||
|---|---|---|---|
| Quadrant | BADHDUFLAG | Total packets | Discarded packets |
| A | 0 | 13793 | 2 |
| B | 0 | 21100 | 2 |
| C | 0 | 18478 | 2 |
| D | 0 | 16311 | 2 |
| Mode M9 | |||
|---|---|---|---|
| Quadrant | BADHDUFLAG | Total packets | Discarded packets |
| A | 0 | 25 | 0 |
| B | 0 | 25 | 0 |
| C | 0 | 25 | 0 |
| D | 0 | 25 | 0 |
| Mode SS | |||
|---|---|---|---|
| Quadrant | BADHDUFLAG | Total packets | Discarded packets |
| A | 0 | 132 | 0 |
| B | 0 | 132 | 0 |
| C | 0 | 132 | 0 |
| D | 0 | 132 | 0 |
| Quadrant | Total seconds | Saturated seconds | Saturation percentage |
|---|---|---|---|
| A | 6545 | 43 | 0.656990% |
| B | 6544 | 316 | 4.828851% |
| C | 6545 | 691 | 10.557678% |
| D | 6545 | 112 | 1.711230% |
Noise dominated data is calculated using 1-second bins in cleaned event files. If a bin has >2000 counts, and if more than 50% of those come from <1% of pixels, then it is considered to be noise-dominated and hence unusable.
| Quadrant | # 1 sec bins | Bins with >0 counts | Bins with >2000 counts | High rate bins dominated by noise | Noise dominated (total time) | Noise dominated (detector-on time) | Marked lightcurve |
|---|---|---|---|---|---|---|---|
| A | 8925 | 6547 | 4 | 4 | 0.04% | 0.06% | 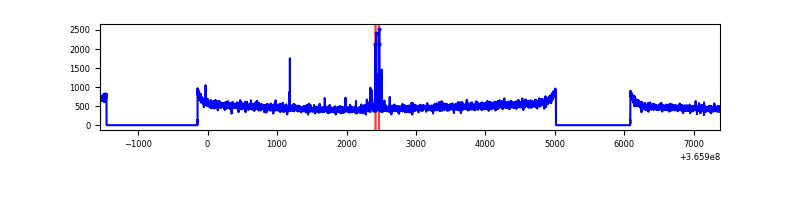 |
| B | 8924 | 6546 | 86 | 86 | 0.96% | 1.31% | 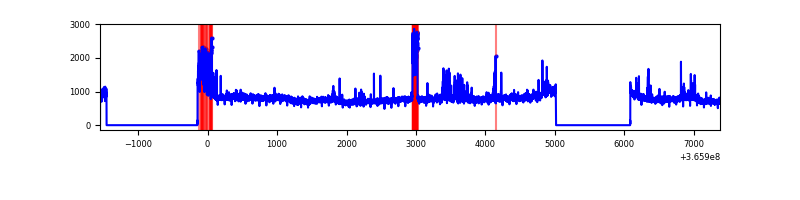 |
| C | 8925 | 6547 | 507 | 507 | 5.68% | 7.74% | 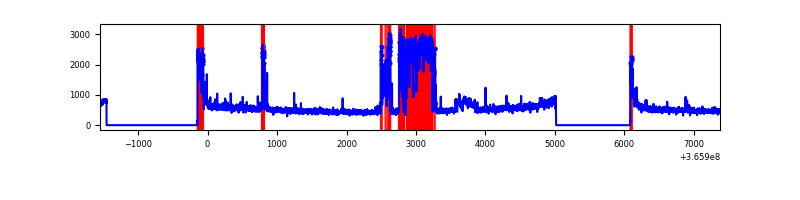 |
| D | 8925 | 6547 | 49 | 49 | 0.55% | 0.75% | 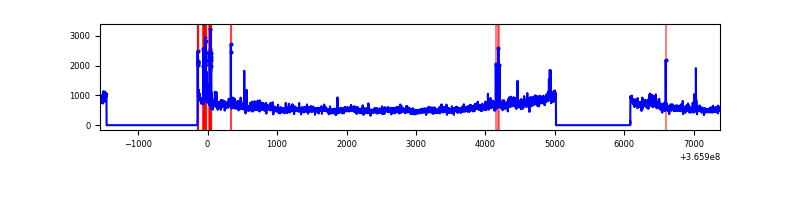 |
Top three noisy pixels from each quadrant. If the there are fewer than three noisy pixels in the level2.evt file, extra rows are filled as -1
| Pixel properties | Quadrant properties | ||||||
|---|---|---|---|---|---|---|---|
| Quadrant | DetID | PixID | Counts | Sigma | Mean | Median | Sigma |
| A | 15 | 174 | 49072 | 297.43 | 815 | 799 | 162.3 |
| A | 13 | 254 | 11990 | 68.95 | 815 | 799 | 162.3 |
| A | 3 | 137 | 7949 | 44.05 | 815 | 799 | 162.3 |
| B | 6 | 159 | 1824107 | 11868.29 | 813 | 793 | 153.6 |
| B | 10 | 245 | 301222 | 1955.55 | 813 | 793 | 153.6 |
| B | 0 | 190 | 76191 | 490.78 | 813 | 793 | 153.6 |
| C | 10 | 22 | 1278600 | 7156.03 | 759 | 762 | 178.6 |
| C | 0 | 10 | 241176 | 1346.34 | 759 | 762 | 178.6 |
| C | 3 | 233 | 150123 | 836.44 | 759 | 762 | 178.6 |
| D | 8 | 195 | 928547 | 5003.1 | 789 | 770 | 185.4 |
| D | 13 | 249 | 108594 | 581.45 | 789 | 770 | 185.4 |
| D | 6 | 0 | 29098 | 152.76 | 789 | 770 | 185.4 |
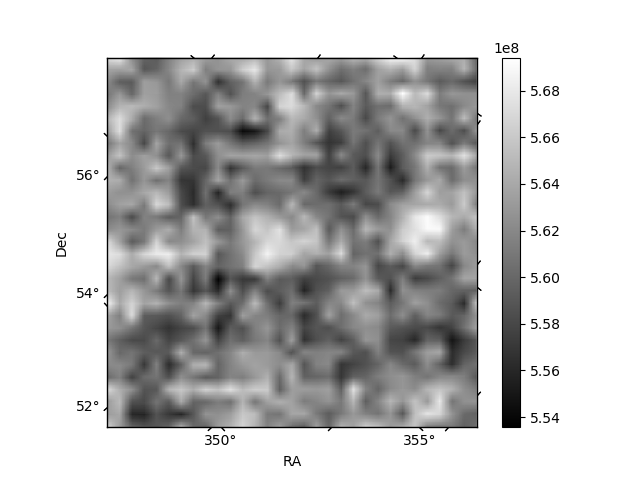
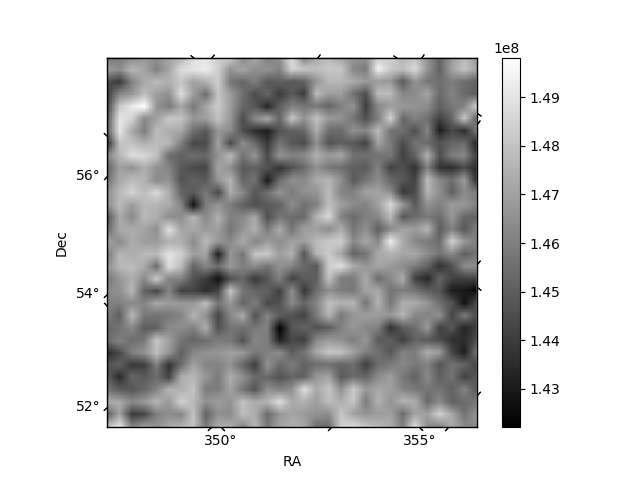
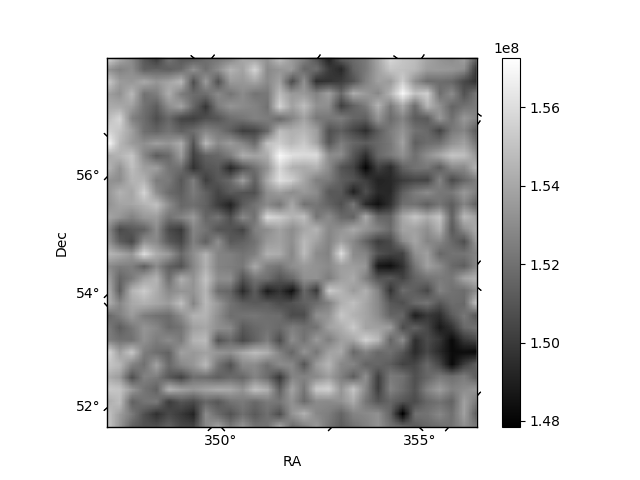
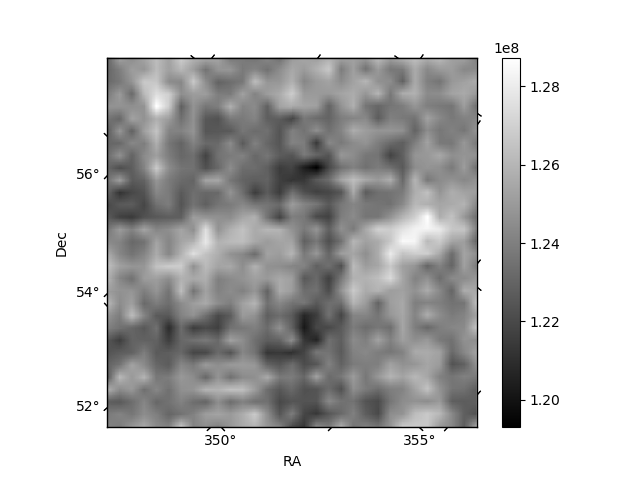
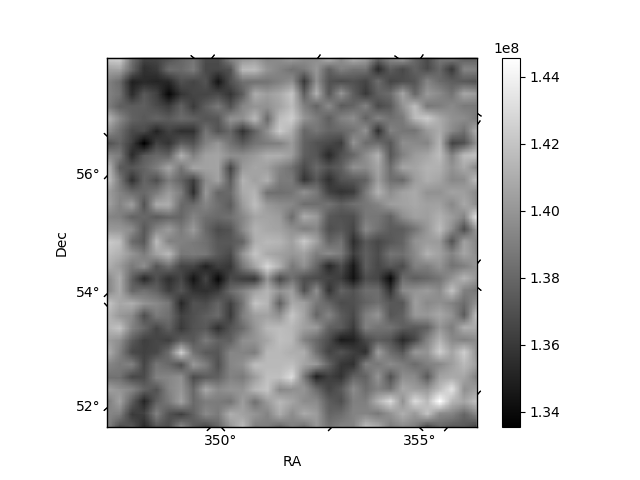
Histogram calculated using DETX and DETY for each event in the final _common_clean file
| Quadrant A | 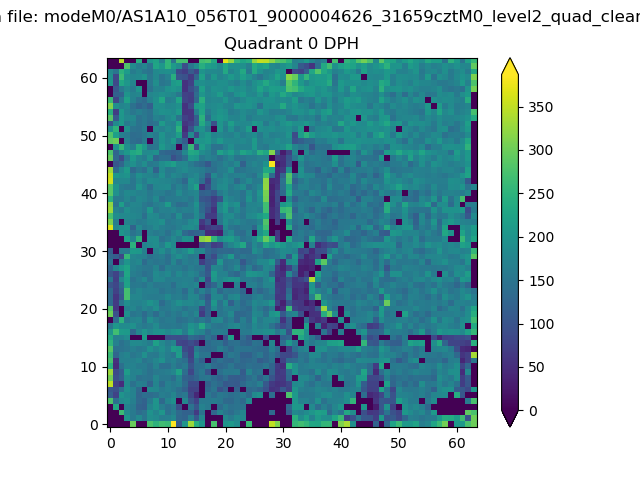 |
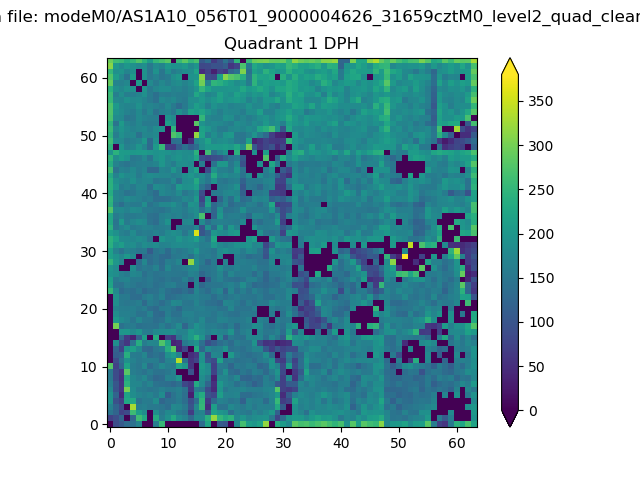 |
Quadrant B |
|---|---|---|---|
| Quadrant D | 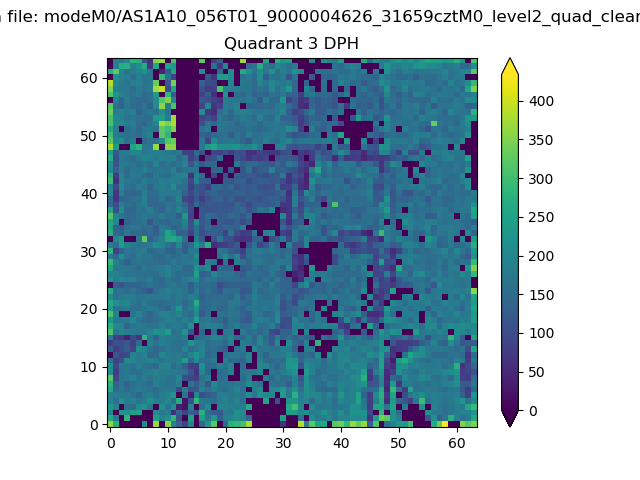 |
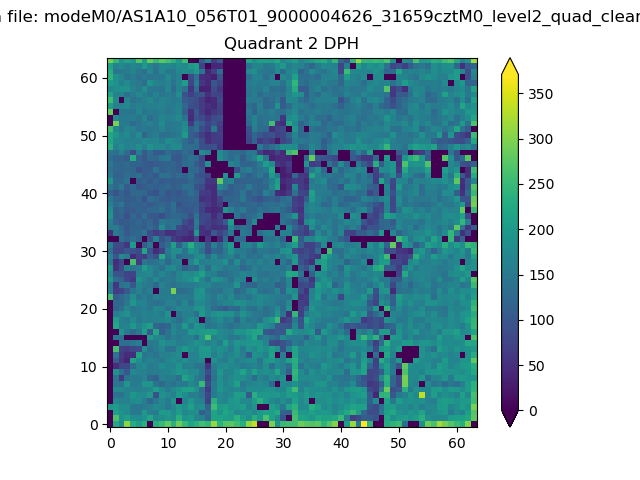 |
Quadrant C |
| Plot type | Count rate plots | Images |
|---|---|---|
| Comparison with Poisson distribution Blue bars denote a histogram of data divided into 1 sec bins. Red curve is a Poisson curve with rate = median count rate of data. |
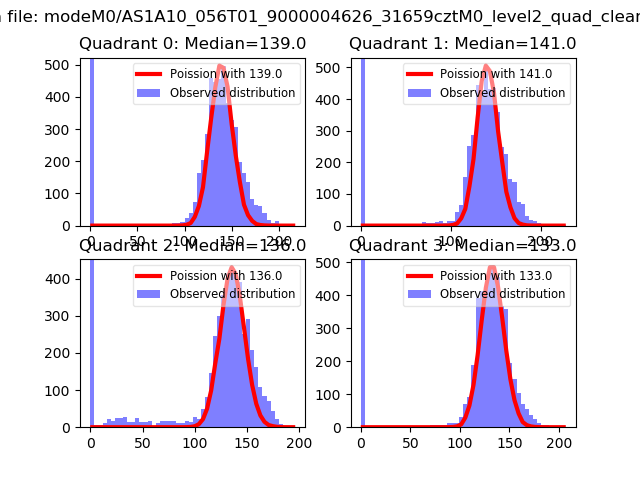 |
 |
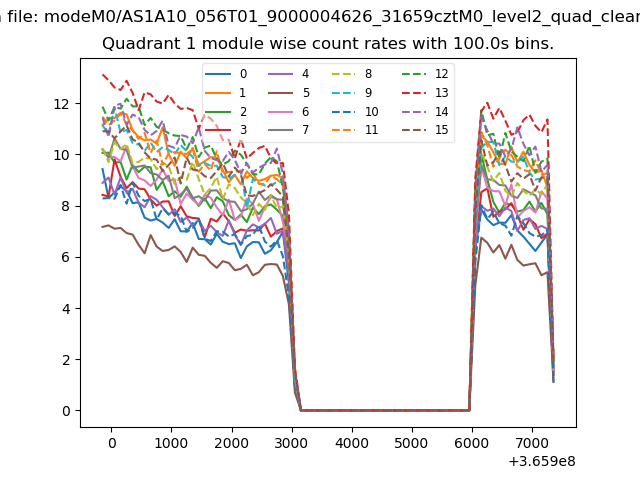
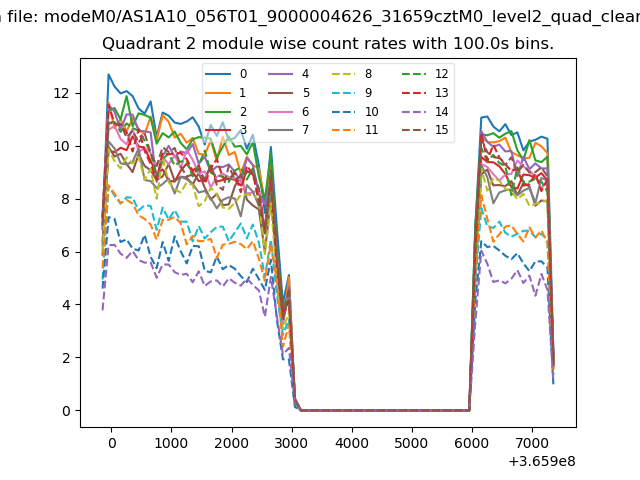
| Quadrant-wise count rates Data is divided into 100 sec bins |
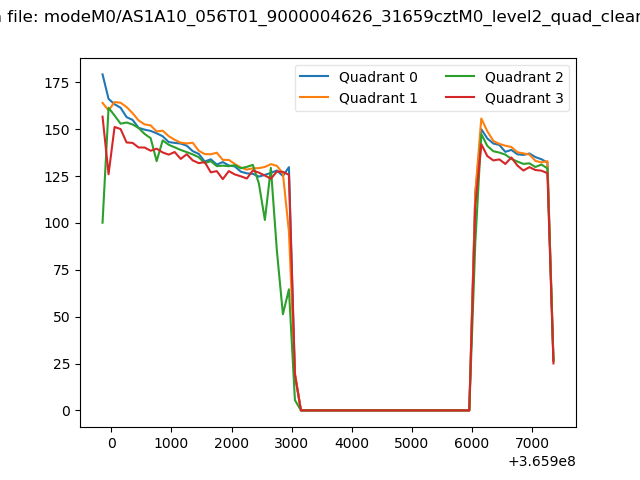 |
|
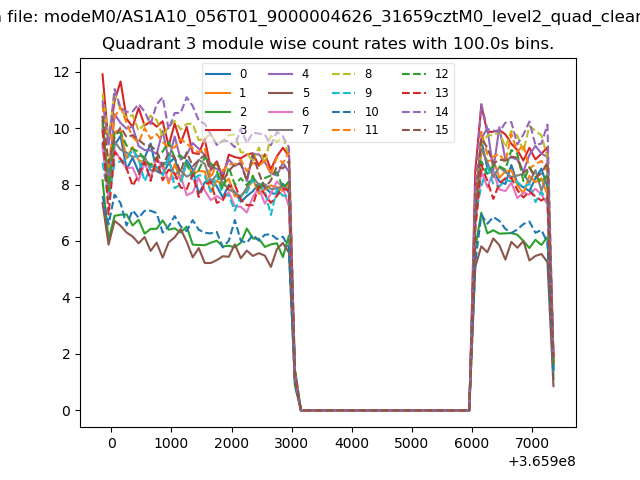
| Module-wise count rates for Quadrant A Data is divided into 100 sec bins |
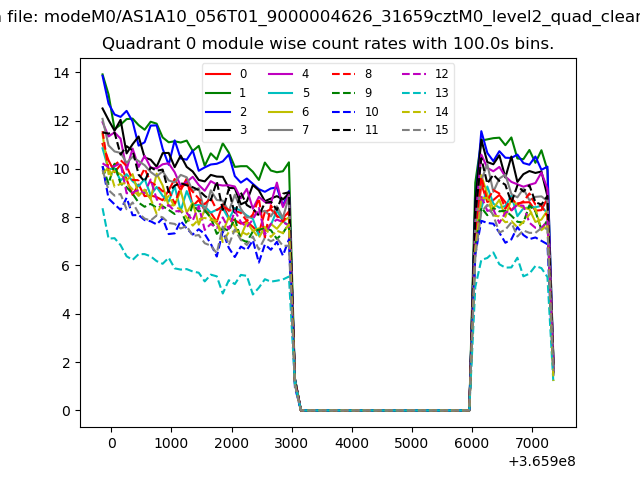 |
 |
| Module-wise count rates for Quadrant B Data is divided into 100 sec bins |
 |
 |
| Module-wise count rates for Quadrant C Data is divided into 100 sec bins |
 |
 |
| Module-wise count rates for Quadrant D Data is divided into 100 sec bins |
 |
 |
| Parameter | Plot |
|---|---|
| CZT HV Monitor | 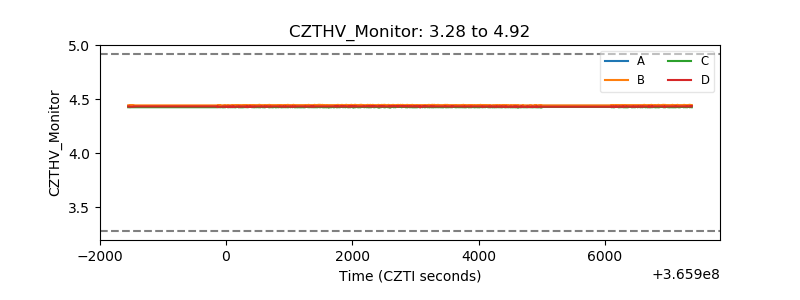 |
| D_VDD | 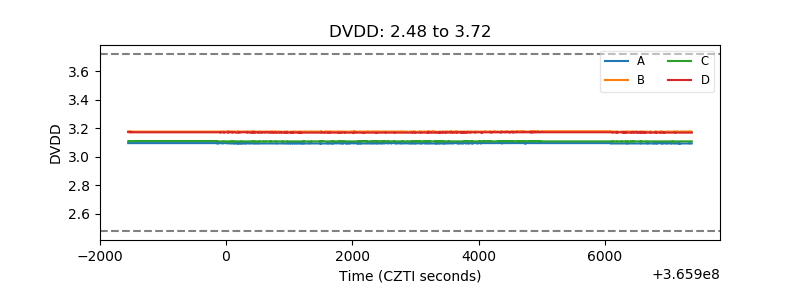 |
| Temperature 1 | 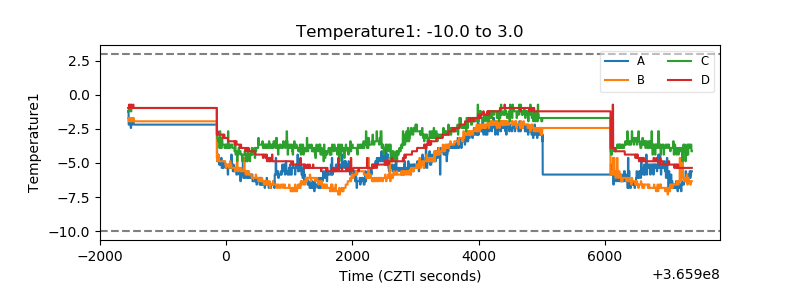 |
| Veto HV Monitor | 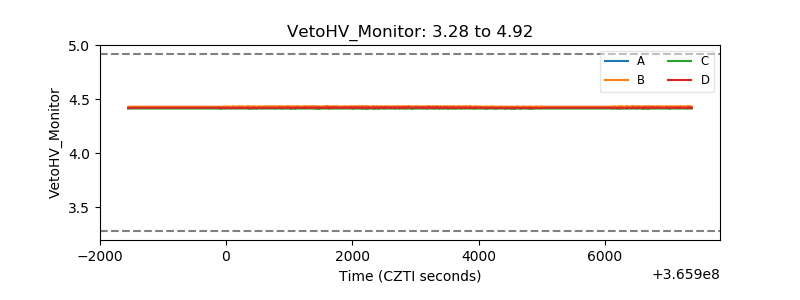 |
| Veto LLD | 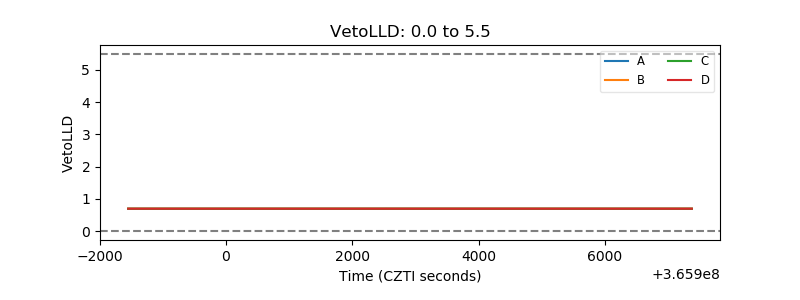 |
| Alpha Counter | 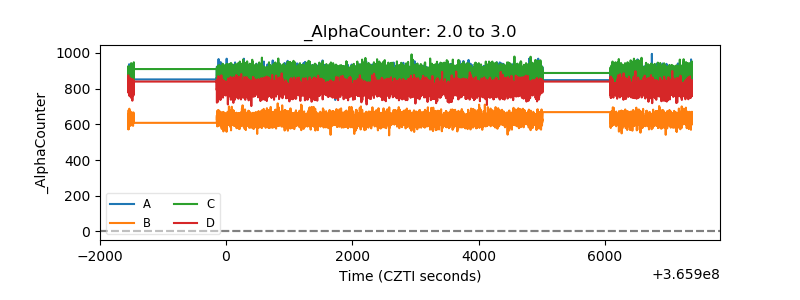 |
| _CPM_Rate | 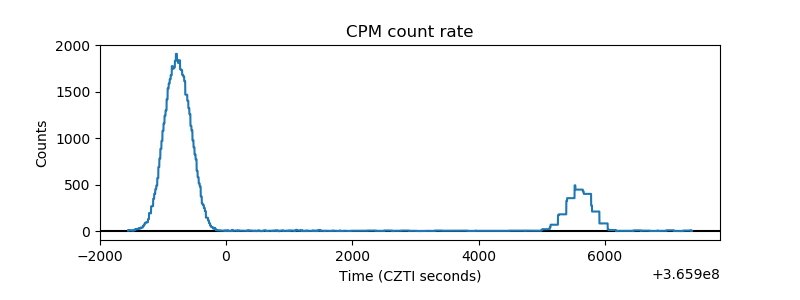 |
| CZT Counter | 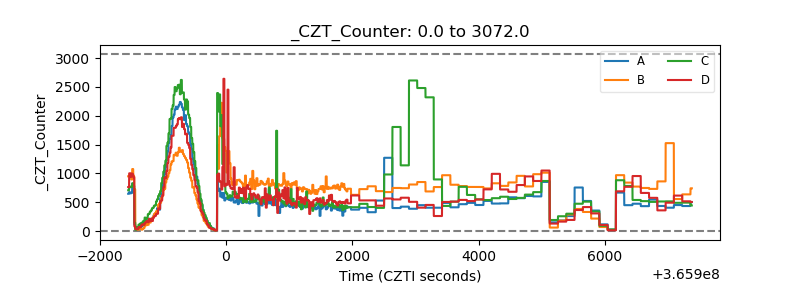 |
| +2.5 Volts monitor |  |
| +5 Volts monitor | 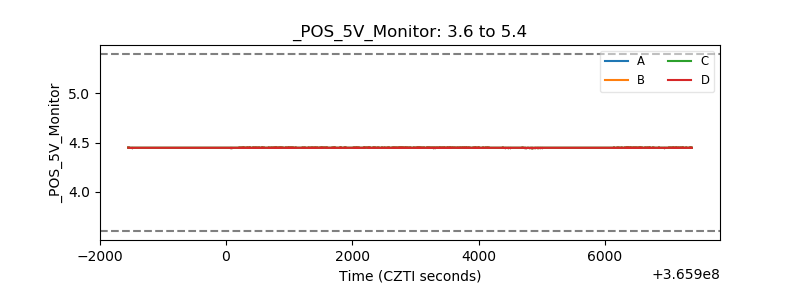 |
| _ROLL_ROT | 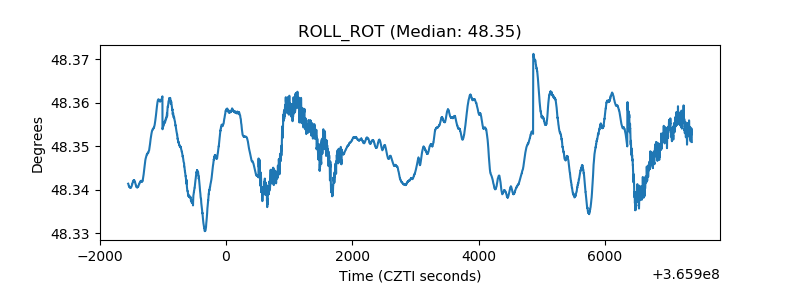 |
| _Roll_DEC | 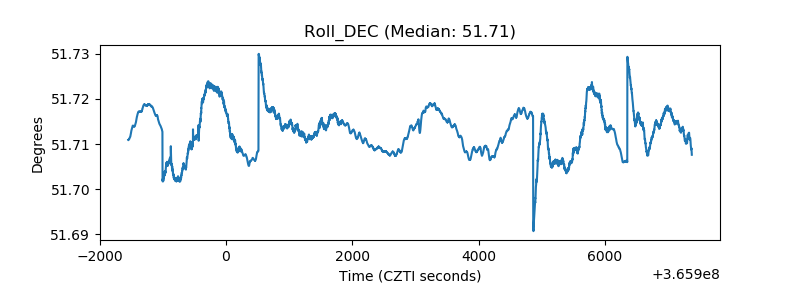 |
| _Roll_RA | 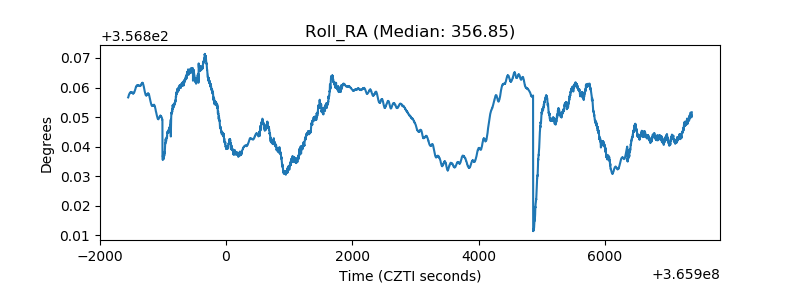 |
| Veto Counter | 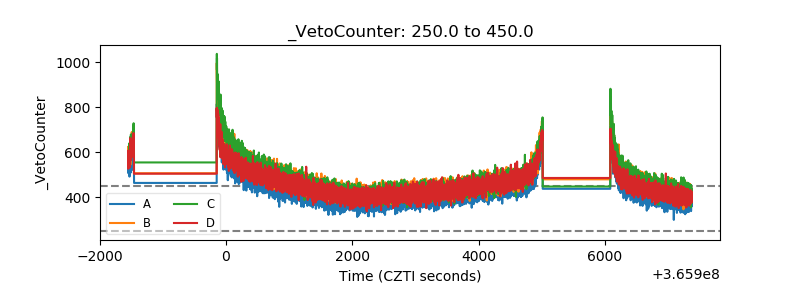 |