| Param | Original file | Final file |
|---|---|---|
| Filename | modeM0/AS1A10_056T01_9000004626_31660cztM0_level2.evt | modeM0/AS1A10_056T01_9000004626_31660cztM0_level2_quad_clean.evt |
| Size (bytes) | 570,280,320 | 103,435,200 |
| Size | 543.9 MB | 98.6 MB |
| Events in quadrant A | 3,279,711 | 673,076 |
| Events in quadrant B | 5,423,198 | 678,854 |
| Events in quadrant C | 3,861,752 | 652,284 |
| Events in quadrant D | 4,229,266 | 637,708 |
| Mode M0 | |||
|---|---|---|---|
| Quadrant | BADHDUFLAG | Total packets | Discarded packets |
| A | 0 | 14510 | 2 |
| B | 0 | 21536 | 2 |
| C | 0 | 15904 | 2 |
| D | 0 | 17368 | 2 |
| Mode M9 | |||
|---|---|---|---|
| Quadrant | BADHDUFLAG | Total packets | Discarded packets |
| A | 0 | 9 | 0 |
| B | 0 | 10 | 0 |
| C | 0 | 10 | 0 |
| D | 0 | 10 | 0 |
| Mode SS | |||
|---|---|---|---|
| Quadrant | BADHDUFLAG | Total packets | Discarded packets |
| A | 0 | 142 | 0 |
| B | 0 | 142 | 0 |
| C | 0 | 142 | 0 |
| D | 0 | 142 | 0 |
| Quadrant | Total seconds | Saturated seconds | Saturation percentage |
|---|---|---|---|
| A | 7046 | 32 | 0.454158% |
| B | 7046 | 126 | 1.788249% |
| C | 7046 | 193 | 2.739143% |
| D | 7046 | 59 | 0.837355% |
Noise dominated data is calculated using 1-second bins in cleaned event files. If a bin has >2000 counts, and if more than 50% of those come from <1% of pixels, then it is considered to be noise-dominated and hence unusable.
| Quadrant | # 1 sec bins | Bins with >0 counts | Bins with >2000 counts | High rate bins dominated by noise | Noise dominated (total time) | Noise dominated (detector-on time) | Marked lightcurve |
|---|---|---|---|---|---|---|---|
| A | 7721 | 7047 | 0 | 0 | 0.00% | 0.00% | 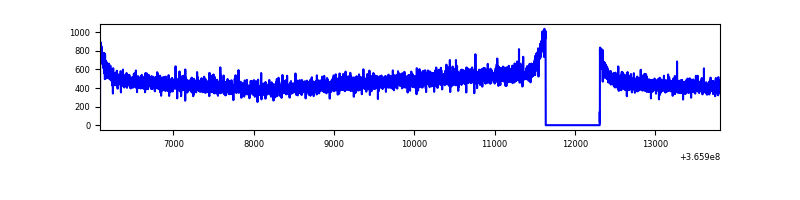 |
| B | 7721 | 7047 | 0 | 0 | 0.00% | 0.00% | 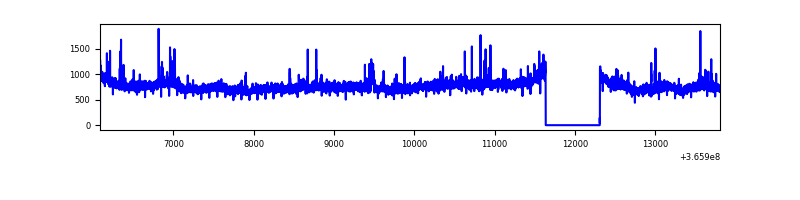 |
| C | 7721 | 7047 | 34 | 34 | 0.44% | 0.48% | 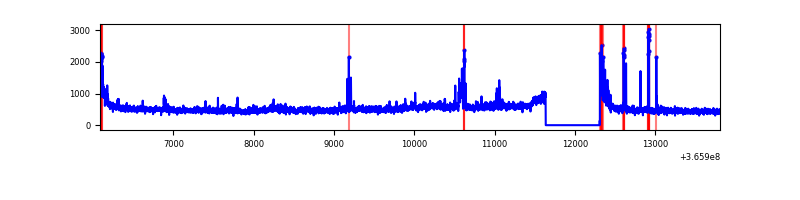 |
| D | 7721 | 7047 | 30 | 30 | 0.39% | 0.43% | 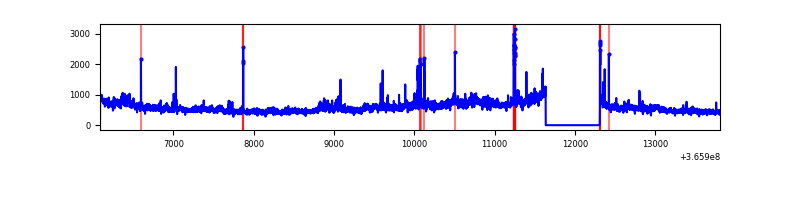 |
Top three noisy pixels from each quadrant. If the there are fewer than three noisy pixels in the level2.evt file, extra rows are filled as -1
| Pixel properties | Quadrant properties | ||||||
|---|---|---|---|---|---|---|---|
| Quadrant | DetID | PixID | Counts | Sigma | Mean | Median | Sigma |
| A | 13 | 254 | 12322 | 67.03 | 848 | 831 | 171.4 |
| A | 3 | 137 | 8718 | 46.01 | 848 | 831 | 171.4 |
| A | 0 | 226 | 7203 | 37.17 | 848 | 831 | 171.4 |
| B | 6 | 159 | 1935239 | 11825.6 | 848 | 826 | 163.6 |
| B | 4 | 80 | 95465 | 578.55 | 848 | 826 | 163.6 |
| B | 0 | 190 | 30146 | 179.24 | 848 | 826 | 163.6 |
| C | 3 | 233 | 236459 | 1229.75 | 815 | 820 | 191.6 |
| C | 0 | 10 | 174958 | 908.79 | 815 | 820 | 191.6 |
| C | 14 | 238 | 132183 | 685.56 | 815 | 820 | 191.6 |
| D | 8 | 195 | 997562 | 5166.15 | 817 | 797 | 192.9 |
| D | 2 | 250 | 49584 | 252.86 | 817 | 797 | 192.9 |
| D | 2 | 153 | 45764 | 233.06 | 817 | 797 | 192.9 |
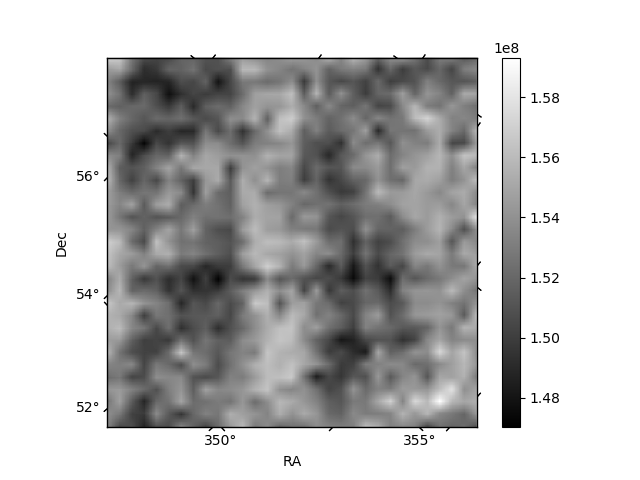
Histogram calculated using DETX and DETY for each event in the final _common_clean file
| Quadrant A | 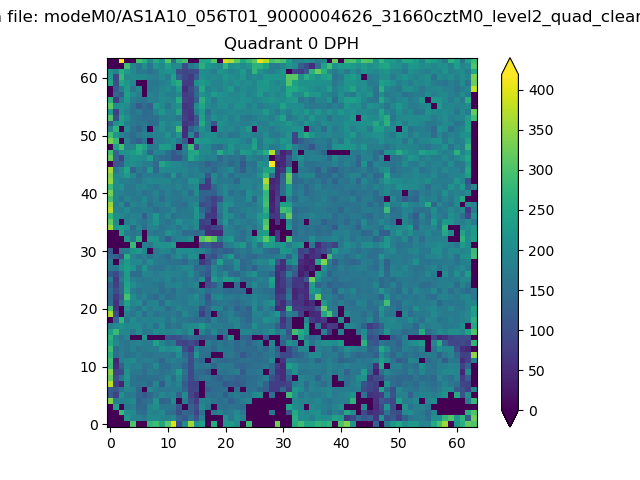 |
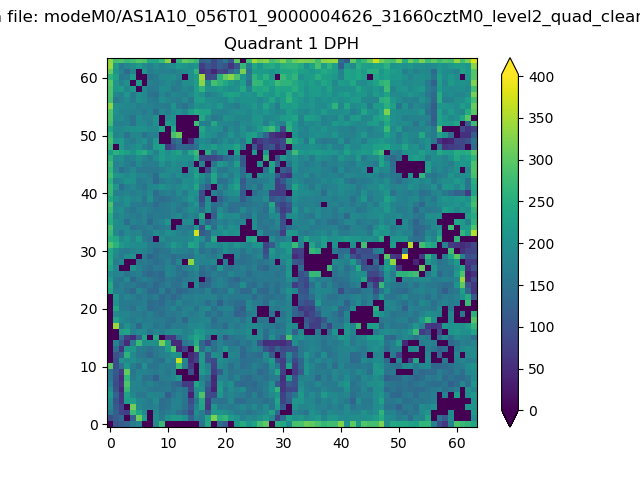 |
Quadrant B |
|---|---|---|---|
| Quadrant D | 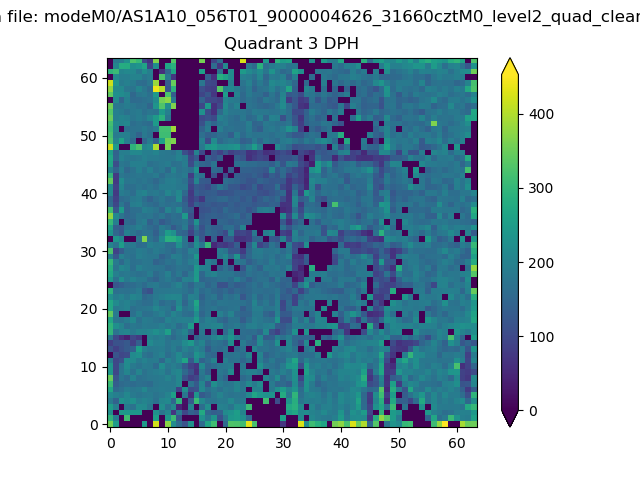 |
 |
Quadrant C |
| Plot type | Count rate plots | Images |
|---|---|---|
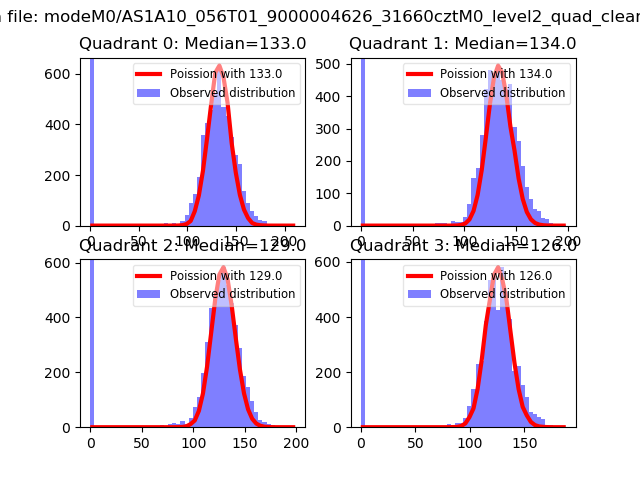
| Comparison with Poisson distribution Blue bars denote a histogram of data divided into 1 sec bins. Red curve is a Poisson curve with rate = median count rate of data. |
 |
 |
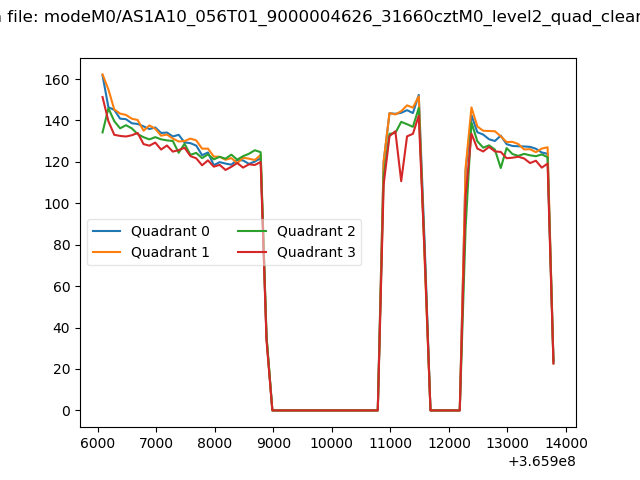
| Quadrant-wise count rates Data is divided into 100 sec bins |
 |
|
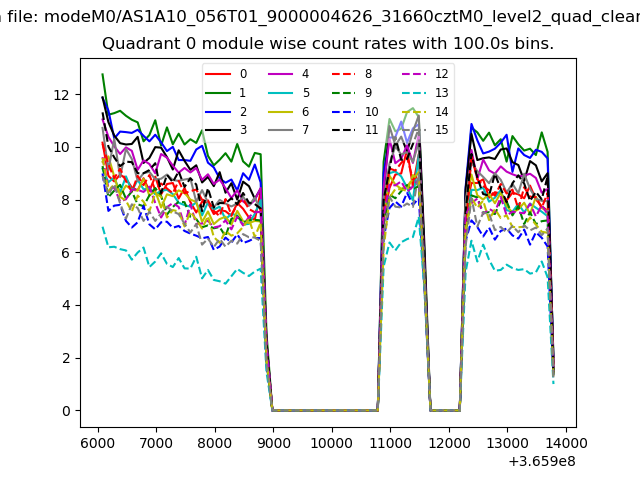
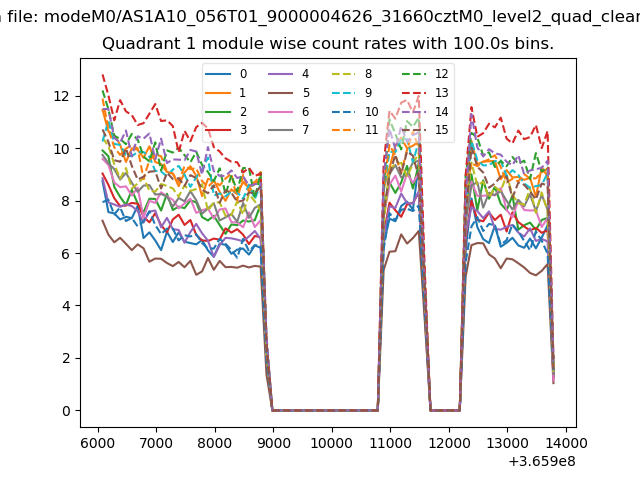
| Module-wise count rates for Quadrant A Data is divided into 100 sec bins |
 |
 |
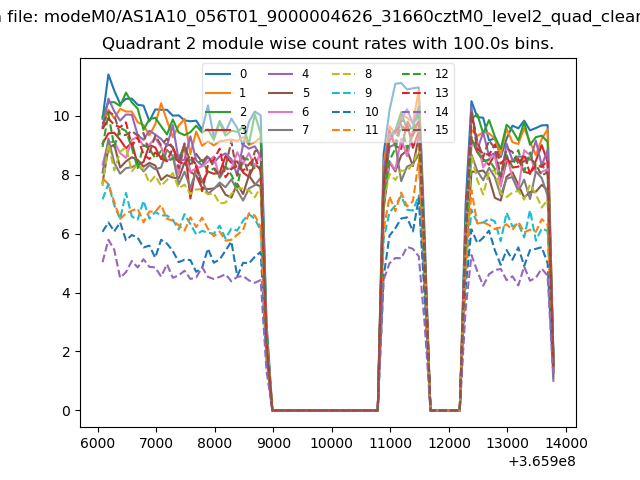
| Module-wise count rates for Quadrant B Data is divided into 100 sec bins |
 |
 |
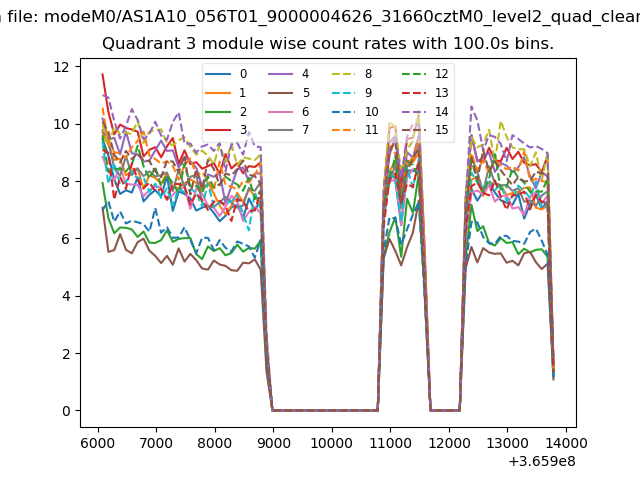
| Module-wise count rates for Quadrant C Data is divided into 100 sec bins |
 |
 |
| Module-wise count rates for Quadrant D Data is divided into 100 sec bins |
 |
 |
| Parameter | Plot |
|---|---|
| CZT HV Monitor | 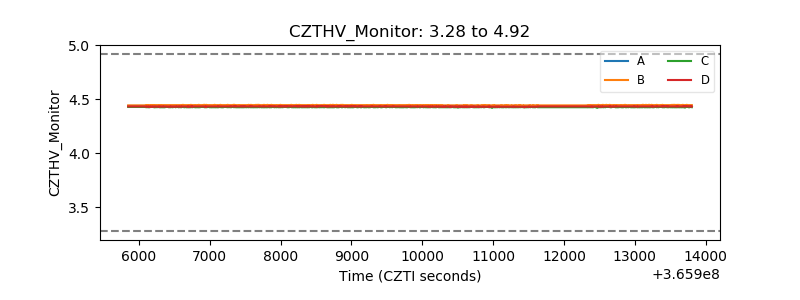 |
| D_VDD | 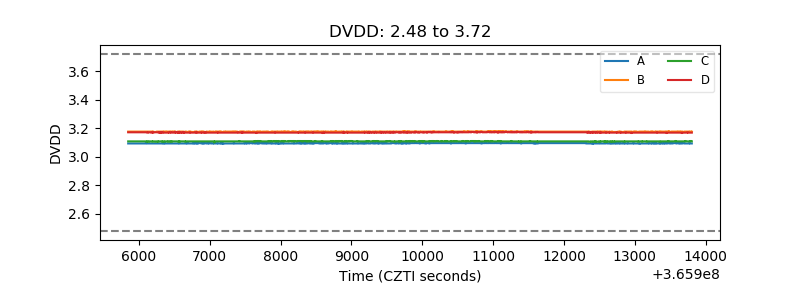 |
| Temperature 1 | 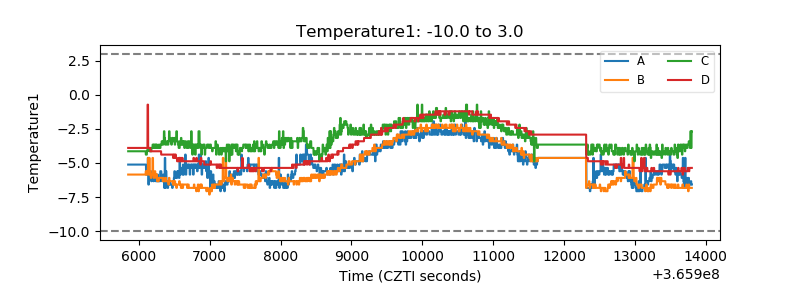 |
| Veto HV Monitor | 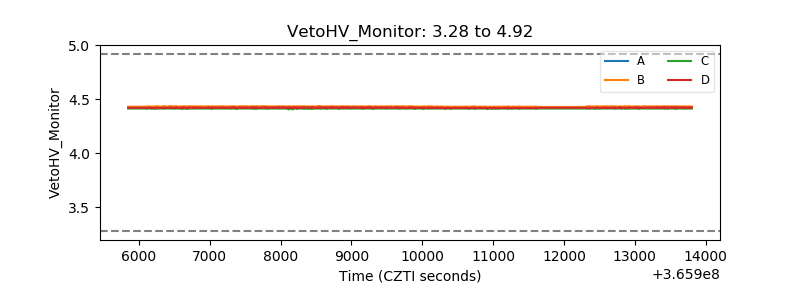 |
| Veto LLD | 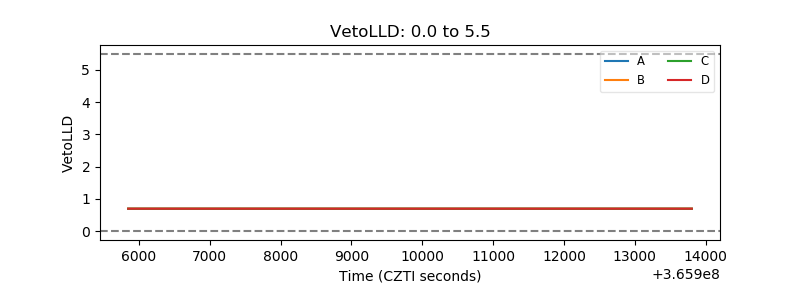 |
| Alpha Counter | 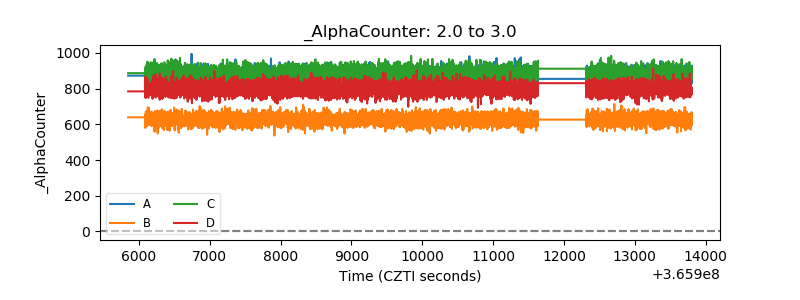 |
| _CPM_Rate | 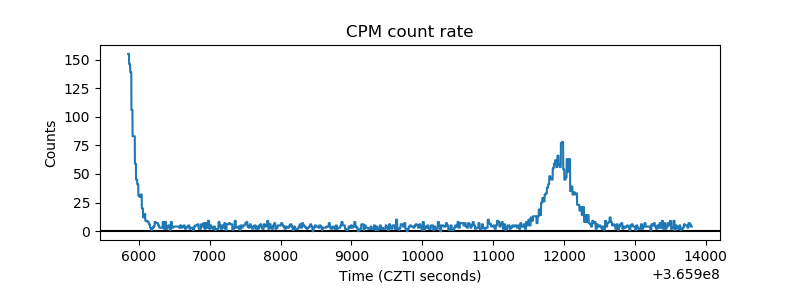 |
| CZT Counter | 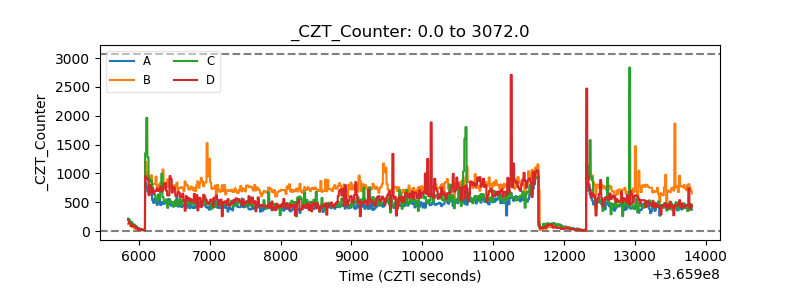 |
| +2.5 Volts monitor |  |
| +5 Volts monitor |  |
| _ROLL_ROT |  |
| _Roll_DEC | 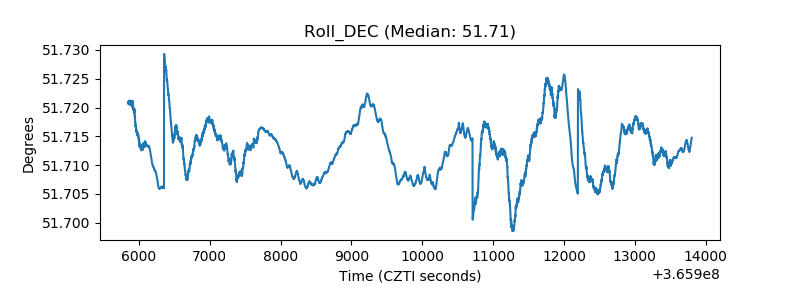 |
| _Roll_RA | 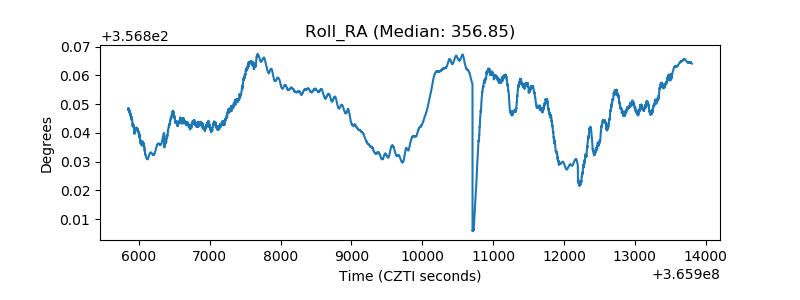 |
| Veto Counter |  |