| Param | Original file | Final file |
|---|---|---|
| Filename | modeM0/AS1A10_056T01_9000004626_31661cztM0_level2.evt | modeM0/AS1A10_056T01_9000004626_31661cztM0_level2_quad_clean.evt |
| Size (bytes) | 606,816,000 | 111,251,520 |
| Size | 578.7 MB | 106.1 MB |
| Events in quadrant A | 3,502,947 | 725,938 |
| Events in quadrant B | 5,901,117 | 727,270 |
| Events in quadrant C | 4,389,724 | 696,329 |
| Events in quadrant D | 4,071,543 | 693,327 |
| Mode M0 | |||
|---|---|---|---|
| Quadrant | BADHDUFLAG | Total packets | Discarded packets |
| A | 0 | 15582 | 2 |
| B | 0 | 23446 | 2 |
| C | 0 | 17939 | 2 |
| D | 0 | 17176 | 2 |
| Mode M9 | |||
|---|---|---|---|
| Quadrant | BADHDUFLAG | Total packets | Discarded packets |
| A | 0 | 7 | 0 |
| B | 0 | 8 | 0 |
| C | 0 | 8 | 0 |
| D | 0 | 8 | 0 |
| Mode SS | |||
|---|---|---|---|
| Quadrant | BADHDUFLAG | Total packets | Discarded packets |
| A | 0 | 154 | 0 |
| B | 0 | 154 | 0 |
| C | 0 | 154 | 0 |
| D | 0 | 154 | 0 |
| Quadrant | Total seconds | Saturated seconds | Saturation percentage |
|---|---|---|---|
| A | 7563 | 85 | 1.123893% |
| B | 7563 | 259 | 3.424567% |
| C | 7563 | 276 | 3.649345% |
| D | 7563 | 76 | 1.004892% |
Noise dominated data is calculated using 1-second bins in cleaned event files. If a bin has >2000 counts, and if more than 50% of those come from <1% of pixels, then it is considered to be noise-dominated and hence unusable.
| Quadrant | # 1 sec bins | Bins with >0 counts | Bins with >2000 counts | High rate bins dominated by noise | Noise dominated (total time) | Noise dominated (detector-on time) | Marked lightcurve |
|---|---|---|---|---|---|---|---|
| A | 7753 | 7564 | 0 | 0 | 0.00% | 0.00% | 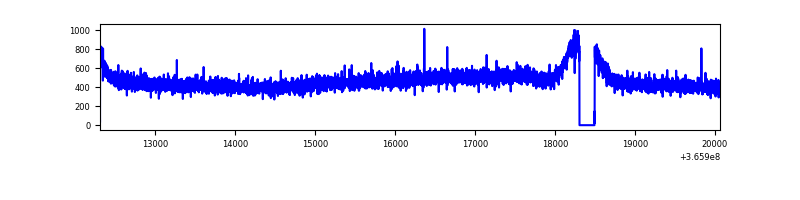 |
| B | 7753 | 7564 | 31 | 31 | 0.40% | 0.41% | 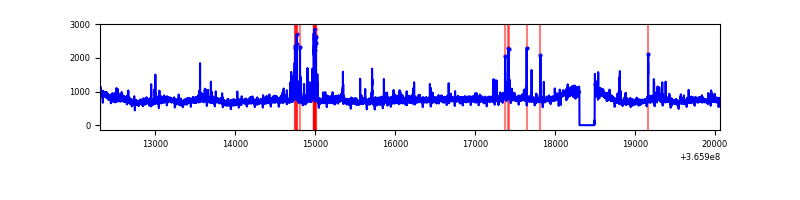 |
| C | 7753 | 7564 | 22 | 22 | 0.28% | 0.29% | 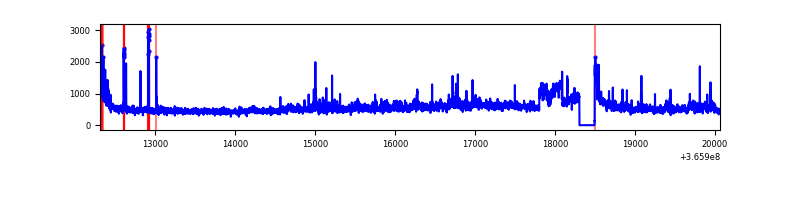 |
| D | 7753 | 7564 | 12 | 12 | 0.15% | 0.16% | 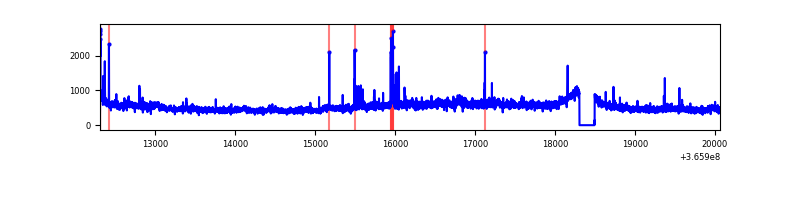 |
Top three noisy pixels from each quadrant. If the there are fewer than three noisy pixels in the level2.evt file, extra rows are filled as -1
| Pixel properties | Quadrant properties | ||||||
|---|---|---|---|---|---|---|---|
| Quadrant | DetID | PixID | Counts | Sigma | Mean | Median | Sigma |
| A | 13 | 254 | 12237 | 62.44 | 906 | 887 | 181.8 |
| A | 3 | 137 | 9579 | 47.82 | 906 | 887 | 181.8 |
| A | 0 | 226 | 7584 | 36.84 | 906 | 887 | 181.8 |
| B | 6 | 159 | 2048110 | 11634.28 | 900 | 874 | 176.0 |
| B | 4 | 80 | 217591 | 1231.59 | 900 | 874 | 176.0 |
| B | 0 | 190 | 45130 | 251.5 | 900 | 874 | 176.0 |
| C | 3 | 233 | 558161 | 2733.8 | 867 | 870 | 203.9 |
| C | 0 | 10 | 211973 | 1035.57 | 867 | 870 | 203.9 |
| C | 14 | 238 | 140344 | 684.19 | 867 | 870 | 203.9 |
| D | 8 | 195 | 646038 | 3110.78 | 877 | 855 | 207.4 |
| D | 2 | 250 | 56369 | 267.66 | 877 | 855 | 207.4 |
| D | 2 | 234 | 30221 | 141.59 | 877 | 855 | 207.4 |
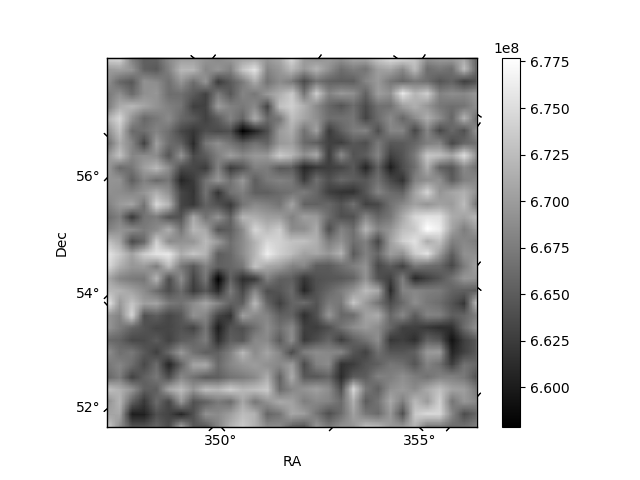
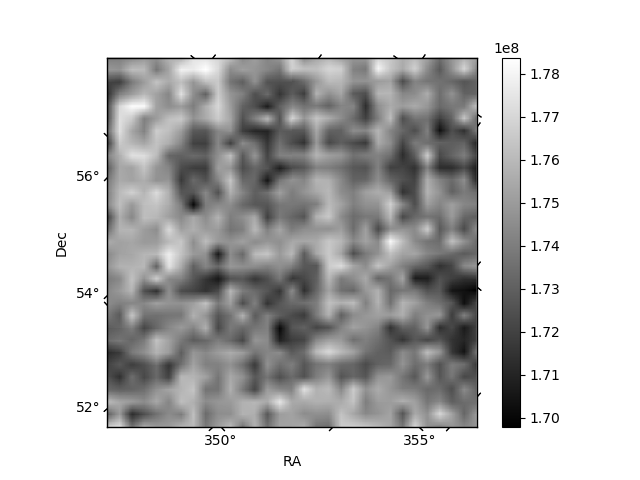
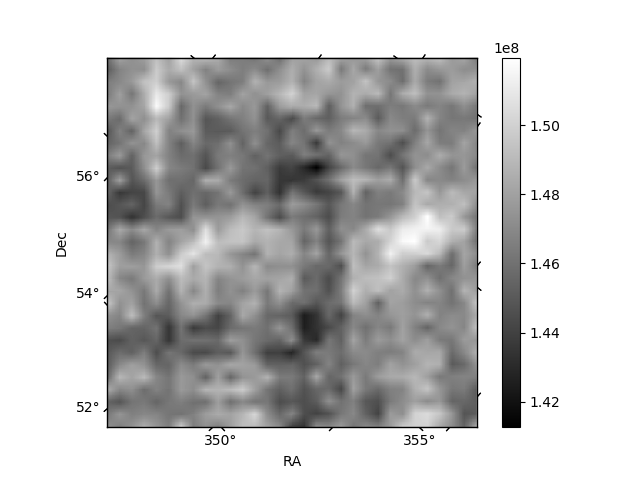
Histogram calculated using DETX and DETY for each event in the final _common_clean file
| Quadrant A | 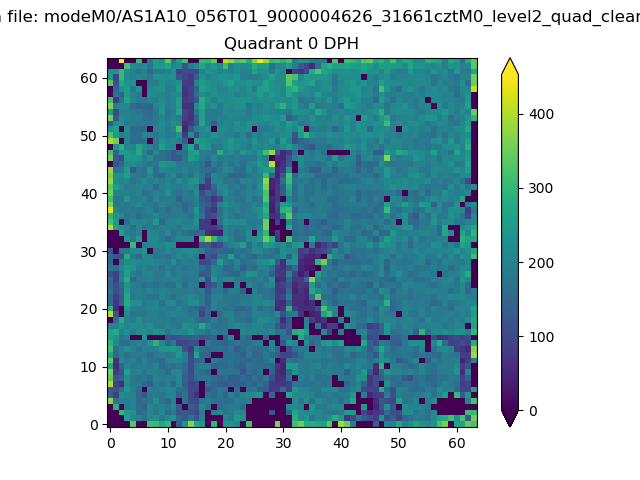 |
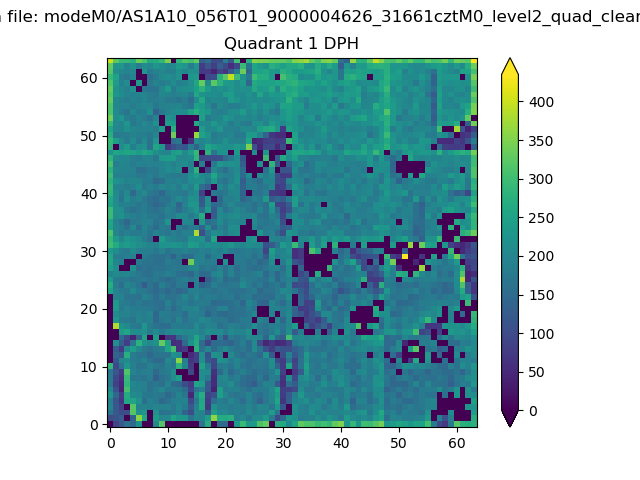 |
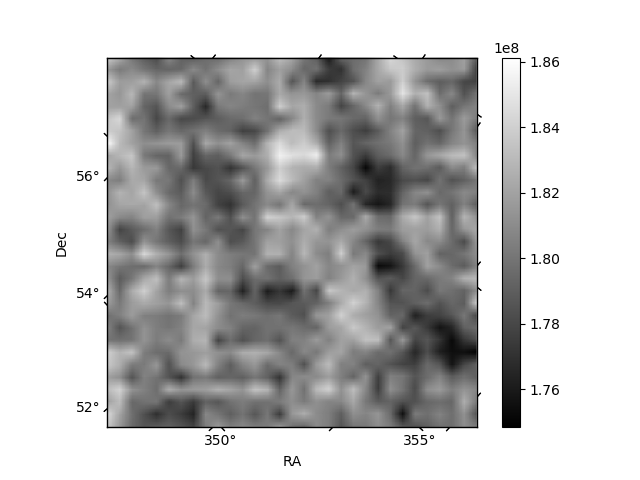
Quadrant B |
|---|---|---|---|
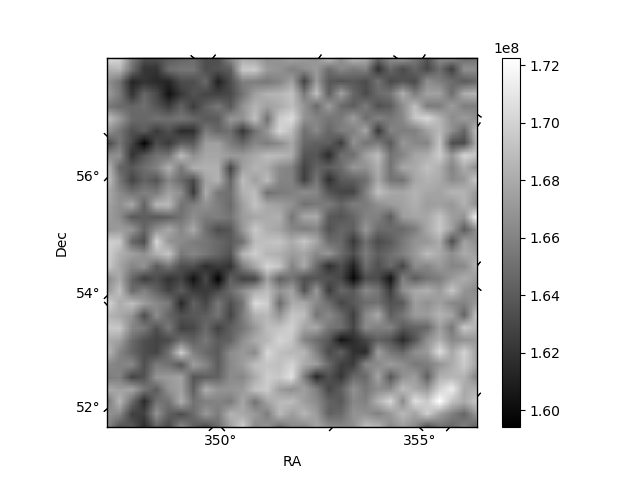
| Quadrant D | 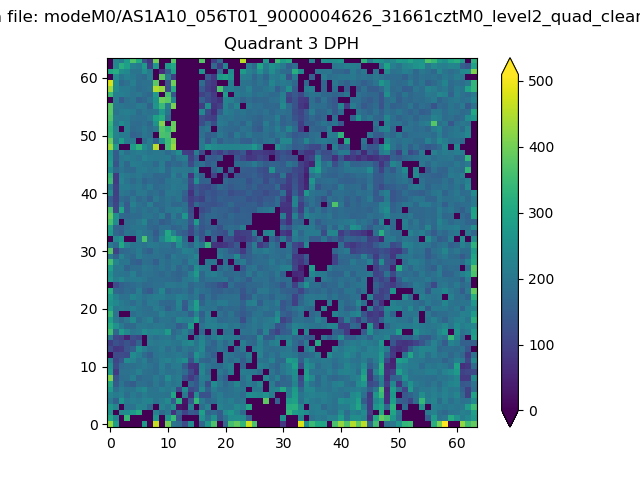 |
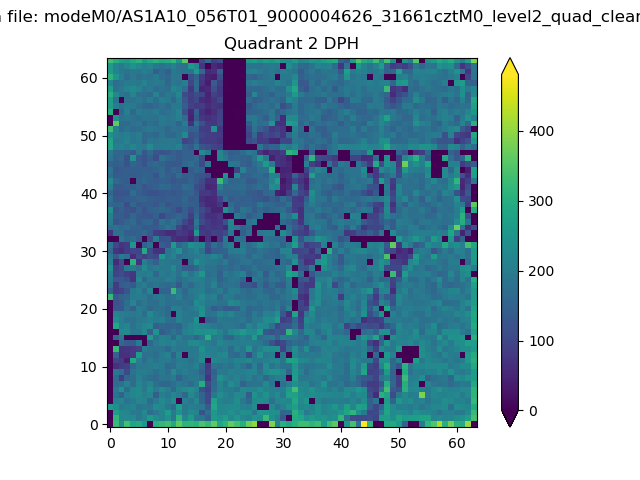 |
Quadrant C |
| Plot type | Count rate plots | Images |
|---|---|---|
| Comparison with Poisson distribution Blue bars denote a histogram of data divided into 1 sec bins. Red curve is a Poisson curve with rate = median count rate of data. |
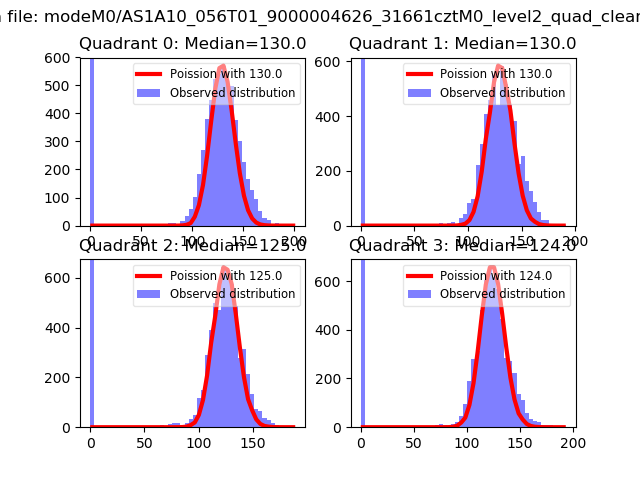 |
 |
| Quadrant-wise count rates Data is divided into 100 sec bins |
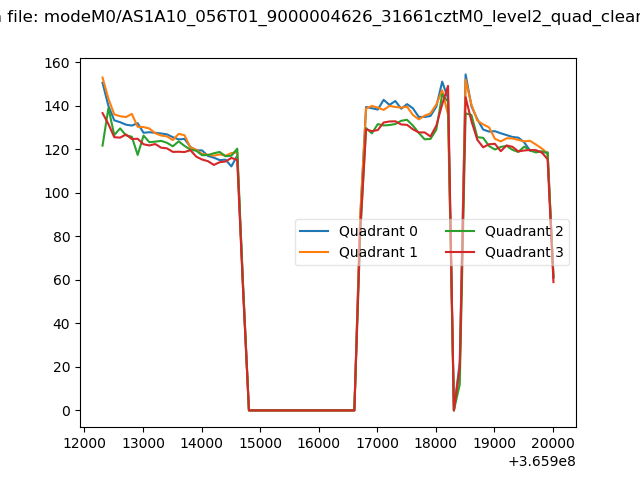 |
|
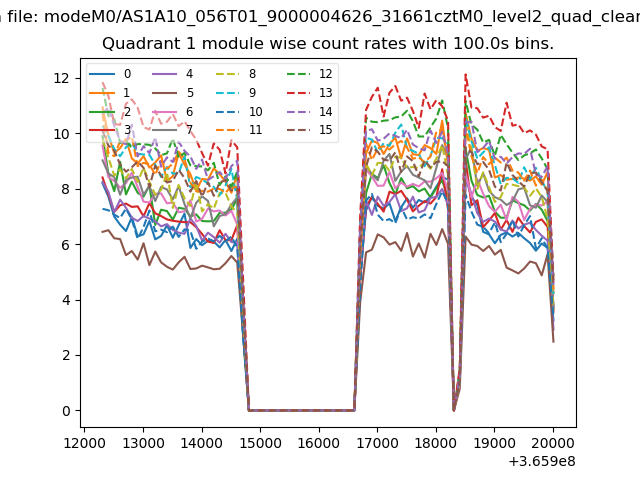
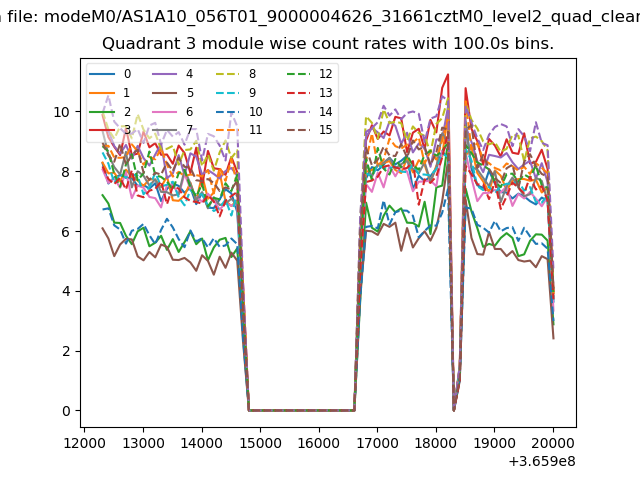
| Module-wise count rates for Quadrant A Data is divided into 100 sec bins |
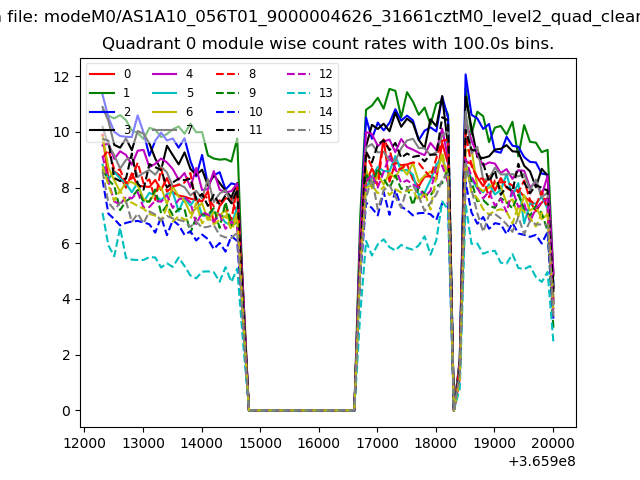 |
 |
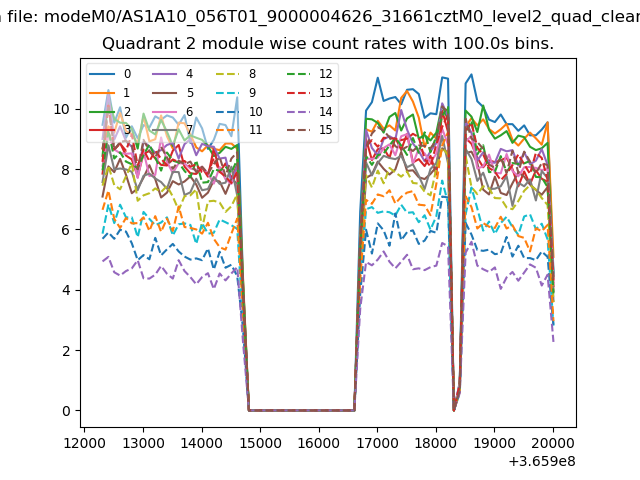
| Module-wise count rates for Quadrant B Data is divided into 100 sec bins |
 |
 |
| Module-wise count rates for Quadrant C Data is divided into 100 sec bins |
 |
 |
| Module-wise count rates for Quadrant D Data is divided into 100 sec bins |
 |
 |
| Parameter | Plot |
|---|---|
| CZT HV Monitor | 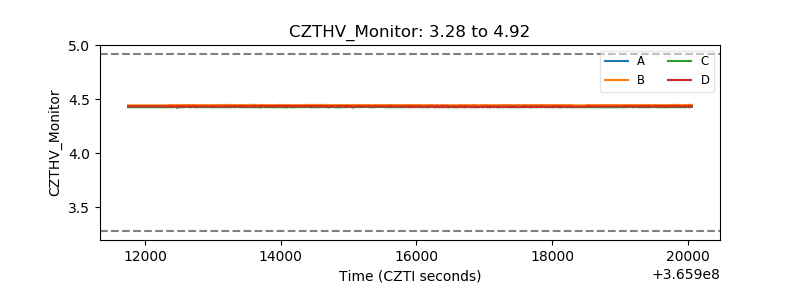 |
| D_VDD | 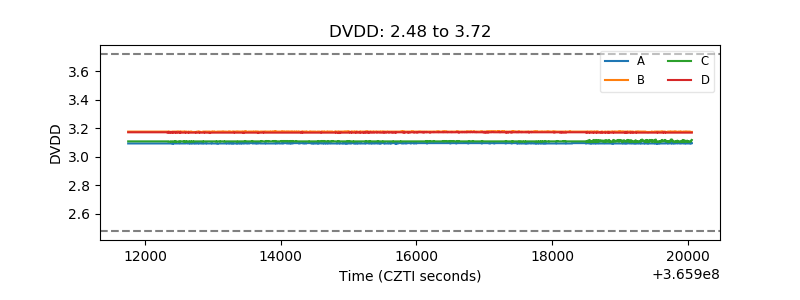 |
| Temperature 1 | 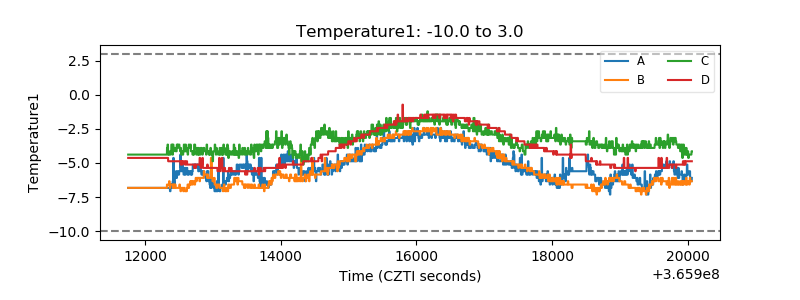 |
| Veto HV Monitor | 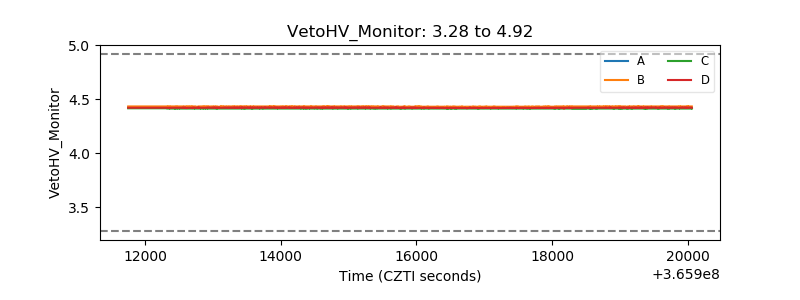 |
| Veto LLD | 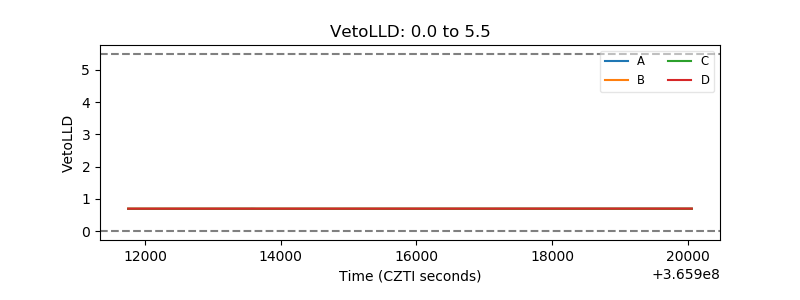 |
| Alpha Counter |  |
| _CPM_Rate |  |
| CZT Counter | 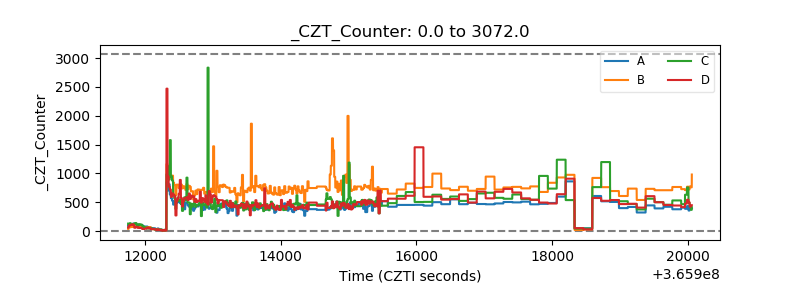 |
| +2.5 Volts monitor |  |
| +5 Volts monitor |  |
| _ROLL_ROT | 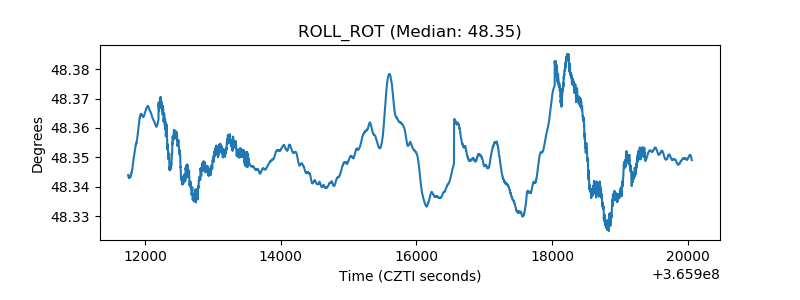 |
| _Roll_DEC | 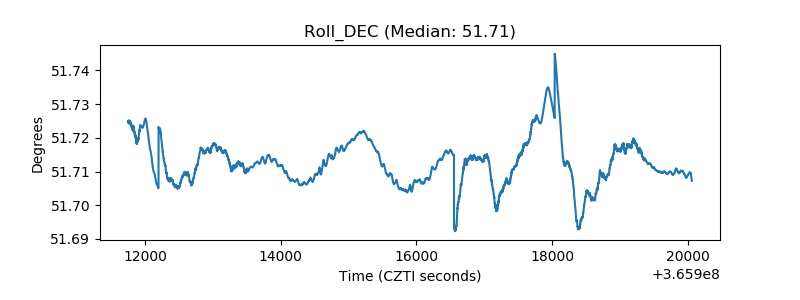 |
| _Roll_RA | 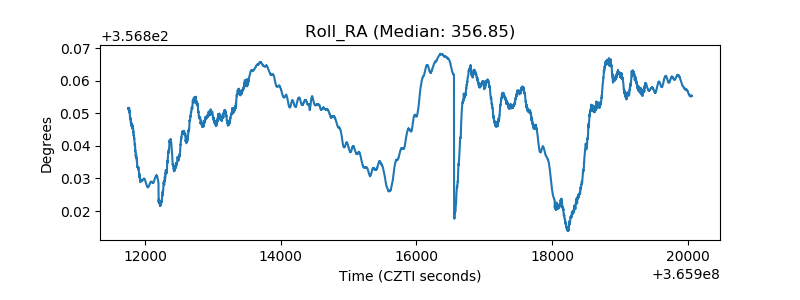 |
| Veto Counter | 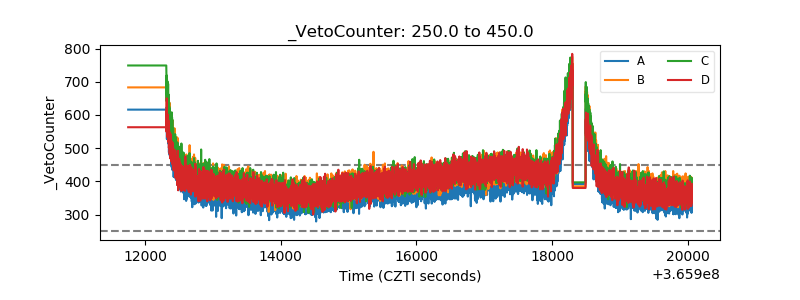 |